
Optical Non-invasive Flowmetry without Lasers and Coherent Light
D. A. Rogatkin
1a
, D. G. Lapitan
1,2 b
and S. Persheyev
3c
1
Moscow Regional Research and Clinical Institute “MONIKI” after M.F.Vladimirskiy, 61/2 Shepkina str., Moscow,
Russian Federation
2
LLC “ODS-MED”, Pushchino, Microdistrict “B”, b.2, Moscow Region, Russian Federation
3
School of Physics and Astronomy, St Andrews University, St Andrews, U.K.
Keywords: Laser, Flowmetry, Blood Flow, Doppler Effect, Tissue, Spectrum, Intensity, Fluctuation, Incoherent Light.
Abstract: Laser Doppler Flowmetry (LDF) and other optical technique to measure a blood flow in tissues noninvasively
(in vivo) are well-known today. Meanwhile, in spite of more than 40-year history, they do not have
applications in real clinical practice yet. This situation could be a consequence of incorrect understanding of
the physical basics of these methods and, accordingly, of insufficient hardware design, software algorithms,
as well as of erroneous interpretation of the data measured. The basic theory of physical principles of LDF is
the model developed by R.Bonner and R.Nossal in 1980. However, it does not describe many phenomena,
low-frequency fluctuations of optical fields due to a variable blood content in a tissue diagnostic volume, for
example. In this study, we assumed that the low-frequency part of the power spectrum could provide the same
information about the blood flow as the middle- and high-frequency parts provide it in LDF. Moreover, we
proposed the use of coherent light source could be avoided in this case. We have developed a much simpler
and low-cost LED-based prototype and confirmed our assumptions in experiments. Thus, we proposed a new
technique to build simple and economic optical diagnostic tool to evaluate a blood flow in tissues.
1 INTRODUCTION
Optical noninvasive diagnostic techniques, which use
lasers and coherent light for assessment of a tissue
blood flow, such as Laser Doppler Flowmetry (LDF),
Laser Speckle Contrast Imaging (LSCI), etc., are
well-known today. All of them have already proven
its usefulness in a number of medical disciplines
(Briers, 2001), (Rajan et al., 2009), (Roustit et al.,
2012). However, in spite of more than 40-year
history, they are not used yet in a clinical practice
daily. They have many implementations in different
medical research, but their practical applications,
without which a practicing clinician cannot work
today, are not known. Large fluctuations of the output
as well as a low reproducibility of the result often lead
to an inability of the personal diagnostic conclusion
with the use of this technique. Only at scientific
studies in groups of patients, when data are averaged
in groups, there are steadily observed significant
differences in groups.
a
https://orcid.org/0000-0002-7755-308X
b
https://orcid.org/0000-0003-3862-0144
c
https://orcid.org/0000-0003-3970-0488
In our opinion, this situation can be a consequence
of incorrect understanding of the physical basics of
these methods and, accordingly, of not enough correct
hardware design, software algorithms, as well as of
erroneous interpretation of the data measured. If to
consider, for example, the LDF technique, anyone
can see that in the LDF theory the formation of low-
frequency components of the input optical signal is
poorly explained. The basic theory of forming the
optical input signal in LDF is the well-known model
developed by R. Bonner and R. Nossal (B&N model)
(Bonner and Nossal, 1981). Physically based on the
light-beating spectroscopy (Cummins et al., 1970)
and the Doppler effect at light scattering on moving
red blood cells (RBCs) (Nilsson et al., 1980), this
model became the most used and, practically, the
almost single-used theory of LDF. Authors derived
and introduced a power spectrum of the analyzed
signal in the form of the exponential decay, similar to
a fractal noise (1/ω noise, where ω is a frequency).
This power spectrum was then well confirmed in
Rogatkin, D., Lapitan, D. and Persheyev, S.
Optical Non-invasive Flowmetry without Lasers and Coherent Light.
DOI: 10.5220/0009098402150220
In Proceedings of the 13th International Joint Conference on Biomedical Engineering Systems and Technologies (BIOSTEC 2020) - Volume 1: BIODEVICES, pages 215-220
ISBN: 978-989-758-398-8; ISSN: 2184-4305
Copyright
c
2022 by SCITEPRESS – Science and Technology Publications, Lda. All rights reserved
215
experiments (Obeid et al., 1988). However, the nature
of the spectrum can be different, controversial and
debatable, in our opinion. In the B&N model, this
spectrum on a photodetector’s surface is only formed
by the coherent light beating components due to a
heterodyne mixing of the initial probing optical field
and the field having a Doppler frequency shift at light
interaction with moving RBCs inside vessels. Neither
the unsteadiness of scattering properties of tissues
surrounding the vessels due to their compression by
pulsating vessels’ walls, nor any low-frequency
fluctuations (LFFs) of RBCs amount in a diagnostic
volume are not taken into account. Meanwhile, in
recent years a number of authors showed that LFF in
tissue scattering properties can be reflected in the
registered optical signal (Nippolainen et al., 2015),
that variable RBCs content in a diagnostic volume
may play an important role in formation of a low-
frequency part of the power spectrum (Lapitan and
Rogatkin, 2016), or that in LDF the same power
spectrum P(ω) can theoretically be derived from
completely other assumptions (Lapitan et al., 2017).
Therefore, in this study we proposed that the low-
frequency part of the power spectrum could provide
the same information about the blood flow as the
middle- and high-frequency parts of it. Moreover, we
proposed that the coherent light is not mandatory to
form and to detect these LFF. We have developed a
novel, simple, not expensive LED-based prototype
and confirmed our assumptions in experiments.
2 THEORETICAL
BACKGROUND
Due to the LDF and LSCI methods are the most
prevalent at present, as well as due to their results can
be converted into each other so that they can be
considered as of the one family techniques (Bi et al.,
2015), (Fredriksson et al., 2016), we will only
consider in this study the LDF theory, the B&N
model, in particular. The main theoretical statement
of the B&N model, which is also used in all other
versions of the LDF theory (Fredriksson et al., 2007),
(Binzoni and Martelli, 2017), is that the blood
Perfusion Index (PI) or the Blood Flow (BF) can be
determined by analysis of the spectral power density
of the recorded photocurrent (Bonner and Nossal,
1981), (Nilsson et al., 1980). A number of authors use
the amplitude spectrum of the photocurrent or a
photovoltage (Obeid et al., 1988), (Rajan et al., 2009),
but this does not greatly affect the output.
In the case of a photocurrent power spectrum, BF
in LDF is determined by the equation:
(1)
Here ω denotes the angular frequency, P(ω) – the
power spectrum or the amplitude spectrum of a
photocurrent i(t), k
0
– a dimensional coefficient of a
proportionality. In the case of a power spectrum, P(ω)
can be calculated with the use of the well-known
Wiener–Khintchine theorem (Cummins et al., 1970):
〈
〉
.
(2)
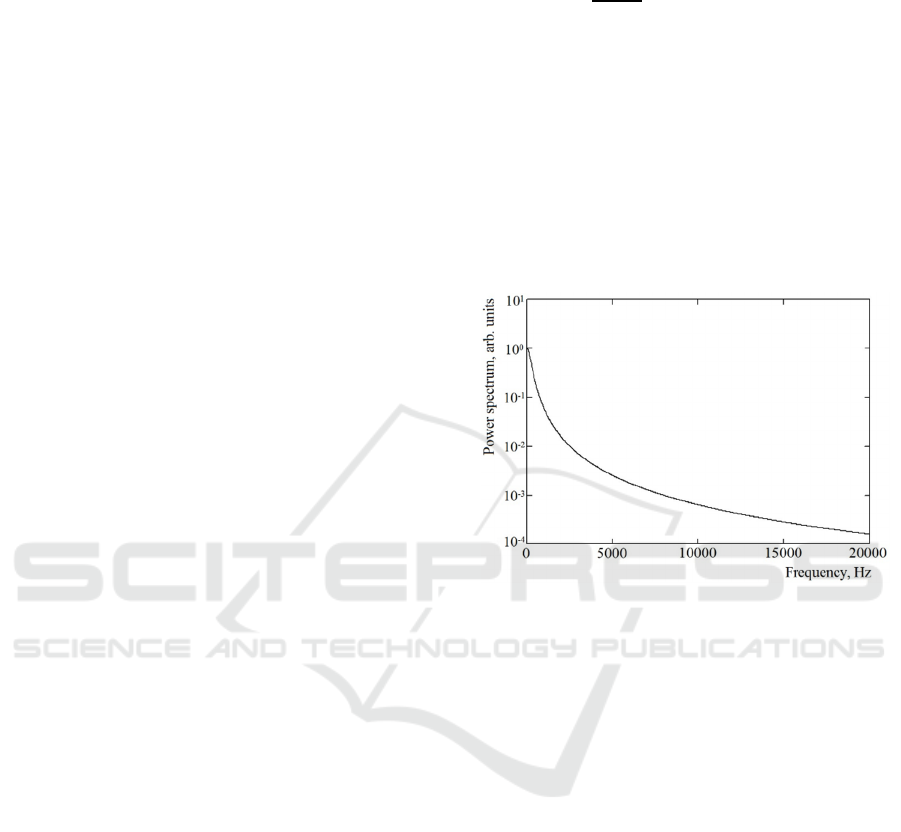
The typical in LDF power spectrum P(ω) of a
photocurrent i(t) is presented in Figure 1.
Figure 1: The typical power spectrum P(ω) of a
photocurrent i(t) described in the B&N model by Eq.2.
In the case of a photocurrent amplitude spectrum,
an equation similar to Eq.1 is used to calculate BF.
The only difference is in the constant k
0
and in the
normalization parameter <i(t)>
2
. Normalization for
photocurrent amplitude spectra should be performed
using the constant component of the photocurrent
i
dc
=<i(t)>. Thus, to evaluate BF in tissues the power
spectrum or the signal amplitude spectrum is only the
key input physical values for data processing. Factors
that form these spectra do not play any important role
for the explored problem.
Usually, in LDF the region of the Doppler effect
ranges from ω
1
=30 Hz to ω
2
=30 kHz (Koelink et al.,
1994). Below 30 Hz a photoplethysmographic effect
and motional artifacts are considered dominant.
Therefore, the lower waveband is assumed to be not
useful to calculate BF (Bonner and Nossal, 1981) and,
so, reputedly, not used in LDF-meters by means of
hardware filtering.
Nevertheless, in many publications the spectral
density of a photocurrent or a photovoltage amplitude
spectrum covering the range 1-500 Hz with a
maximum of amplitudes at units or tens of Hz are
〈
〉
∙
.
BIODEVICES 2020 - 13th International Conference on Biomedical Electronics and Devices
216
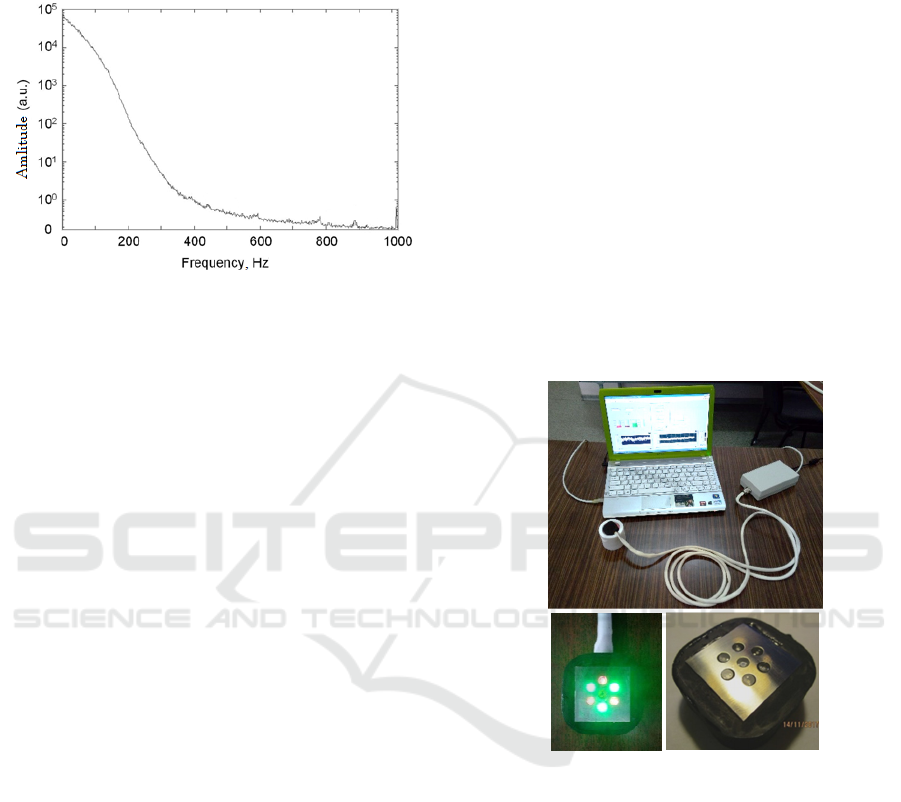
presented (Obeid et al., 1988), (Hu et al., 2013). For
example, Figure 2 represents the
i(t)
spectrum
measured in a portable LDF-meter (Hu et al., 2013).
Figure 2: The low-frequency spectrum of the i(t)
inside a
portable LDF-meter
(Hu et al., 2013).
Recently it was additionally showed (Lapitan et
al., 2018), that in a number of commercially available
LDF-meters, LFFs of the input optical signal can pass
to the output and can influence on the BF calculated
through the normalization parameter (denominator)
<i(t)>
2
. Usually, this mean value is calculated with
the use of a time window of approximately 0,5-1
second. Therefore <i(t)> can have LFFs below 1-2
Hz. Being squared this will give a wider range of the
spectrum. Generally speaking, LSCI technique is
based on the temporal LFFs of the speckle pattern
contrast or of the field correlation function g
(1)
at a
coherent illumination, as well (Fredriksson et al.,
2016). In LDF, the existence of the optical LFFs in a
tissue microvasculature at external illumination by
stationary-power laser light is now well confirmed
both in experiments (Mizeva et al., 2015), (Mizeva et
al., 2016), and theoretically (Lapitan and Rogatkin,
2016). In the latter case, LFFs were derived as a result
of a variable blood content in the microvasculature.
However, the B&N model does not describe any
LFFs of optical signals. The model was formulated at
the assumption, that amplitudes of all scattered fields
are stationary. In the theory, the blood volume in a
microvasculature is stationary, as well. However,
inside alive tissues these assumptions are wrong.
In our theoretical assumption, we relied on a
number of recently published data mentioned above.
First, we took into account that variable hyperaemia
can form LFFs of the input optical signal (Lapitan and
Rogatkin, 2016). Then, we considered the opinion
and experimental data that vessels’ walls motions at
hart beating compress surrounding connective tissues
changing their optical properties (Nippolainen et al.,
2015). At last, we took into consideration the fact that
the denominator <i(t)> can have LFFs, as well. All
these phenomena form the total LFFs spectra of the
registered and processed signal, which can be used to
calculate BF similar to LDF technique, but with the
use of the low-frequency waveband, below 30 Hz.
Moreover, we assumed, in this case coherent light to
form LFFs and to evaluate BF is not mandatory, so
light emitted diodes (LEDs) can be used as a source
of optical radiation. This technique we named as
Incoherent Optical Fluctuation Flowmetry (IOFF).
3 EXPERIMENTAL PART
3.1 Experimental Prototype
An experimental LED-based prototype that performs
the above method for measuring the skin BF (the skin
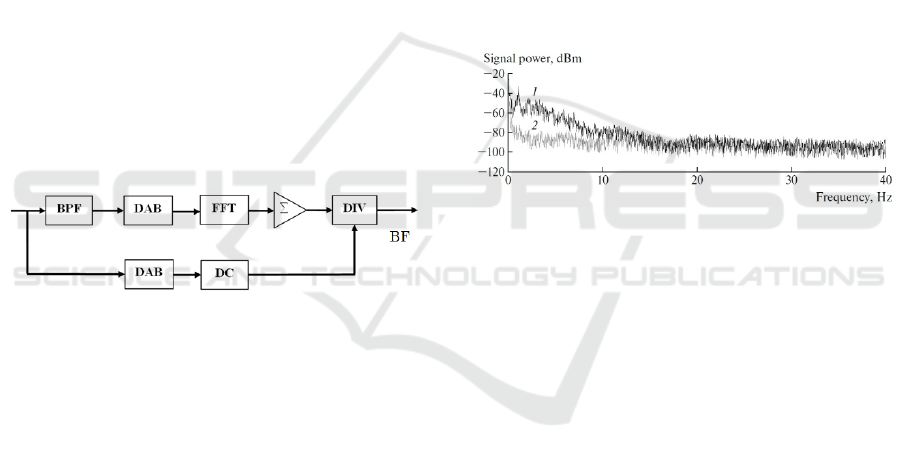
blood perfusion) was developed. The appearance of
the prototype is shown in Figure 3.
Figure 3: The appearance of the developed prototype for
measuring the skin blood flow (BF).
The prototype consists of the external optical
probe, the main electronic unit and a laptop with the
special software. In the optical probe, six green-light
LEDs for illuminating the examined skin are placed
radially around a photodetector - a silicon photodiode
– to provide a uniform illumination. The photodiode
registers backscattered radiation from a diagnostic
volume of skin under the optical probe. The narrow-
band radiation in the green spectral range of 560–580
nm was selected as probing radiation to use the
corresponding isosbestic point, at which the light
absorption by oxyhemoglobin and deoxyhemoglobin
in blood is equal. It prevented inaccuracies associated
with different light absorption by venous and arterial
fractions of blood in the diagnostic volume, because
Optical Non-invasive Flowmetry without Lasers and Coherent Light
217
the total signal from skin was collected by the
photodiode regardless of the percentage of
oxyhemoglobin/deoxyhemoglobin concentrations in
the tested volume of skin (diagnostic volume).
Incoherent illumination, LEDs, and the waveband
below 30 Hz allowed us to perform a pulsed regime
of the skin illumination. It is useful to avoid complex
differential scheme of the signal registration, which is
often used in LDF to compensate ambient light and
which is a source of the false spectra formation inside
the instrument (Lapitan et al, 2018). We used the
pulsed switching-on/switching-off regime for LEDs
with 50% duty cycle. The 320 Hz operating frequency
was chosen to satisfy the Nyquist criterion with the 5-
fold margin. During the switching-on time of LEDs
total backscattered probing radiation together with
existing ambient light were registered, while during
the switching-off time of LEDs the backscattered
ambient light was only registered and analysed.
Subtracting the ambient light signal from the total
signal registered, we eliminated the ambient radiation
impact on the registered probing radiation.
The purified from ambient light signal was further
amplified, digitized at the frequency of 320 Hz, and
processed in a laptop by the LabVieW-based software
to compute BF (Figure 4).
Figure 4: The block-diagram of data processing. BPF is the
band-pass filter, DAB is the data accumulation buffer, FFT
is the Fast Fourier Transform module, ∑ is the adder, DIV
is the divider, DC is the unit for extraction of the <i(t)>.
We used the photocurrent i(t) amplitude spectrum
technique to compute BF. First, the ac component of
the signal is extracted by a band-pass numerical
Butterworth filter (BPF) of the 2nd order (see the
upper way of the block-diagram). The frequency
range was chosen as follows: ω
1
=0,5 Hz and ω
2
=12
Hz. Next, the ac signal is accumulated in the data
buffer (DAB) within each 1 second. For this purpose,
a buffer sample size of 320 points was used. These
320 points are then directed every second to the Fast
Fourier Transform (FFT) module, where the
amplitude spectrum of the signal is formed. The
resolution of such a spectrum is 1 Hz. Finally, all
spectral components are summed in the adder Σ with
corresponding frequency weights (numerical
integration) and divided by the dc component of
i(t).
The dc component is obtained by averaging of all 320
signal magnitudes on the time interval 1 second (see
the lower way of the block-diagram). Thus, BF points
are formed as the output every 1 second.
To perform functional tests with skin heating, a
heating metal plate was incorporated in the optical
probe. Heating was performed by a pulsed current
with a pulse-width automatic modulation. An
operator can set the desired heating temperature of the
plate with a given heating rate.
3.2 Experimental Study and Results
At the initial step of our experimental study, to
confirm the presence in the spectra the proposed LFFs
at a continuous incoherent illumination of the tested
skin, we measured a photocurrent power spectrum
after the photodiode with the use of the standard
spectral equipment (L-CARD spectral analyzer, RF).
Figure 5 represents the typical spectral power density
of i(t) at the green-light LEDs illumination of the
fingerprint skin area of a volunteer.
Figure 5: Typical spectral power density of i(t) in in vivo
experiments. 1 - Healthy volunteer at a rest. 2 - Healthy
volunteer at the shoulder arterial occlusion.
As one can see, the normal blood flow in arms
forms visible LFFs in the spectral range 0-12 Hz,
while the arterial occlusion blocks LFFs. It confirms
well our assumptions. Doppler components in i(t) are
not presented in these spectra due to the absence of
the coherent illumination. It is also interesting to note
that the blood-pulsed spectral components with the
frequency of around 1 Hz are a visible part of the total
LFFs spectrum (see the spectrum 1), but they do not
form the power spectrum completely, as it might
seem from the theory of a photoplethysmography.
In addition, at the arterial occlusion we measured
and analyzed a behavior of the photovoltage dc
component. Like for a photocurrent, the photovoltage
dc component was calculated by averaging all 320
digitized signal points on a time interval of each one
second. Figure 6 shows the example of the behavior
and a corresponding BF computed with the use of this
photovoltage U. The example clearly shows a
decrease in ac components of the signal (decrease in
LFFs), and an increment dc of the dc component of
U at arterial occlusions.
BIODEVICES 2020 - 13th International Conference on Biomedical Electronics and Devices
218
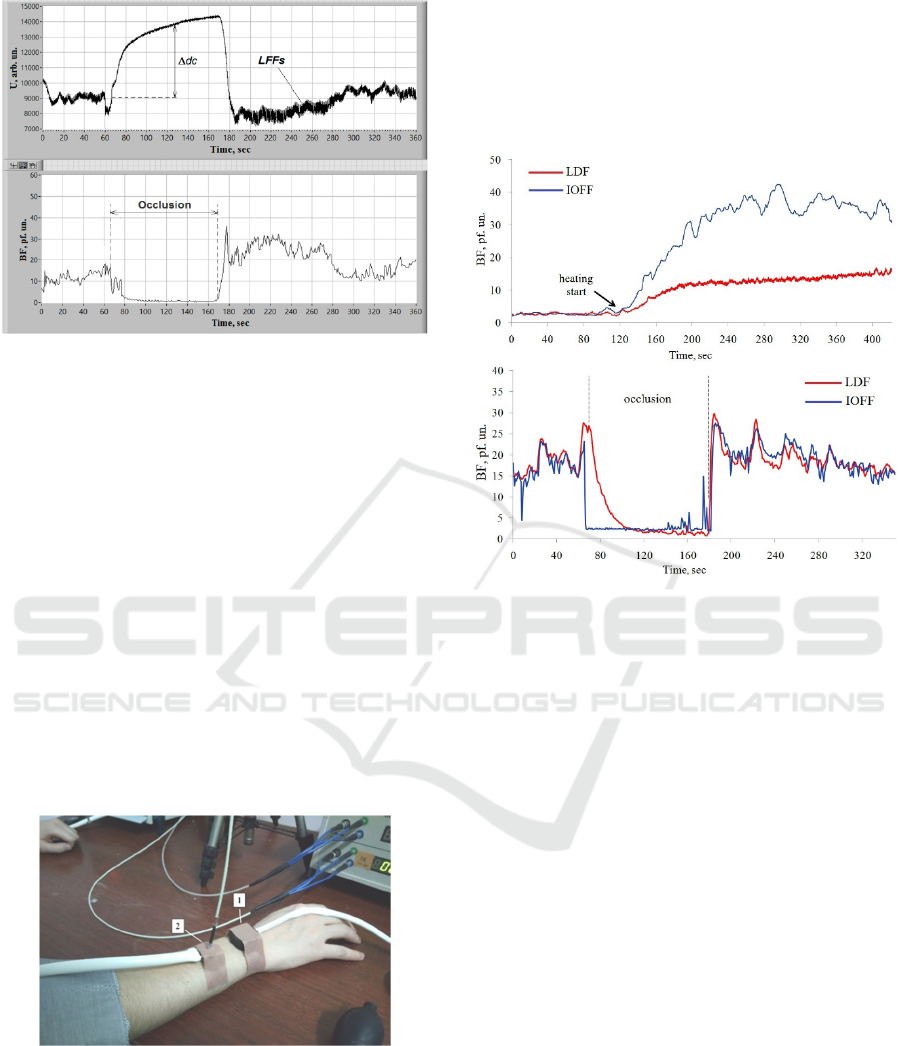
Figure 6: Example of the recorded dc photovoltage U
during a test with the shoulder arterial occlusion and the
corresponding BF computed.
Final steps of this our experimental study were
comparative measurements of BF with the use of our
new method and a standard LDF technique. Standard
LDF-meter LAKK-02 (LAZMA Ltd., RF) working at
the isosbestic point 808 nm was used as the reference
tool. Functional tests with skin heating and arterial
occlusion were carried out for the comparative study.
Figure 7 shows the design of the study. BF was
simultaneously measured in the outer side of a
forearm by IOFF optical probe (1) and by the standard
LDF optical fiber probe (2). To execute a test with
skin heating under the fiber optical probe, an external
heating probe was used. Final heating temperature for
both probes was 42
0
C. The same arm was explored to
execute tests with occlusion. Occlusion pressure was
applied by a standard tonometer’s cuff inflation.
Figure 7: Design of the comparative study.
To made results of two different measurements
comparable in BF magnitudes (in pf. un. - perfusion
units), it was necessary to select properly the
proportionality coefficient k
0
for the IOFF technique
in the main Equation 1, because for the standard LDF-
meter it was already embedded in its software and not
changeable. The needed value of the coefficient k
0
for
new IOFF technique was obtained by means of the
selection of the approximate equality of BF
magnitudes during the first test with occlusion.
Examples of the recorded BFs in these final
experiments are shown in Figure. 8.
Figure 8: Examples of the recorded BF during heating (top)
and arterial occlusion (bottom) tests with the simultaneous
usage of IOFF and LDF techniques.
As seen in the Figure 8, the measured BFs were
similar even in details at arterial occlusions, while at
the heating test IOFF technique showed the enhanced
sensitivity. Probably, it is a consequence of different
wavebands used – green in the IOFF case and near
infrared in the LDF one. Nevertheless, the result is
visible. Our assumptions were confirmed well.
4 CONCLUSIONS
Relying on a number of recently published data, in
this study we assumed a strong influence of low-
frequency fluctuations (LFFs) in registered optical
signals on the final output in LDF. LFFs form the
low-frequency spectra of all processed signals, and
can be used to calculate BF similar to LDF technique,
but using the waveband below 30 Hz. Moreover, we
assumed that the coherent illumination and lasers to
evaluate BF is not mandatory in this case. This
technique we named as IOFF - Incoherent Optical
Fluctuation Flowmetry. We developed a LED-based
prototype that performs IOFF, and carried out a
number of experiments to confirm our assumptions.
Optical Non-invasive Flowmetry without Lasers and Coherent Light
219

Most of our experiments confirmed assumptions
we made well. LFFs were registered with incoherent
illumination in skin. The main spectral range of LFFs
was determined between 0 and 12 Hz. It allowed us
to calculate BF similar to the LDF algorithm, but
inside the waveband below 30 Hz. Comparative
measurements of BF using our novel method and a
standard LDF technique showed a good similarity of
the results. Measured BFs were equal even in details
at arterial occlusions, while at heating tests IOFF
technique showed the enhanced sensitivity. These
positive results open a way for building novel and less
sophisticated than LDF optical diagnostic tools for
assessment of BF in tissues. Of course, the proposed
IOFF technique needs further detailed investigations,
especially in clinics to prove its clinical significance.
However, as one can see, our approach already has a
number of additional advantages. One important
advantage is the cost of the equipment. A commercial
LDF-meter such as the Moor VMS-LDF costs more
than 10,000 USD. The cost of our self-designed
portable prototype is less than 100 USD (including all
components except a computer). The second one is
not sophisticated and clear metrology. The metrology
in LDF is sophisticated due to a complexity with the
design of tissue-like phantoms imitating the motion
of RBCs in a microvasculature bed. In our case, an
imitation of the amplitude modulation of the probing
radiation with different modulation depths on the
background of different levels of the dc component of
the backscattered radiation is sufficient.
REFERENCES
Bi, R., Dong, J., Poh, C.L., and Lee, K., 2015. Optical
methods for blood perfusion measurement – theoretical
comparison among four different modalities. J. Opt.
Soc. Am. A., 32(5), 860- 866.
Binzoni, T., and Martelli, F., 2017. Study on the
mathematical relationship existing between single-
photon laser-Doppler flowmetry and diffuse correlation
spectroscopy with static background. J. Opt. Soc. Am.
A., 34(12), 2096-2101.
Bonner, R. and Nossal, R., 1981. Model for laser Doppler
measurement of blood flow in tissue. Applied Optics,
20(12), 2097-2107.
Briers, J.D., 2001. Laser Doppler, speckle and related
techniques for blood perfusion mapping and imaging.
Physiological measurement, 22(4), R35-R66.
Cummins, H.Z. and Swinney, H.L., 1970. Light Beating
Spectroscopy. Progress in Optics, 8, 133-200.
Fredriksson, I., Fors, C., and Johansson, J., 2007. Laser
Doppler Flowmetry – a Theoretical Framework.
Department of Biomed. Engineering, Linköping Univ.
Fredriksson, I., Larsson M., 2016. On the equivalence and
differences between laser Doppler flowmetry and laser
speckle contrast analysis. J. of Biomed. Optics, 21(12),
126018.
Hu, C.L., Lin, Z.S., Chen, Y.Y., Lin, Y.H., Li, M.L., 2013.
Portable laser Doppler flowmeter for microcirculation
detection. Biomed. Engineering Letters, 3(2), 109-114.
Koelink, M.H., De Mul, F.F.M., Leerkotte, B., et al., 1994.
Signal processing for a laser-Doppler blood perfusion
meter. Signal processing, 38(2), 239-252.
Lapitan, D.G., Rogatkin, D.A., 2016. Variable hyperemia
of biological tissue as a noise source in the input optical
signal of a medical laser Doppler flowmeter. J. Opt.
Techn., 83(1), 36-42.
Lapitan, D., Rogatkin, D., Persheyev, S. and Kotliar, K.,
2018. False spectra formation in the differential two-
channel scheme of the laser Doppler flowmeter.
Biomed. Eng.-Biomed. Tech., 63(4), 439-444.
Lapitan, D., Rogatkin, D., Persheyev, S. and Rogatkin, A.,
2017. New simple phenomenological model for laser
Doppler measurements of blood flow in tissue. Proc. of
the 10th Int. Joint Conference on Biomedical
Engineering Systems and Technologies (BIOSTEC
2017), vol.1: BIODEVICES, 98-103.
Mizeva, I., Maria, C., Frick, P., Podtaev, S., Allen, J., 2015.
Quantifying the correlation between
photoplethysmography and laser Doppler flowmetry
microvascular low-frequency oscillations. J. of Biomed.
Optics, 20(3), 037007.
Mizeva, I., Frick, P., Podtaev, S., 2016. Relationship of
oscillating and average components of laser Doppler
flowmetry signal. J. of Biomed. Optics, 21(8), 085002.
Nilsson, G.E., Tenland, T., Oberg, P.A., 1980. A new
instrument for continuous measurement of tissue blood
flow by light beating spectroscopy. IEEE Transactions
on Biomed. Engineering, 27(1), 12-19.
Nippolainen, E., Podolian, N.P., Romashko, R.V., Kulchin
Y.N., Kamshilin A.A., 2015. Photoplethysmographic
wavwform as a function of subject’s age. Physics
Procedia, 73, 241-245.
Obeid, A.N., Boggett, D.M., Barnett, N.J., Dougherty, G.,
and Rolfe, P., 1988. Depth discrimination in laser
Doppler skin blood flow measurement using different
lasers, Med. & Biol. Engin. & Comput., 26, 415-419.
Rajan, V., Varghese, B., Leeuwen, T., 2009. Review of
methodological developments in laser Doppler
flowmetry. Lasers Med Sci, 24, 269–283.
Roustit, M., Cracowski, J., 2012. Non-invasive assessment
of skin microvascular function in humans: an insight
into methods. Microcirculation, 19(1), 47-64.
BIODEVICES 2020 - 13th International Conference on Biomedical Electronics and Devices
220
