
Comparative Machine Learning Approach in Dementia Patient
Classification using Principal Component Analysis
Gopi Battineni
a
, Nalini Chintalapudi and Francesco Amenta
e-Health and Telemedicine Centre, School of Pharmaceutical Sciences and Health Products,
University of Camerino, Camerino, 62032, Italy
Keywords: Dementia, Machine Learning, PCA, Model Prediction, Classifiers, AUC.
Abstract: Dementia is one of the brain diseases that were significantly affecting the global population. Mainly it is
exposed to older people with an association of memory loss and thinking ability. Unfortunately, there are no
proper medications for dementia prevention. Doctors are suggesting that early prediction of this disease can
somehow help the patient by slowdown the dementia progress. Nowadays, many computer scientists were
using machine learning (ML) algorithms and data-mining operations in the healthcare environment for
predicting and diagnosing diseases. The current study designed to develop an ML model for better
classification of patients associated with dementia. For that, we developed a feature extraction method with
the involvement of three supervised ML techniques such as support vector machines (SVM), K-nearest
neighbor (KNN), and logistic regression (LR). Principal component analysis (PCA) was selected to extract
relevant features related to the targeted outcome. Performance measures were assessed with accuracy,
precision, recall, and AUC values. The accuracy of SVM, LR, and KNN was found as 0.967, 0.983, and 0.976,
respectively. The AUC of LR (0.997) and KNN (0.966) were recorded the highest values. With the highest
AUC values, KNN and LR were considered optimal classifiers in dementia prediction.
1 INTRODUCTION
Dementia is a broad category of brain diseases, and
this can be happening very often in older adults.
Neurodegenerative disorders are one of the leading
causes of the development of this disease (Barragán
Martínez et al. 2019). There are different types of
dementia, like Alzheimer’s disease (AD), Lewy body
dementia, and front temporal disorders. More than
50-60% of dementia was associated with AD type
(McKhann et al. 2011). Sometimes AD can generate
the loss of mental ability, individual thinking,
memory loss, and visual perception (Barragán
Martínez et al. 2019; Mahalingam and Chen 2019).
At present, there are is no proper prevention
methods for dementia. Early prediction of dementia
could enhance patient life expectancy and slow down
the progress of this disease. Despite, machine
learning (ML) is emerged as a branch of artificial
intelligence (AI) and associated with techniques that
allow computers to autonomous learning with
nominal human involvement (Baştanlar and Özuysal
a
https://orcid.org/0000-0003-0603-2356
2014). Machine self-learning means that machines
can be able to understand and identify input data.
Ultimately, it can develop relations and predictions
based on data feeding (Domingos 2012). Nowadays,
these techniques are globally evolving health care
from diagnosis to drug discovery.
Many studies were associated with the integration
of ML approaches in automatic analysis of
biomedical data. Glomerular diseases (Liu et al.
2017), detection of liver pathologies (Li, Jia, and Hu
2015), cancer predictions (Guyon et al. 2002; Kourou
et al. 2015), Type 2 diabetes classifications (Luo
2016), dementia prediction (Battineni, Chintalapudi,
and Amenta 2019), and cardiovascular disease (CVD)
risk assessments (Kakadiaris et al. 2018) were the
some of the applications in machine learning. Despite
that, many researchers were attempted to find out the
best ML algorithm in dementia predictions. For
example, a study on the identification of developing
dementia patients through ML obtained 84%
accuracy (Mathotaarachchi et al. 2017). The risk
factors associated with dementia were well-validated
780
Battineni, G., Chintalapudi, N. and Amenta, F.
Comparative Machine Learning Approach in Dementia Patient Classification using Principal Component Analysis.
DOI: 10.5220/0009096907800784
In Proceedings of the 12th International Conference on Agents and Artificial Intelligence (ICAART 2020) - Volume 2, pages 780-784
ISBN: 978-989-758-395-7; ISSN: 2184-433X
Copyright
c
2022 by SCITEPRESS – Science and Technology Publications, Lda. All rights reserved
in (Aditya and Pande 2017; Pekkala et al. 2017), with
the usage of supervised machine learning approaches.
However, there has been little discussion on the
involvement of feature extraction methods in
dementia forecasting. As of this, the present study
aimed to propose supervised machine learning
algorithms for AD patients to understand the patterns
associated with knowledge discovery in AD. We
adopt longitudinal MRI data in demented and non-
demented patients whose ages from 60 to 98. In this,
we have studied the performance of three different
models: SVM, Linear regression (LR), and K-nearest
neighbor (KNN) algorithms to forecast dementia in
older adults.
Table 1: Statistical report of OASIS longitudinal studies
(where EDUC: education; SES: social-economic status;
MMSE: mini-mental state examination; CDR: clinical
dementia rating; e-TIV: estimated total intracranial volume;
n-WBV: normalized whole brain volume; ASF: atlas
scaling factor; D: demented; ND: Non-demented; Con:
Converted.
N Variable Min-Max Range (N) Percentage
1 Subject ID - 150 100
2 MRI ID - 373 100
3 Group -
D (146)
ND (190)
Con (37)
39.14
50.93
9.91
4 Visit 1-5
1-1.4 (150)
1.8-2.2(144)
3.0-3.4 (58)
3.8-5.0 (21)
40.21
38.60
15.54
5.62
5 MR delay 0-2639
0-880 (280)
881-1759 (71)
1760-2639 (22)
75.06
19.03
5.89
6 Sex -
Male (160)
Female (213)
42.89
57.10
7 Hand (R) - 373 100
8 Age 60-98
60-73 (106)
74-85 (213)
86-98 (54)
28.41
57.10
14.47
9 EDUC 6-23
6-11 (23)
12-17 (270)
18-23 (80)
6.16
72.38
21.44
10 SES 1-5
1-3 (191)
4-5 (163)
51.20
43.69
11 MMSE 4-30
4-12.5 (2)
12.6-21.3 (33)
21.4-30 (336)
0.05
8.84
90.08
12 CDR 0-2
0-1(329)
1-2 (44)
88.19
11.81
13 e-TIV 1106-2004
1106-1555(263)
1556-2004(110)
70.51
29.49
14 n-WBV
0.644-
0.837
373 100
15 ASF
0.876-
1.587
0.87-1.23 (229)
1.23-1.58 (144)
61.39
38.61
2 MATERIALS AND METHODS
2.1 Data Selection
An open-access series of imaging studies (OASIS)
dataset with 150 patients with at least 60years of age
was considered (Smith 2009). Each patient exposed
to at least two MRI sessions, and a total of 373 MRI
sessions were analyzed. Current AD status (i.e., along
with 15 independent variables) classified into three
groups: Demented, Non-demented, and Converted,
had mentioned in Table 1.
2.2 Feature Extraction
Feature extraction is a method that can be used to
remove irrelevant (redundant) features from the
actual dataset (Guyon and Elisseeff 2006). In model
design, feature extraction is an essential step because
the reduction of irrelevant or partially relevant
features can tend to have a high-performance model.
In this study, the selection of high correlated
attributes was measured to conduct the feature
extraction technique. The principal component
analysis (PCA) method was adopted to reduce the
actual dataset features (Ruby-Figueroa 2015).
We considered OASIS longitudinal dataset to find
a combination of input attribute that matches actual
data distribution. Feature extraction experiment was
performed with the help of auto package PCA
(auto.pca) in the ‘R’ platform (https://cran.r-
project.org/web/packages/auto.pca/index.html).
2.3 Classifiers
2.3.1 Support Vector Machines (SVM)
SVM is a supervised machine learning (SML)
approach; it is one of the highly used classification
algorithms in machine learning (Wang and Lin 2014).
In SVM, each data segment was represented as a
single point in N-dimensional (where N is the total
number of features in the actual dataset) space, with
the forecasting of each element is being the
estimation of specific coordinates. At that point, we
perform classification action by finding the
hyperplane (i.e., decision boundaries to classify data
points) that correctly separates the output classes. The
best hyper-plane can be chosen among the number of
hyper-planes on the premise of the separation
between the two categories that isolates. The plane,
which has the highest margin between the two
classes, is called the high margin hyper-plane.
Comparative Machine Learning Approach in Dementia Patient Classification using Principal Component Analysis
781
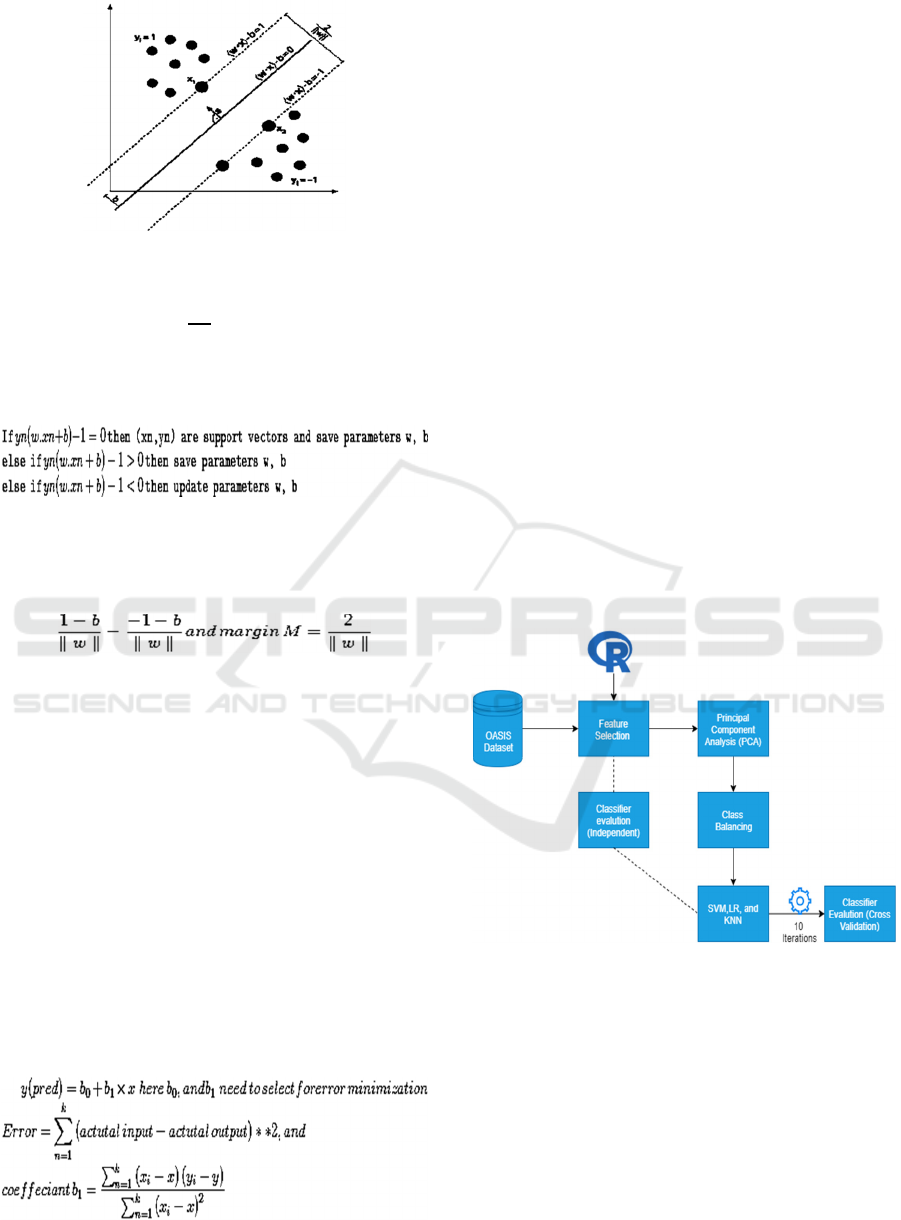
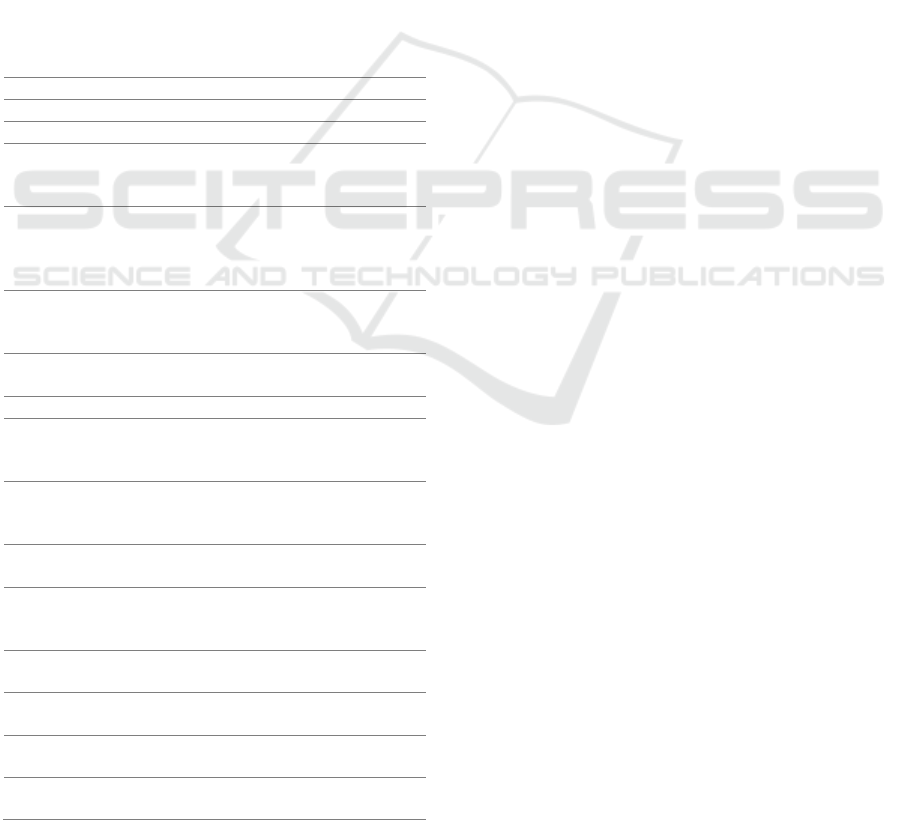
Figure 1: SVM representation example.
The hyperplane can be described by w. x + b = 0, where
w is a normal vector and
∥∥
is the hyperplane offset along
w vector.
For n data points, SVM defined as(x1, y1)... (xn, yn),
and optimization can be written as
In the example (Figure 1), two hyperplanes are
passing through support vectors (y=±1): (w. x) − b =
−1 and (w. x) − b = 1. The distance between the two
hyperplanes and origin is
2.3.2 Linear Regression (LR)
LR is utilized to finding the linear relation between
the target variable and the predictor variable. It
explores the relationship between two variables by
the linear equation to the test data. One variable is
viewed as a logical type, and the other variable is
considered to be a dependent type (Kumar 2006).
In the present study, a dataset of 150 patients’
information (trained data) about the relationship
between “14 different features” and “group attribute.”
We aimed to design a model that can predict a patient
group based on other features. A regression line was
obtained (with minimum error) by using trained data.
Thus, if trained data exposed to the feature extraction
technique, the model should predict the patient group
with less or no error.
2.3.3 K-nearest Neighbor (KNN)
KNN is easy to understand and address the issues of
classification and regression. It uses similar features
to predict the estimations of new data points.
Therefore, the new data point will be allotted a value
based on how closely it coordinates the points in the
trained dataset (Chen, Li, and Tang 2013).
3 RESULTS AND DISCUSSION
3.1 Model Outcome
A comparison of the three machine-learning
classifiers' performance was done. Initially, OASIS
longitudinal dataset exposed to the R platform (Figure
2) and model testing conducted with two datasets: an
actual data set and dataset after PCA. Preprocessing
involved with the prediction of missing values by the
imputation of K-NN. Feature extraction was
performed with the help of the PCA technique.
Highly correlated features were selected for better
outcomes. Each ML classifier was evaluated
independently by cross-validation techniques (with
k=10).
Figure 2: Experimental workflow and design.
3.2 Performance Parameters
To predict specific patient associated with AD or not,
a predictive model should be correctly classified the
instances. Accuracy (A) is a ratio of correctly
predicted outcomes to a total number of input samples
(Powers 2011). Three supervised ML techniques
(SVM, LR, and KNN) were used to develop
predictive models (Table 2). The performance of
three predictive models was analyzed using
parameters such as precision (Davis and Goadrich
ICAART 2020 - 12th International Conference on Agents and Artificial Intelligence
782
2006), recall, and area under the curve (AUC) (Davis
and Goadrich 2006; Powers 2011). LR produced the
highest accuracy of about 98.3%. Followed to LR,
KNN and SVM produced accuracy about 97.6%, and
96.7%, respectively. Three models were generating
similar accuracy rates. Sometimes, accuracy is not
only enough to judge the model performance.
Therefore, analysis of other parameters such as
precision, recall, and AUC is mandatory to define
model validation.
Precision can define positive outcomes from total
predicted positive instances. In this study, we found
similar accuracy for two models (LR and KNN) about
98± 0.04%. When compared with the other two
models, SVM was producing a low positive
prediction rate of 97.1%. On the other hand, recall
(sensitivity) can define true positives from total actual
positives. Both precision and recall are based on the
understanding of the relevance of positive outcomes.
From Table2, the sensitivity for LR predictive model
found at about 97.4%. Alternatively, KNN was with
the highest sensitivity rate of 98.3%, and SVM with
the lowest sensitivity rate of 96.6% can found.
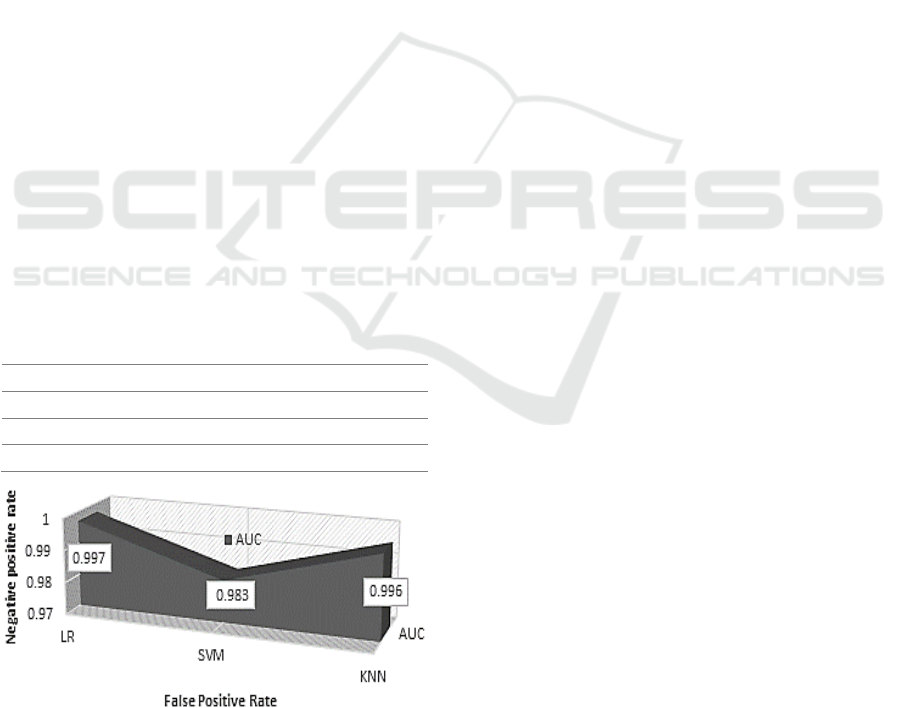
Despite this, in machine learning, AUC can help to
overcome classification problems. It is one of the key
performance tools for model performance checks.
Generally, the AUC was ranging in between [0, 1].
By definition, if AUC ≈ 1, then the model was
correctly distinguishing the target class. The AUC
values of LR, KNN, and SVM were 99.7%, 99.6%,
and 98.3%, respectively.
Table 2: Performance metrics of different predictive
models.
Model Accuracy Precision Recall AUC
SVM 0.967 0.971 0.966 0.983
LR 0.983 0.986 0.974 0.997
KNN 0.976 0.982 0.983 0.996
Figure 3: Graphical representation of AUC values.
4 CONCLUSIONS
In this study, three supervised ML algorithms (SVM,
LR, and KNN) were defined to classify dementia
patients. Feature extraction performed using the
principal component analysis method using the R
platform. Different performance parameters set was
defined the model validation. Results validated that
the three models are accurately classifying dementia
patients with better rates from 96.7-98.3%. In
unbalanced datasets, accuracy is not only the
parameter to validate the model. Therefore, other
metrics, such as precision, recall, and AUC, were also
considered. The AUC of LR and KNN reached the
highest value of one, such that these two predictive
models were well classified the dementia patients.
This work is concluding that employment PCA
techniques were much better than the manual
selection of attributes with minimum medical
knowledge. Therefore, with limited features and
integration of the PCA method, we were achieved
better accuracy rates when compared with previous
studies in dementia classifications.
CONFLICTS OF INTEREST
The authors do not possess any conflicts during the
publication.
ACKNOWLEDGMENTS
We are thankful to the Principal Investigators: D.
Marcus, R, Buckner, J. Csernansky, and J. Morris, to
provide access to OASIS longitudinal studies.
REFERENCES
Aditya, C. R., and M. B.Sanjay Pande. 2017. “Devising an
Interpretable Calibrated Scale to Quantitatively Assess
the Dementia Stage of Subjects with Alzheimer’s
Disease: A Machine Learning Approach.” Informatics
in Medicine Unlocked.
Barragán Martínez, D., M. A. García Soldevilla, A. Parra
Santiago, and J. Tejeiro Martínez. 2019. “Alzheimer’s
Disease.” Medicine (Spain).
Baştanlar, Yalin, and Mustafa Özuysal. 2014. “Introduction
to Machine Learning.” Methods in Molecular Biology.
Battineni, Gopi, Nalini Chintalapudi, and Francesco
Amenta. 2019. “Machine Learning in Medicine:
Performance Calculation of Dementia Prediction by
Comparative Machine Learning Approach in Dementia Patient Classification using Principal Component Analysis
783

Support Vector Machines (SVM).” Informatics in
Medicine Unlocked.
Chen, Qifeng, Dingzeyu Li, and Chi Keung Tang. 2013.
“KNN Matting.” IEEE Transactions on Pattern
Analysis and Machine Intelligence.
Davis, Jesse, and Mark Goadrich. 2006. “The Relationship
between Precision-Recall and ROC Curves.” In
Proceedings of the 23rd International Conference on
Machine Learning - ICML ’06,.
Domingos, Pedro. 2012. “A Few Useful Things to Know
about Machine Learning.” Communications of the ACM.
Guyon, Isabelle, and Andre Elisseeff. 2006. “Feature
Extraction, Foundations and Applications: An
Introduction to Feature Extraction.” Studies in
Fuzziness and Soft Computing.
Guyon, Isabelle, Jason Weston, Stephen Barnhill, and
Vladimir Vapnik. 2002. “Gene Selection for Cancer
Classification Using Support Vector Machines.”
Machine Learning.
Kakadiaris, Ioannis A. et al. 2018. “Machine Learning
Outperforms ACC/AHA CVD Risk Calculator in
MESA.” Journal of the American Heart Association.
Kourou, Konstantina et al. 2015. “Machine Learning
Applications in Cancer Prognosis and Prediction.”
Computational and Structural Biotechnology Journal.
Kumar, K. Vasanth. 2006. “Linear and Non-Linear
Regression Analysis for the Sorption Kinetics of
Methylene Blue onto Activated Carbon.” Journal of
Hazardous Materials.
Li, Wen, Fucang Jia, and Qingmao Hu. 2015. “Automatic
Segmentation of Liver Tumor in CT Images with Deep
Convolutional Neural Networks.” Journal of Computer
and Communications.
Liu, Xun et al. 2017. “Improving Precision of Glomerular
Filtration Rate Estimating Model by Ensemble
Learning.” Journal of Translational Medicine 15(1): 1–5.
Luo, Gang. 2016. “Automatically Explaining Machine
Learning Prediction Results: A Demonstration on Type
2 Diabetes Risk Prediction.” Health Information
Science and Systems.
Mahalingam, Sowmya, and Ming Kai Chen. 2019.
“Neuroimaging in Dementias.” Seminars in Neurology.
Mathotaarachchi, Sulantha et al. 2017. “Identifying
Incipient Dementia Individuals Using Machine
Learning and Amyloid Imaging.” Neurobiology of
Aging.
McKhann, Guy M. et al. 2011. “The Diagnosis of Dementia
Due to Alzheimer’s Disease: Recommendations from
the National Institute on Aging-Alzheimer’s
Association Workgroups on Diagnostic Guidelines for
Alzheimer’s Disease.” Alzheimer’s and Dementia.
Pekkala, Timo et al. 2017. “Development of a Late-Life
Dementia Prediction Index with Supervised Machine
Learning in the Population-Based CAIDE Study.”
Journal of Alzheimer’s Disease 55(3): 1055–67.
Powers, David M. W. 2011. “Evaluation: From Precision,
Recall And F-Measure To Roc, Informedness,
Markedness & Correlation.” Journal of Machine
Learning Technology.
Ruby-Figueroa, René. 2015. “Principal Component
Analysis (PCA).” In Encyclopedia of Membranes,.
Smith, Susan Spivock. 2009. Predicting Alzheimer’s
Dementia Mortality Using Medicare Outcome
Assessment & Information Set (oasis) “Predicting
Alzheimer’s Dementia Mortality Using Medicare
Outcome Assessment and Information Set (OASIS).”
Wang, Po Wei, and Chih Jen Lin. 2014. “Support Vector
Machines.” In Data Classification: Algorithms and
Applications,.
ICAART 2020 - 12th International Conference on Agents and Artificial Intelligence
784
