
A Simulation Study on the Effect of Reconfiguration Strategy in an
Automotive Body Shop Considering the Change of Product-mix
Dug Hee Moon
1a
, Dong Ok Kim
2b
, Young Hoon Lee
2c
and Yang Woo Shin
3d
1
School of Industrial Engineering and Naval Architecture, Changwon National University,
20 Changwondaehak-ro, Changwon, South Korea
2
Department of Eco-friendly Marine Plant FEED Engineering, Changwon National University,
20 Changwondaehak-ro, Changwon, South Korea
3
Department of Statistics, Changwon National University, 20 Changwondaehak-ro, Changwon, South Korea
Keywords: Automotive Body Shop, Manufacturing System, Mixed-model, Product-mix, Reconfiguration, Production
Rate, Simulation.
Abstract: In this paper, we consider the manufacturing system of an automotive body shop in which two types of car
are produced and one car is substituted by the other car gradually. There are two different underbody lines
because the underbody structures of the two types of car are absolutely different. We also consider the
reconfiguration strategies for changing the layouts as the changes of the product-mix. The effects of
reconfiguration strategies and buffer allocations are investigated by simulation experiments.
1 INTRODUCTION
The body shop of an automotive factory is the typical
manufacturing system which consists of 15~20 sub-
lines and many assembly operations (Moon et al.,
2006). Sub-lines in an automotive body shop are
divided into some groups, such as under body lines,
side body lines, main body lines, opening parts lines
and body in white lines.
There have been only a few papers dealing the
manufacturing systems of automotive body shops.
Muhl et al. (2003) explained the overall processes of
automotive factory and introduced some issues.
Spieckermann et al. (2000), Kahan et al. (2009) and
Tahar and Adham (2010) presented papers related to
the body shop design using simulation. Gupta et al.
(2012) discussed a methodology for automating the
welding gun selection processes and optimized to
reduce gun variants in an automotive body shop.
Moon et al. (2006) presented a paper which
considered the case study of a design procedures
using 3D simulation for an automotive body shop.
Feno et al. (2014) proposed a concept design
a
https://orcid.org/0000-0001-7660-4976
b
https://orcid.org/0000-0002-7239-2002
c
https://orcid.org/0000-0001-9274-3239
d
https://orcid.org/0000-0002-3107-4569
processes in the early phase of automotive body shop
design, and explained the integration of digital
manufacturing technologies and simulations.
Kim et al. (2015) compared two different layout,
‘layered build method’ and ‘modular build method’
with respect to the welding methods in the side body
sub-lines. Moon et al. (2017) also compared two
types of part transfer policies which can be applied to
the sub-lines in which no buffers are allowed. The
first policy is the ‘synchronous transfer’ and the
second policy is the ‘asynchronous transfer’. Moon et
al. (2016) suggested that the gap of throughput
between the two layout structures could be reduced
by decoupling a main body subline and by optimizing
buffer allocations. However, these papers assumed
that there is only on type of car, and did not consider
the under body sub-lines.
The mixed-models production, which means that
two or more types of cars are produced in the same
line (or shop), is popular in automotive industries. In
general, all the cars of mixed-models have similar
body structures and similar welding operations.
Unfortunately, it is very difficult to develop
350
Moon, D., Kim, D., Lee, Y. and Shin, Y.
A Simulation Study on the Effect of Reconfiguration Strategy in an Automotive Body Shop Considering the Change of Product-mix.
DOI: 10.5220/0009096303500355
In Proceedings of the 9th International Conference on Operations Research and Enterprise Systems (ICORES 2020), pages 350-355
ISBN: 978-989-758-396-4; ISSN: 2184-4372
Copyright
c
2022 by SCITEPRESS – Science and Technology Publications, Lda. All rights reserved

mathematical models considering mixed-models
production. Moon et al. (2018) investigated the effect
of mixed-model production in a body shop using
simulation, but they did not consider under body lines.
As the increasing demands of eco-friendly car
such as hybrid cars or electric cars, most of
automotive companies are confronted to change the
layout concept of body shop. In general, they produce
both hybrid car and internal combustion engine type
car (we call it as the engine car) for the same car
model in the same line, because both of cars can share
same body structures. In the case of hybrid car with
front-wheel drive, engine, motor and transmission are
installed in the front of car body, and battery pack and
fuel tank are usually installed in the rear area of car
body.
However, in an electric car, a flat battery pack is
installed on whole underbody because of weight
balance. Thus, the under body structure of electric car
is distinguished from that of engine car by its fully
enclosed, smooth underbody. Furthermore, the
material of the underbody of electric car can be
different from that of engine car, and it results in
different adhesive operations. It is the reason that
automotive companies tend to separate under body
line as the two, one for engine car (or hybrid car) and
the other for electric car. This is one of the motives of
our study.
Another situation considered in this paper is
reconfiguration. At the beginning, the production
quantity of electric car is small, but the demand of
electric car increases and it will substitute the engine
car gradually. Thus, the capacity of the under body
line of electric car should be expanded, and that of
engine car should be downsized. It means that the
layouts of the two types of cars should be changed,
and the reconfiguration strategies are required.
In this paper, we will briefly investigate the effect
of reconfiguration strategies by simulation study,
when the product-mix is changed in an automotive
body shop. This paper is organized as follow. In
section 2, the system configuration is described, and
the simulation results are explained in section 3.
Finally conclusion and discussions are addressed in
section 4.
2 SYSYEM CONFIGURATIONS
2.1 Basic Configurations
To evaluate the reconfiguration strategies for under
body lines in automotive body shop, we define the
abstract model of automotive body shop as shown in
Figure 1, and the following assumptions are applied
to the system.
Both engine car and electric car are produced for
the same car model. The total target production
volume is fixed, but individual production volume
is changed following to the product-mix.
All sub-lines except for underbody lines can be
shared. However, there are two types of under
body lines, one for engine car and the other for
electric car. The layout of underbody lines for
engine car is similar with the traditional layout.
However, the structure of underbody lines for
electric car is designed with the concept of cell
system because the production volume is not high.
When the production volume of electric car
increases we can install additional cell lines in
parallel.
The welding method of side body is the modular
build method.
The transfer policies in all sub-lines are
asynchronous transfer.
There are buffers between two successive sub-
lines (total number of buffer location is 14), but
no buffers are allowed in a sub-line.
The process times (PT) of all stations in upper
body (side body and main body) sub-lines and
opening parts sub-lines are known and constant as
one time unit (minute) because a body shop is a
highly automated manufacturing system.
The process times of underbody lines(or cells) can
be varied by the change of the product-mix of two
types of cars. The total workload is fixed, and thus
process time of a workstation is determined by the
number of work stations. We assume that perfect
line balancing is possible.
There is only one mode of time-dependent failure
for all workstations, and the distributions of time
to failure (uptime) and repair time (downtime) are
known and same. Exponential distributions are
assumed, and MTTF and MTTR are set to 240 and
10 time units, respectively. Thus, the isolated
efficiency of a workstation is 0.96.
There is no starvation in the first stations and there
is no blocking in the final station. The first stations
mean the stations which do not have predecessors,
and the final station is the station that does not
have successors.
Table 1 shows the basic layout data of the two
underbody lines. The total workload of the underbody
line of engine car (TW
1
) is 24 and that of electric car
(TW
2
) is 21. This assumption is reasonable because
the underbody structure of electric car is simpler than
that of engine car. The total number of stations of
engine car (NS
1
) is 24 and that of electric car (NS
2
) is
A Simulation Study on the Effect of Reconfiguration Strategy in an Automotive Body Shop Considering the Change of Product-mix
351
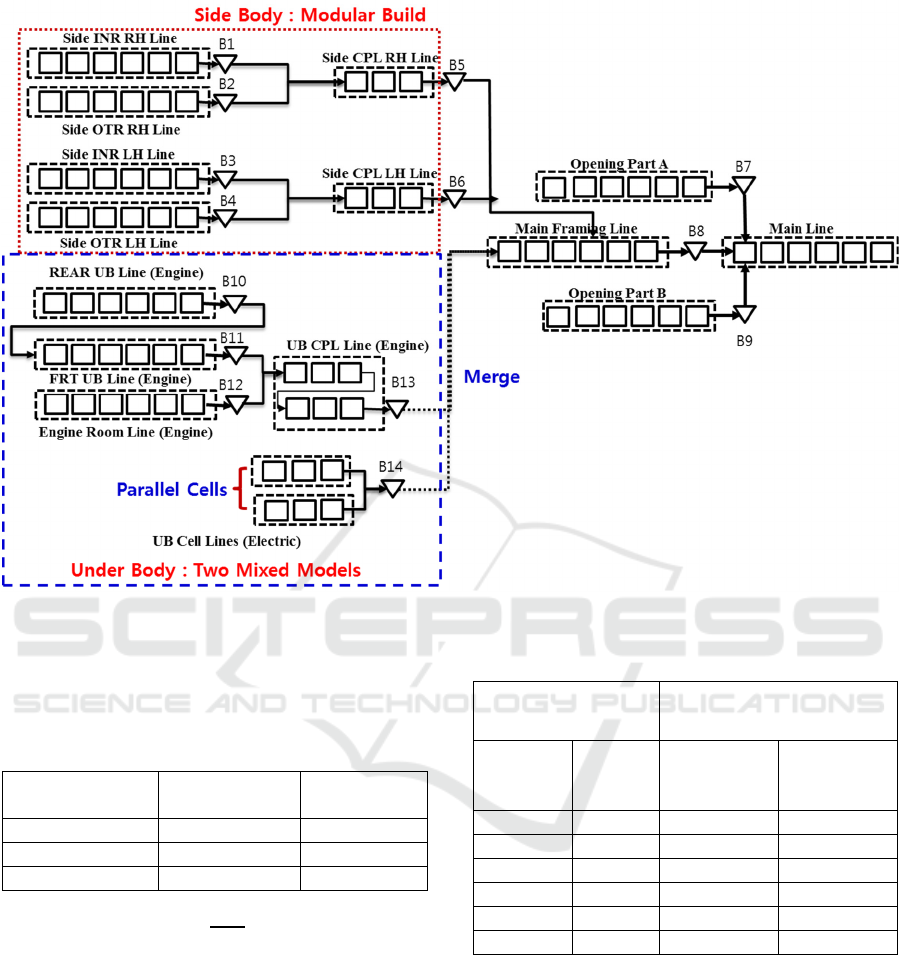
Figure 1: Abstract model of automotive body shop.
three. Thus the process times of a station (PT
1
and PT
2
)
are calculated by the equation (1), and the values are
one and seven, respectively.
Table 1: Basic data of two underbody lines.
Engine car
(Type 1)
Electric car
(Type 2)
TW
i
24 21
NS
i
24 3
PT
i
1 7
(1)
2.2 Reconfiguration Strategies
The following three reconfiguration strategies are
considered.
Strategy 1
Although the production volume of engine car
decreases as the increase of product-mix (add new
cell lines for electric car), we did not change NS
1
and
PT
1
as shown in Table 2.
Table 2: Data for strategy 1.
Electric car
(Type 2)
Engine car
(Type 1)
Product-
mix
Number
of Cell
Lines
NS
i
PT
i
0% 0 24 1.0
10% 1 24 1.0
20% 2 24 1.0
30% 3 24 1.0
40% 4 24 1.0
50% 5 24 1.0
Strategy 2
If the production volume of electric car increases, we
delete some stations in the under body lines of engine
car following to the Table 3. In this case, the positions
of stations to be deleted should be determined by the
scenario in Figure 2. When product-mix becomes
10%, we can deleted two workstations marked with
① in Figure 2. Then, the process time PT
1
is re-
calculated by the relationship in equation (1). In
strategy 2, we can reduce the additional spaces
required for adding new cell lines for electric car.
ICORES 2020 - 9th International Conference on Operations Research and Enterprise Systems
352
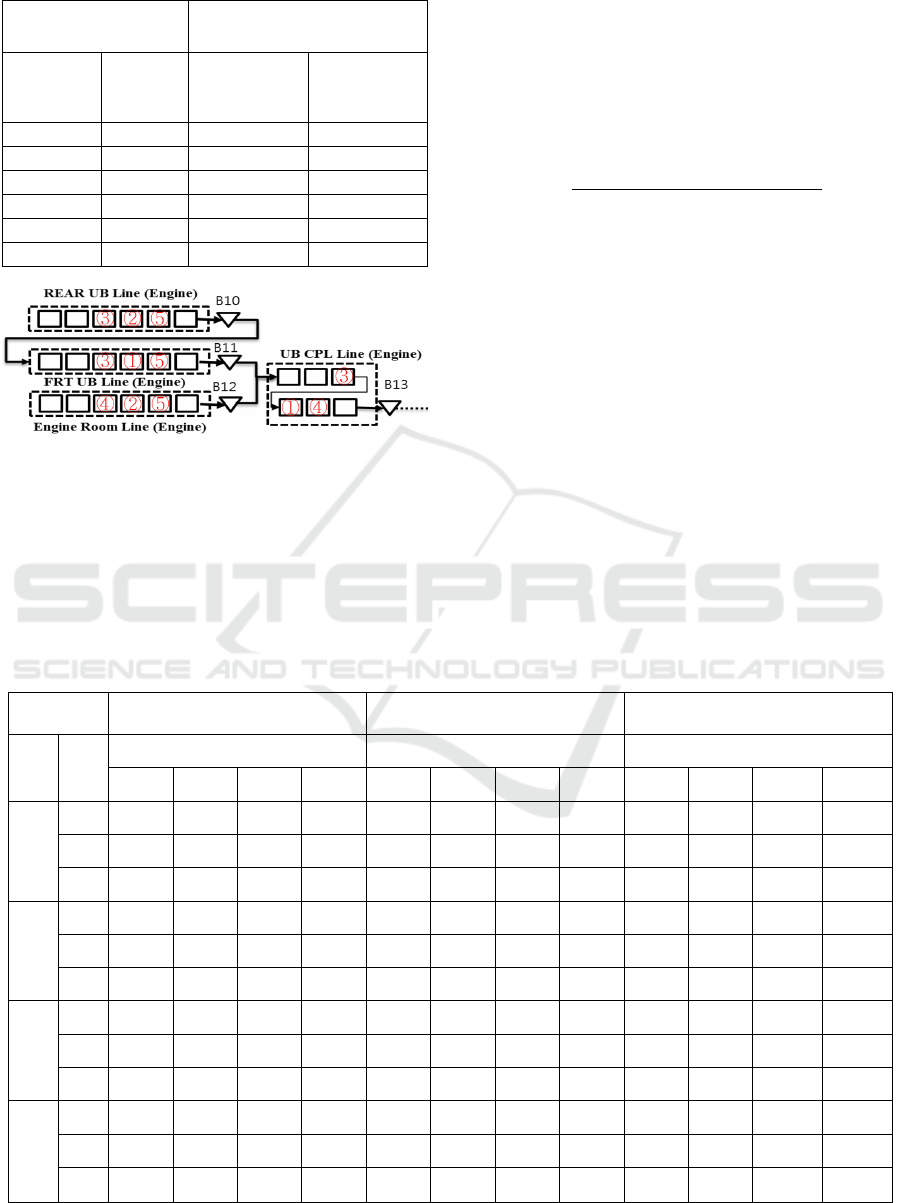
Table 3: Data for strategy 2 and 3.
Electric car
(Type 2)
Engine car
(Type 1)
Product-
mix
Number
of Cell
Lines
NS
i
PT
i
0% 0 24 1.0000
10% 1 22 1.0909
20% 2 20 1.2000
30% 3 17 1.4118
40% 4 15 1.6000
50% 5 12 2.0000
Figure 2: Positions of workstations to be deleted.
Strategy 3
In strategy 3, the stations to be deleted are substituted
to buffers. Thus, the data and buffer positions for
strategy 3 are the same as in Table 3 and Figure 2,
respectively. In strategies 1 and 3, we need additional
spaces for electric car.
3 SIMULATION RESULTS
The simulation models are developed with ARENA
®
(see
Rossetti, 2016). Simulation run length is set to
330,000 including 30,000 of warmup time, and the
number of replication is ten. The main performance
measure is production rate, and it is calculated by the
equation (2).
300,000
(2)
For the experiments the buffer capacities of
B
1
~B
13
are assumed as same, and they are set to 1, 3,
5, 7 and 11. On the other hand, the buffer capacity of
B
14
is set to 1, 3 and 5, respectively. The product-mix
has been changed from 10% to 50%. Some of the
simulation results are summarized in Table 4. The
ranges of 95% confidence intervals are 0.001~
0.002.
The simulation results indicate that the production
rate increases as the increase of the product-mix of
electric car. It means that the layout structure of
parallel cell lines gives positive effects on the
production rate.
The second observation is that the strategy 3 is
always better than those of the other strategies,
consistently. It is due to the effect of new allocation
of buffer in some underbody sub-lines of engine car.
Table 4: Simulation Results.
Buffer
Capacity
Strategy 1 Strategy 2 Strategy 3
B1
~
B13
B14
Product-mix Product-mix Product-mix
10% 20% 30% 50% 10% 20% 30% 50% 10% 20% 30% 50%
1
1 0.2457 0.2523 0.2583 0.2669 0.2446 0.2505 0.2539 0.2619 0.2493 0.2555 0.2615 0.2718
3 0.2462 0.2520 0.2586 0.2678 0.2456 0.2510 0.2544 0.2622 0.2510 0.2563 0.2625 0.2700
5 0.2475 0.2529 0.2586 0.2669 0.2461 0.2516 0.2542 0.2632 0.2516 0.2558 0.2630 0.2703
3
1 0.3129 0.3217 0.3283 0.3393 0.3110 0.3209 0.3268 0.3369 0.3172 0.3254 0.3341 0.3430
3 0.3160 0.3228 0.3289 0.3406 0.3143 0.3214 0.3278 0.3387 0.3204 0.3260 0.3337 0.3438
5 0.3145 0.3229 0.3290 0.3388 0.3137 0.3219 0.3274 0.3378 0.3196 0.3250 0.3338 0.3443
5
1 0.3665 0.3769 0.3845 0.3953 0.3671 0.3758 0.3832 0.3934 0.3702 0.3809 0.3888 0.3991
3 0.3699 0.3779 0.3873 0.3966 0.3708 0.3777 0.3847 0.3966 0.3739 0.3812 0.3906 0.3982
5 0.3710 0.3801 0.3872 0.3958 0.3714 0.3776 0.3839 0.3964 0.3735 0.3829 0.3902 0.3987
7
1 0.4097 0.4214 0.4309 0.4396 0.4088 0.4201 0.4277 0.4384 0.4140 0.4246 0.4334 0.4430
3 0.4145 0.4245 0.4322 0.4407 0.4148 0.4217 0.4298 0.4405 0.4180 0.4265 0.4346 0.4438
5 0.4150 0.4248 0.4303 0.4414 0.4147 0.4235 0.4305 0.4408 0.4193 0.4265 0.4340 0.4428
A Simulation Study on the Effect of Reconfiguration Strategy in an Automotive Body Shop Considering the Change of Product-mix
353
The role of new buffer is to decouple sub-lines
and it reduces the length of flow lines with no buffer.
However, the gaps decrease as the increase of buffer
capacities. In most cases, strategy 1 is slightly better
than strategy 2. Note that strategies 1 and 3 require
more spaces for installing new cell lines of electric
car.
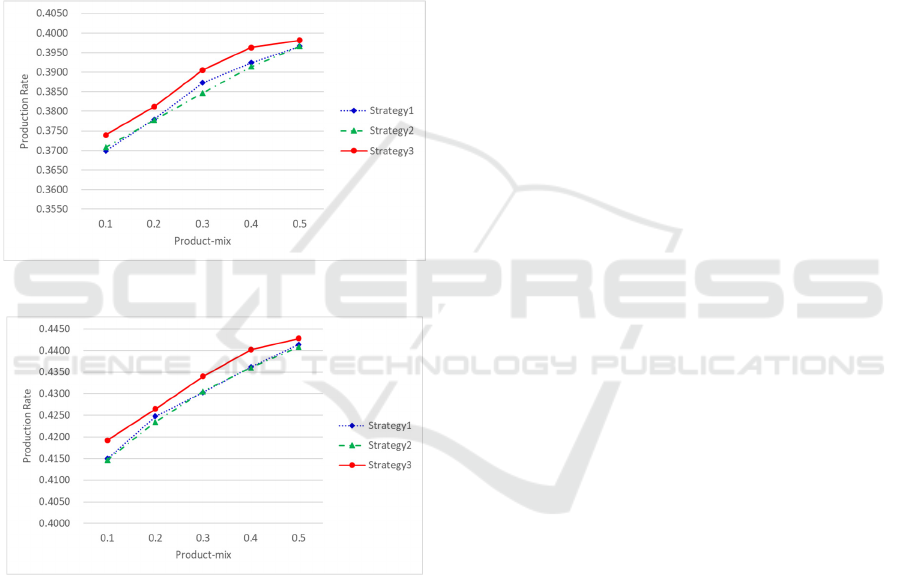
Figure 3 shows the behaviour of production rates
when the buffer capacities of B
1
~B
13
are set to 5, and
B
14
is set to 3. Figure 4 shows the behaviour of
production rates when the buffer capacities of B
1
~B
13
are set to 7, and B
14
is set to 5. We can observe that
the gap between strategy 1 and strategy 2 is reduced
as the increase of buffer capacities.
Figure 3: Behaviour of production rates (B
1
~B
13
=5, B
14
=3).
Figure 4: Behaviour of production rates (B
1
~B
13
=7, B
14
=5).
4 CONCLUSIONS
As the increasing demands of eco-friendly car such as
hybrid cars or electric cars, most of automotive
companies are confronted to change the layout
concept of body shop. In this paper, we consider the
manufacturing system design problem of an
automotive body shop in which two types of car are
produced and engine car is substituted by electric car
gradually. Thus, two different underbody lines are
installed because the underbody structures of the two
types of car are absolutely different. We also consider
the reconfiguration strategies for changing the layouts
as the changes of the product-mix.
In this paper, only the production rate is
considered as the performance measure. However,
additional investment costs and space costs are
required for the reconfiguration of manufacturing
system. Thus, multi-objectives problem can be
considered. Another extension is to develop new
reconfiguration strategies and optimize the buffer
location when there are surplus workstations caused
by the changes of product-mix. To solve the extended
problems, meta-modelling approach can be used for
optimize the new problem.
ACKNOWLEDGEMENTS
This research was supported by Basic Research
Program through the National Research Foundation
of Korea (NRF) (Grant Numbers NRF-2019
R1F1A1057692 and NRF-
2018R1D1A1A09083352).
REFERENCES
Feno, M.R., Cauvin, A. and Ferrarini, A. 2014. Conceptual
Design and Simulation of an Automotive Body Shop
Assembly Line, Proceedings of the 19th World
Congress The International Federation of Automatic
Control, Cape Town, South Africa. 760-765.
Gupta, A., Cai, W., Tilove, R., Shastry, G. K. and Hunsur,
N. K.. 2012. An Approach for Automated and
Optimized Selection of Weldguns for Spot Welding in
Automotive Body Shop, Journal of Manufacturing
Science and Engineering, 134 (3), 034501.
Kahan, T, Bukchin, Y, Menassa, R, Ben-Gal, I. 2009.
Backup Strategy for Robots’ Failures in an Automotive
Assembly System , International Journal of Production
Economics, 120(2), 315-326.
Kim, H.S., Wang, G., Shin, Y.W. and Moon, D.H. 2015.
Comparison of the Two Layout Structures in
Automotive Body Shops Considering Failure
Distributions, Journal of the Korean Institute of
Industrial Engineers, 41(5), 470~480.
Moon, D.H., Cho, H.I, Kim, H.S., Sunwoo, H. and Jung,
J.Y. 2006. A Case Study of the Body Shop Design in an
Automotive Factory Using 3D Simulation,
International Journal of Production Research, 44(18-
19), 4121-4135.
Moon, D.H., Nam, Y.S. and Shin, Y.W. 2016. Effects of
Additional Sub-lines and Buffer Allocation on the
System Performance in an Automotive Body Shop,
Journal of the Korean Society of Supply Chain
Management, 16(2), 135-145.
ICORES 2020 - 9th International Conference on Operations Research and Enterprise Systems
354

Moon, D.H., Nam, Y.S., Kim, H.S. and Shin, Y.W. 2017.
Effect of Part Transfer Policies in two Types of Layouts
in Automotive Body Shops, International Journal of
Industrial Engineering, 24(2), 194-206.
Moon, D.H., Lee, Y.H. and Shin, Y.W. 2018. The Effect of
Mixed-Model Production in Automotive Body Shops
Considering Assembly Methods and Part Transfer
Policies, Journal of the Korean Institute of Industrial
Engineers, 44(5), 391-403.
Muhl, E., Charpentier, P. and Chaxel, F. 2003.
Optimization of Physical Flows in an Automotive
Manufacturing Plant: Some Experiments and Issues,
Engineering Applications of Artificial Intelligence,
16(4), 293–305.
Rossetti, M. 2016. Simulation Modeling and ARENA
®
(2nd
Ed.), Wiley, U.S.A.
Spieckermann, S., Gutenschwager, K., Heinzel, H. and
Voß, H., 2000. Simulation-based Optimization in the
Automotive Industry – A Case Study on Body Shop
Design, Simulation, 75(5), 276-286.
Tahar, R. B. M., Adham, A. A. J. 2010. Design and
Analysis of Automobiles Manufacturing System Based
on Simulation Model, Modern Applied Science, 4(7),
129-134.
A Simulation Study on the Effect of Reconfiguration Strategy in an Automotive Body Shop Considering the Change of Product-mix
355
