
Raman Spectroscopy for Tumor Diagnosis in Mammary Tissue
S. Pimenta
1a
, M. J. Maciel
1b
, A. Miranda
2c
, M. F. Cerqueira
3d
, P. Alpuim
3e
and J. H. Correia
1f
1
CMEMS-UMinho, Department of Industrial Electronics, University of Minho, Guimarães, Portugal
2
ICVS, School of Medicine, University of Minho, ICVS/3B’s - PT Government Associate Laboratory,
Braga/Guimarães, Portugal
3
International Iberian Nanotechnology Laboratory (INL), Braga, Portugal
{fatima.cerqueira, pedro.alpuim.us}@inl.int
Keywords: Raman Spectroscopy, ex-vivo Analysis, Normal vs Tumor Mammary Glands.
Abstract: This paper demonstrates the potential of Raman spectroscopy in the ex-vivo analysis of resected normal and
tumor mammary mouse glands, using a commercial confocal Raman microscope. The Raman spectra were
acquired with a 785 nm excitation laser at 40 mW and using an integration time of 2 s. The Raman spectra
for normal and tumor mouse mammary glands are presented and compared with literature results. The Raman
spectrum of normal mammary mouse gland is dominated by lipid signatures. On the other hand, the Raman
spectrum of tumor mammary gland is dominated by DNA and protein signatures. The molecular information
obtained by using Raman spectroscopy can be fundamental for a more precise and complete diagnosis of
tumors, for intraoperative assessment of tumors margins during surgeries and for tumors grade classification.
1 INTRODUCTION
Globally, cancer is a leading cause of death, being the
breast cancer one of the most common causes of
cancer death, accounting 627 000 cases in 2018
(WHO, 2018). Cancer early diagnosis decreases
healthcare costs and increases the probability to save
the patient life (WHO, 2017).
Raman spectroscopy is a non-invasive and
powerful tool for molecular analysis of disease. This
optical technique is based on inelastic scattering of
light by molecules. The shift in energy of the
scattered light is specific to the vibrational modes of
the molecules from a tissue. Thus, the molecular
information obtained by using Raman scattering can
be used to discriminate diseased and healthy tissues
(Stevens, Petterson, Day, & Stone, 2016).
The key idea behind Raman spectroscopy is that a
disease causes changes in the molecular composition
a
https://orcid.org/0000-0002-6061-320X
b
https://orcid.org/0000-0002-1752-2687
c
https://orcid.org/0000-0002-7297-9639
d
https://orcid.org/0000-0002-3505-6982
e
https://orcid.org/0000-0001-9875-6188
f
https://orcid.org/0000-0001-5991-1069
of a tissue and these changes can be reflected in the
tissue Raman spectrum (Choo-Smith et al., 2002).
The changes are usually related with variations in the
relative concentrations of lipids, proteins, nucleic
acids, etc. (Stevens et al., 2016). The Raman spectrum
is a molecular fingerprint of the tissue (Kong,
Kendall, Stone, & Notingher, 2015).
Majumder et al. (Majumder, Keller, Boulos,
Kelley, & Mahadevan-Jansen, 2008) performed a
study comparing the capabilities of fluorescence,
diffuse reflectance and Raman spectroscopy for
discrimination of different human breast tissues.
Raman spectroscopy showed a superior performance.
The Raman spectrum is a set of narrow bands derived
from molecular vibrations of a large number of
biochemicals presented on the tissues. Thus, with
Raman is possible to acquire molecular information
with superior detail, comparing with fluorescence or
Pimenta, S., Maciel, M., Miranda, A., Cerqueira, M., Alpuim, P. and Correia, J.
Raman Spectroscopy for Tumor Diagnosis in Mammary Tissue.
DOI: 10.5220/0009093501310134
In Proceedings of the 8th International Conference on Photonics, Optics and Laser Technology (PHOTOPTICS 2020), pages 131-134
ISBN: 978-989-758-401-5; ISSN: 2184-4364
Copyright
c
2022 by SCITEPRESS – Science and Technology Publications, Lda. All rights reserved
131
diffuse reflectance (Patil, Bosschaart, Keller,
Leeuwen, & Mahadevan-Jansen, 2008).
Raman spectroscopy is a non-destructive and
chemical-specific technique, being ideal for the
detection of microcalcifications in breast tissue
during biopsies, for example. Raman spectroscopy
can be executed with fiberoptic probes compatible
with biopsy needles (Barman et al., 2013).
Frank et al. (Frank, Redd, Gansler, & McCreery,
1994) performed one of the first studies about breast
cancer diagnosis using Raman spectroscopy. The
Raman spectra of normal and cancerous human
biopsy samples demonstrated Raman differential
features of lipids and carotenoids. In a second work
(Frankt & McCreey, 1995), the authors also studied
normal and diseased human breast tissues and
reported a weaker lipid band and a more pronounced
collagen band in diseased samples. Haka et al. (Haka
et al., 2005) reported the use of Raman spectroscopy
to diagnose benign and malignant lesions in ex-vivo
samples from human breast tissue. They developed a
diagnostic algorithm for distinguish cancerous tissues
from normal and benign tissues, with 94% sensitivity
and 96% specificity. In a second study (Haka et al.,
2006), the authors reported the in-vivo collection of
Raman spectra during partial mastectomy, suggesting
the potential of Raman spectroscopy for
intraoperative margin assessment (Cui, Zhang, &
Yue, 2018).
For breast tissues analysis is also reported the use
of an excitation laser of 785 nm and a maximum
power of 300 mW (Horsnell et al., 2010; Stevens et
al., 2016).
Along this paper, the potential of Raman
spectroscopy is shown with the ex-vivo analysis of
resected normal and tumor mammary mouse glands,
using a commercial equipment. Final considerations
were also discussed related to the potential of Raman
spectroscopy in routine clinical practice, associated
with intraoperative assessment of tumors margins
during surgeries and also with tumors grade
classification.
2 RAMAN SPECTROSCOPY OF
BIOLOGICAL TISSUE
2.1 Optical Considerations for Raman
Spectroscopy
The Raman system used in this study was the WiTec
Alpha300 R confocal Raman microscope, from Witec
Ulm Germany. This system combines a highly
sensitive confocal microscope with an
ultrahigh-throughput spectroscopy system. A high
spatial and spectral resolution are achieved by
combining several optical components such as filters,
lenses, objectives and a sensitive detector.
“Confocal” means “having the same focus” and
defines an optical microscope in which the sample is
illuminated with a point source. The “image” of this
point is detected using a pinhole in the optical fiber
that drives the signal to the spectrometer and then to
the detector. Thus, only the light originated from the
focal plane is detected and contribute to the “image”
(Giridhar, Manepalli, & Apparao, 2017).
The WiTec Alpha300 R confocal Raman
microscope has a lateral resolution of 200-300 nm, a
depth resolution of 500 nm, a spectral resolution of
approximately 1 cm
-1
and a spectrometer with a
variety of focal lengths.
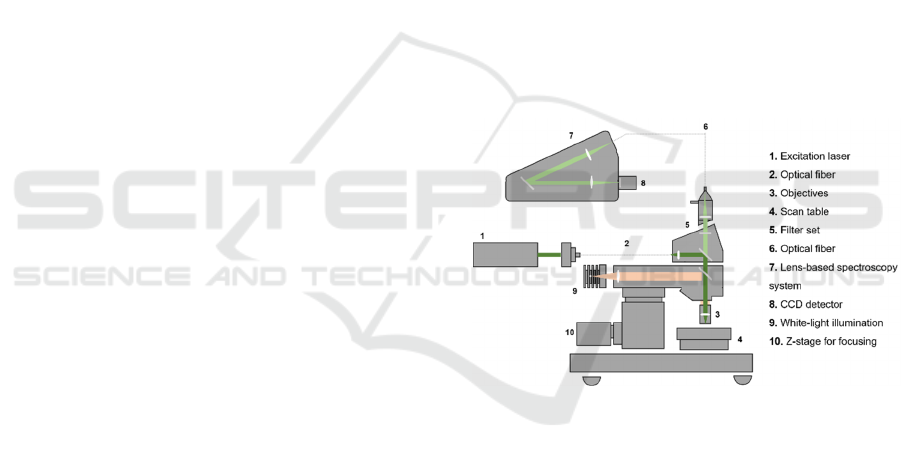
The system allows different types of
measurements, but it was used for single spectrum
acquisition with a 785 nm excitation laser. Figure 1
represents a schematic of the WiTec Alpha300 R
confocal Raman microscope system.
Figure 1: Schematic of the WiTec Alpha300 R confocal
Raman microscope, from Witec Ulm Germany.
2.2 Raman Spectroscopy with WiTec
Alpha300 R
Raman spectra with WiTec Alpha300 R system were
collected from resected mammary mouse glands. The
main objective is to analyze the power of Raman
scattering to differentiate a normal mammary mouse
gland from a tumor mammary mouse gland. The
frozen mammary mouse glands (normal and tumor)
were sliced and put on a glass slide for the Raman
analysis.
The spectra were acquired with the Witec control
software, using a 785 nm excitation laser at 40 mW,
2 s of integration time and 100 accumulations. After
acquisition, the spectra were baseline corrected
PHOTOPTICS 2020 - 8th International Conference on Photonics, Optics and Laser Technology
132
considering a 4
th
order polynomial fitting and filtered
with a filter size of 3
th
order and a dynamic factor of 1.
The baseline correction and filtering were also
performed at the Witec control software.
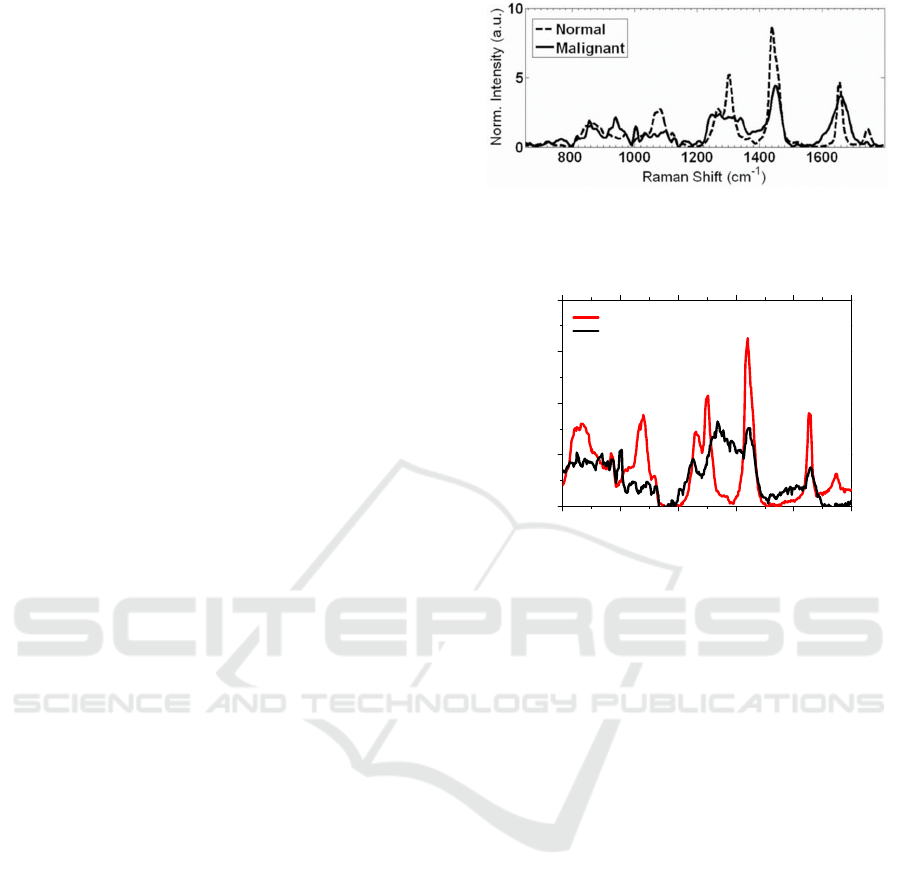
Figure 2 shows the Raman spectra from literature
of an ex-vivo human breast sample, acquired with a
785 nm diode laser, a long-pass filter to reduce
Rayleigh scattering, a CCD camera and other optical
components (Patil, Bosschaart, Keller, Leeuwen, &
Mahadevan-Jansen, 2008).
Figure 3 shows the acquired Raman spectra, using
the WiTec Alpha300 R confocal microscope, for
normal and tumor mammary mouse glands. The
Raman spectra from the normal and tumor mammary
mouse glands are clearly different.
The obtained experimental results (Figure 3) from
normal and tumor mammary mouse glands, as
expected, presents the signature of lipids and proteins,
in the range of 800 to 1800 cm
-1
, and are very similar
to the literature spectra (Figure 2).
Moreover, the experimental spectra (Figure 3)
reveal clear differences between the normal and
tumor tissue. From Figure 3, it is seen that the normal
spectrum is dominated by lipid signatures, namely
peaks at approximately 1070, 1300 and 1440 cm
-1
. On
the other hand, the tumor spectrum is dominated by
protein (peaks at approximately 1450 and 1660 cm
-1
)
and by DNA (peak at 1336 cm
-1
) signatures, usually
indicative of malignancy (Movasaghi, Rehman, &
Rehman, 2007; Patil et al., 2008; Stone, Kendall,
Smith, Crowa, & Barra, 2004).
Additionally, it is also seen on Figure 3: i) a
strongly decrease in the intensity together with
broadening of the modes in the tumor gland; ii) a
strongly decrease in intensity of the peaks at
approximately 1100 cm
-1
and the
doublet at 1300 cm
-1
for the tumor tissue; and iii) the
peak at 1750 cm
-1
is absent in the tumor gland. All
these effects can be indicative of malignancy.
Finally, comparing Figure 2 and Figure 3 for
normal tissues, it can be seen that several ratios
between peaks are very similar, for example: between
1440 and 1300 cm
-1
(ratio of approximately 1.8); and
between 1440 and 1650 cm
-1
(ratio of approximately
2). In the case of the tumor tissues, the ratios between
the peaks are not very similar, which can be related
with the degree of malignancy of each sample (for
Figure 2 and Figure 3). Despite this differences, the
most important feature is the clearly difference
between the Raman spectra of the normal and tumor
tissues, for both figures.
Figure 2: Raman spectra of an ex-vivo human breast sample,
considering a 785 nm excitation diode laser (Patil et al.,
2008).
800 1000 1200 1400 1600 1800
0
100
200
300
400
Intensity (a.u.)
Raman shift (cm
-1
)
Normal mammary gland
Tumor mammary gland
Figure 3: Raman spectra of resected normal mammary
gland and tumor mammary gland of a mouse. The spectra
were acquired with the Witec Alpha300 R system, with an
integration time of 2 s and 100 accumulations.
3 CONCLUSIONS AND FUTURE
GUIDELINES
The ex-vivo analysis of biological tissues using a
commercial Raman equipment was presented. The
results proved the potential of Raman spectroscopy in
differentiate the normal and tumor tissues, using a
785 nm laser with 40 mW total power, an integration
time of 2 s and 100 accumulations.
In Raman spectroscopy is crucial to take into
account the maximum permissible light exposure and
avoid the tissue temperature increase, relevant to
minimize tissue damage. This parameter is even more
important during in-vivo spectra acquisition, to ensure
patient comfort.
These preliminary tests with ex-vivo analysis of
resected normal and tumor mammary mouse glands,
prove the potential of the used Raman microscope to
differentiate normal and tumor tissues: the normal
mammary gland spectrum is dominated by lipid
signatures and the tumor mammary gland spectrum is
dominated by DNA and protein signatures. These
promising results open the future possibility to use
Raman Spectroscopy for Tumor Diagnosis in Mammary Tissue
133

this commercial equipment to other type of analysis,
for example, the analysis and differentiation of
normal and malignant human tissues, for a variety of
applications.
A great area of expansion of the Raman
spectroscopy technique is the use of the high Raman
molecular specificity for intraoperative assessment of
tumors margins during surgeries, in order to reduce
the re-operation procedures. If the patient
re-operation is avoided, the healthcare costs and
patient anxiety are also reduced. For this application,
it is required the implementation of a portable Raman
system to be use in the operation rooms.
Finally, the application of Raman spectroscopy in
routine clinical practice can also have a huge impact
in grade classification, essential for diagnosis and
prognosis of diseases, i. e., to predict how quickly a
tumor will grow and spread. This knowledge is
crucial for planning the best treatment for the patient,
increasing the probability of a success treatment and
cure. Again, for this last described application, it is
desirable the implementation of a portable Raman
system or the adaptation of a Raman probe to the
existing methods of diseases diagnosis in routine
clinical practice.
ACKNOWLEDGEMENTS
This work is supported by FCT with the project
reference PTDC/CTM-REF/28406/2017, operation
code POCI-01-0145-FEDER-028406, through the
COMPETE 2020
REFERENCES
Barman, I., Dingari, N. C., Saha, A., McGee, S., Galindo,
L. H., Liu, W., . . . Fitzmaurice, M. (2013). Application
of Raman spectroscopy to identify microcalcifications
and underlying breast lesions at stereotactic core needle
biopsy. Cancer Research, 73, 3206-3215.
Choo-Smith, L.-P., Edwards, H. G. M., Endtz, H. P., Kros,
J. M., Heule, F., Barr, H., . . . Puppels, G. J. (2002).
Medical Applications of Raman Spectroscopy: From
Proof of Principle to Clinical Implementation.
Biopolymers (Biospectroscopy), 67, 1-9.
Cui, S., Zhang, S., & Yue, S. (2018). Raman Spectroscopy
and Imaging for Cancer Diagnosis. Journal of
Healthcare Engineering, ID 8619342.
Frank, C. J., Redd, D. C. B., Gansler, T. S., & McCreery, R.
L. (1994). Characterization of Human Breast Biopsy
Near-IR Raman Spectroscopy. Analytical Chemistry,
66, 319-326.
Frankt, C. J., & McCreey, R. I. (1995). Raman Spectrosco-
py of Normal and Diseased Human Breast Tissues.
Analytical Chemistry, 67, 777-783
Giridhar, G., Manepalli, R.R.K.N., & Apparao, G. (2017).
Chapter 7: Confocal Raman Spectroscopy
Spectroscopic Methods for Nanomaterials
Characterization: Elsevier.
Haka, A. S., Shafer-Peltier, K. E., Fitzmaurice, M., Crowe,
J., Dasari, R. R., & Feld, M. S. (2005). Diagnosing
breast cancer by using Raman spectroscopy. PNAS, 102,
12371-12376.
Haka, A. S., Volynskaya, Z., Gardecki, J. A., Nazemi, J.,
Lyons, J., Hicks, D., . . . Feld, M. S. (2006). In vivo
Margin Assessment during Partial Mastectomy Breast
Surgery Using Raman Spectroscopy. Cancer Research,
66, 3317-3322.
Horsnell, J., Stonelake, P., Christie-Brown, J., Shetty, G.,
Hutchings, J., Kendalla, C., & Stonea, N. (2010).
Raman spectroscopy—A new method for the intra-
operative assessment of axillary lymph nodes. Analyst,
135, 3042-3047.
Kong, K., Kendall, C., Stone, N., & Notingher, I. (2015).
Raman spectroscopy for medical diagnostics - from in-
vitro biofluid assays to in-vivo cancer detection.
Advanced drug delivery reviews, ADR 12752.
Majumder, S. K., Keller, M. D., Boulos, F- I., Kelley, M.
C., & Mahadevan-Jansen, A. (2008). Comparison of
autofluorescence, diffuse reflectance, and Raman
spectroscopy for breast tissue discrimination. Journal
of Biomedical Optics, 13, 054009.
Movasaghi, Z., Rehman, S., & Rehman, I. U. (2007).
Raman Spectroscopy of Biological Tissues. Applied
Spectroscopy Reviews, 42, 493-541.
Patil, C. A., Bosschaart, N., Keller, M. D., Leeuwen, T. G.
van, & Mahadevan-Jansen, A. (2008). Combined
Raman spectroscopy and optical coherence tomography
device for tissue characterization. Optics Letters, 33,
1135-1137.
Stevens, O., Petterson, I. E. I., Day, J. C. C., & Stone, N.
(2016). Developing fibre optic Raman probes for
applications in clinical spectroscopy. Chemical Society
Reviews, 45, 1919-1934.
Stone, N., Kendall, C., Smith, J., Crowa, P., & Barra, H.
(2004). Raman spectroscopy for identification of
epithelial cancers. Faraday Discussions, 126, 141-157.
WHO. (2017). Early cancer diagnosis saves lives, cuts
treatment costs. Retrieved 14 October, 2019, from
https://www.who.int/news-room/detail/03-02-2017-
early-cancer-diagnosis-saves-lives-cuts-treatment-
costs
WHO. (2018). Fact sheets - Cancer. Retrieved 14 October,
2019, from https://www.who.int/news-room/fact-
sheets/detail/cancer
PHOTOPTICS 2020 - 8th International Conference on Photonics, Optics and Laser Technology
134
