
Agent-Based Model Application for Resource Management Analysis
Fumi Okura
1
, I. Wayan Budiasa
2
and Tasuku Kato
3a
1
United Graduate School of Agricultural Science, Tokyo University of Agriculture and Technology, Tokyo, Japan
2
Faculty of Agriculture, Udayana University, Bali, Indonesia
3
Institute of Agriculture, Tokyo University of Agriculture and Technology, Tokyo, Japan
Keywords: Agent-Based Model, Water Management, Irrigation and Drainage.
Abstract: Due to climate change and population growth, the agriculture sector has been faced with two challenges;
securing water and food and transferring into sustainable resource management. To systematize resource
management which currently mainly relies on farmers’ experience, digital technologies have been developed.
Considering current tighter resource availability, it is desirable to examine resource management behavior of
beneficiaries using scarce resources to analyze resilience and adaptability of institutions. In this study, we
analyzed factors of water use behavior of Water Users Associations (WUAs) to solve water allocation problem
with Agent-Based Model (ABM). The simulation results show that factors of water use behavior were water
resources and the existence of different water use laws, and downstream WUAs developed adaptation
methods. To enhance sustainable resource management, ABM can be applied to analyze factors and their
rules and/or laws to understand what enhances resilience and adaptability of institutions.
1 INTRODUCTION
The agriculture sector has been faced with challenges
to secure water and food. To solve these challenges,
digital technologies such as Artificial Intelligence
(AI) and Internet of Things have the potential to
create new systems to improve productivity (
Trendov
et al.
, 2019). AI can systematize agricultural
management which mainly relies on farmers’
experience. It will also help pass accumulated
valuable agricultural knowledge to the next
generation (Ministry of Agriculture, Forestry and
Fisheries in Japan).
To understand conventional water use rules of
farmers, Lansing and Kremer (1993) analyzed
farmers’ decision-making about cropping patterns in
irrigated rice farming area. They investigated 172
water users’ associations (WUAs) located in two
rivers’ basins in south-central Bali and found that the
WUAs had two constraints; water sharing and pest
control. If WUAs cooperatively fallowed large paddy
fields during a certain period, pests could be killed.
However, after the fallowing period, large paddy
fields needed irrigation water at the same time, and it
could pose water stress. In the basins, the WUAs were
grouped, and all WUAs in a group had the same
a
https://orcid.org/0000-0003-4473-1131
cropping pattern. With Agent-Based Modeling
(ABM) and simulation, the study finds that water
management of the WUAs decreases water stress and
pest damage and optimizes rice yields. This result
shows that, first, even with limited resources,
beneficiaries can coordinate their behavior for
sustainable and equal resource use. Second, it
exemplifies that ABM is instrumental in analyzing
resource use behavior.
Due to climate change and population growth,
resource management has become more severe so that
sustainability of current resource use by beneficiaries
is in question. Therefore, it is desirable to examine the
behavior of beneficiaries using scarce resources to
analyze resilience and adaptability of institutions
such as WUAs. In this study, we targeted irrigated
rice farmers and analyzed factors of water use
behavior of WUAs to solve the water allocation
problem. For the analysis, we built an ABM by
modifying Lansing and Kremer model. This study
presents how digital technologies can help us analyze
resource management, and suggests the potential of
technologies such as ABM to improve resource
management based on the analysis.
This paper is organized as follows: Section 2
describes water management in irrigated paddy fields
242
Okura, F., Budiasa, I. and Kato, T.
Agent-Based Model Application for Resource Management Analysis.
DOI: 10.5220/0009093302420249
In Proceedings of the 12th International Conference on Agents and Artificial Intelligence (ICAART 2020) - Volume 1, pages 242-249
ISBN: 978-989-758-395-7; ISSN: 2184-433X
Copyright
c
2022 by SCITEPRESS – Science and Technology Publications, Lda. All rights reserved
of the target area in Bali, Indonesia. Section 3
presents how we replicated water use behavior of the
target area with ABM. In Section 4, from simulation
results, we show factors of water use behavior and,
discuss the results in Section 5.
2 WATER MANAGEMENT IN
IRRIGATED PADDY FIELDS
In this section, we take an example of WUGs in Bali
and explain how farmers decide water management in
irrigated paddy fields.
2.1 Subak System
Over the centuries, Balinese paddy terrace fields have
been managed by traditional water users’ association,
Subak. A Subak is composed of all the paddy fields
irrigated from a single water source such as a dam or
a sluice, and its members are all landowners of the
paddy fields (Geertz, 1980). The structure of a Subak
is hierarchical and consists of Subak board members
and members. The smallest groups in a Subak are
sub-Subaks which are bounded by artificial or natural
obstacles such as road and creek. A sub-Subak is the
smallest unit of the decision making process in Subak
system and should have the same cropping calendar.
(Suradisastra et al., 2002). The uniqueness of Subak
system is having a democratic organization whose
rice cultivation roots in Balinese Hinduism, owning
rules called Awig-awig, and performing rituals along
with the stages of paddy growth (Suradisastra et al.,
2002).
Awig-awig has rules necessary for democratic
management. It contains, for example, organization
structure, term of Subak board members, frequency
of Subak meeting, water allocation rules among
Subak members, cropping pattern(s), communal
works, and penalties (Nagano, 2011). One of the tasks
of Subak board members, especially the head of
Subak, is the creation of a seasonal water
management plan. Although awig-awig defines water
allocation rules and cropping pattern(s), depending on
climate conditions and water use of other Subaks, in
every cropping season water use adjustment is
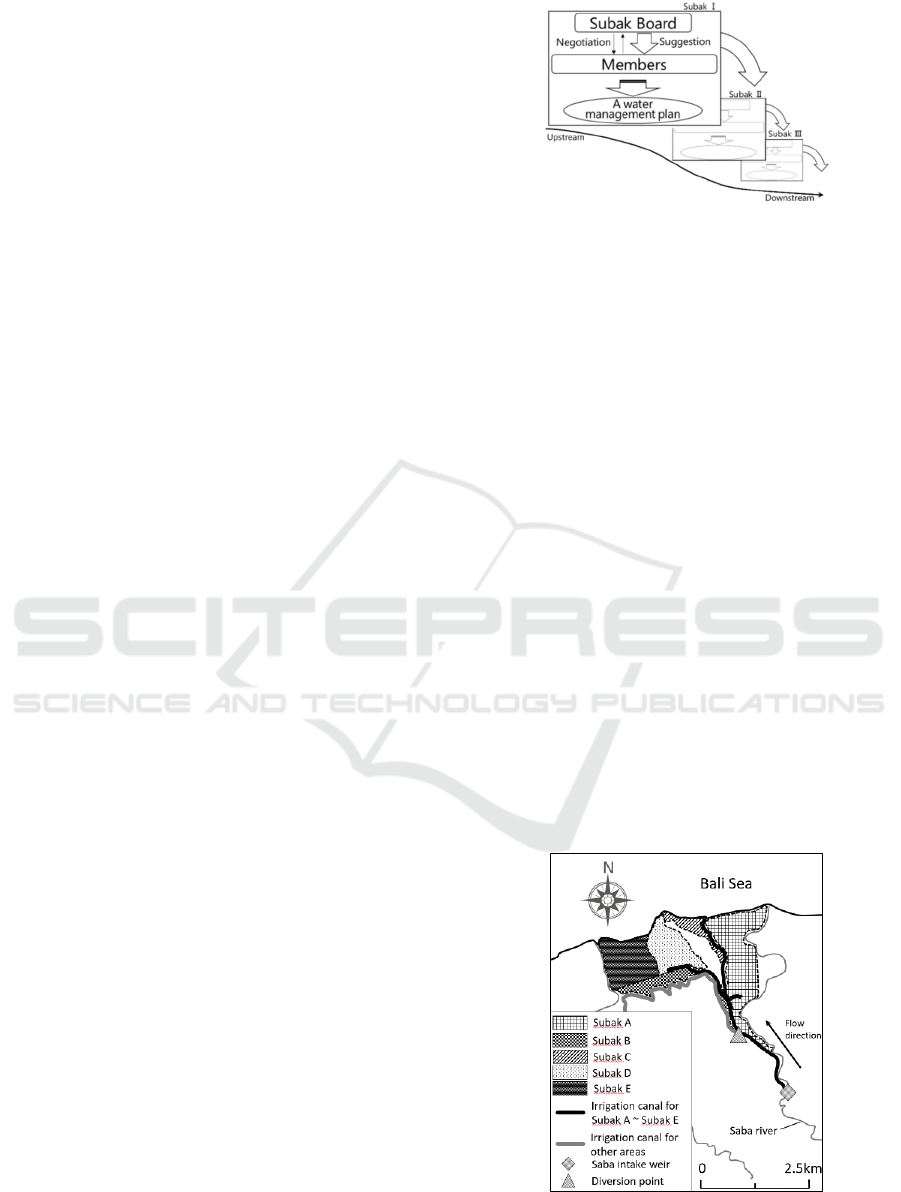
needed. For that reason, as Figure 1 shows, in the
Subak meeting, all Subak members discuss a water
management plan proposed by Subak board. Once a
water management plan is endorsed by the majority
of the Subak members, every Subak members are
obligated to follow it. Hence, one Subak has one
water management plan in a cropping season.
Figure 1: Decision flow of a water management plan.
2.2 Study Area
To understand the Subak system, we investigated five
Subaks; Subak A, Subak B, Subak C, Subak D and
Subak E located in downstream of Saba watershed in
Buleleng regency, Province of Bali Island, Indonesia.
Figure 2 shows the research location. While Subak A
tended to have stable cropping calendars, Subak B
through E changed cropping calendars every year.
The five Subaks had shared a water resource taken
from Saba intake weir for more than 50 years. Saba
intake weir was located in Subak A so that Subak A
had the power to manage the weir over other Subaks.
Among sub-Subaks of Subak A spreading along the
primary irrigation canal, two of them were the closest
to Saba intake weir. After the two sub-Subaks
(hereinafter called group A1), the primary irrigation
canal was diverted into two irrigation canals. One of
two irrigation canals irrigated the rest of sub-Subaks
of Subak A (hereinafter called group A2), and then
Subak B. The other canal irrigated in order of Subak
C, Subak D, and Subak E. As Table 1 shows, among
five Subaks, Subak A had widest paddy fields and
most Subak numbers. The tail users, Subak D and
Subak E, had the second widest paddy fields.
Figure 2: Location of the study area.
Agent-Based Model Application for Resource Management Analysis
243
Rice cropping consisted of paddling and leveling
(hereinafter called paddling), rice growth and
harvesting. Paddling needed a substantial amount of
irrigation water continuously. In fact, from 20% to
30% of the total water requirement of single rice
cultivation is used during paddling (Sembiring et al.,
2011). After rice transplantation, the rice growth
period continued around 90 days. In this period,
paddy fields kept 10 to 15 cm of water depth until
around 10 days before harvesting.
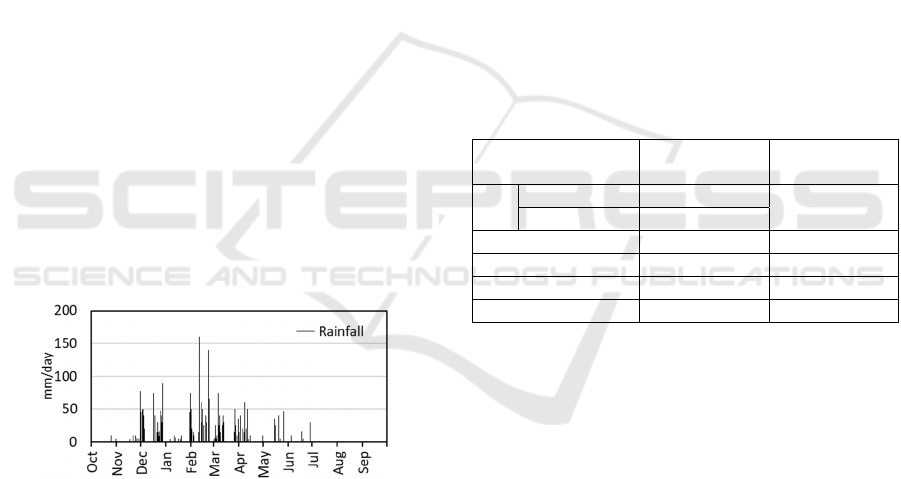
To maximize rice production, Subaks needed to
fit their water use into a rainfall pattern. Figure 3
shows a normal rainfall pattern from October 2004 to
September 2005 observed by Agency of
Meteorology, Climatology and Geophysics. The
rainy season started in October, and after the peak of
rainfall reached in February, rainfall decreased to
shift to the dry season starting from April. From July
to September, it rarely rained. To grow paddy as
many as possible in a year, Subaks generally started
paddling of the first rice cropping season when the
rainy season started, finished one rice cultivation
within four months, and continuously grew paddy
three times a year. However, in the dry season, if
Subak members predicted water sacristy would occur,
they grew non-paddy crop(s) without using irrigation
water. Practically, internal and external conditions
irregularly changed so that Subaks decided their
water use seasonally. To replicate their decision-
making process of water use with ABM, we
interviewed five heads of Subak from 2014 to 2016.
Figure 3: Daily rainfall amount in Subak A area from Oct.
2004 to Sep. 2005.
3 MODEL DEVELOPMENT
In this section, we explain our ABM. The model was
developed to simulate the water allocation system of
the study area. The model components and agent
behavior were decided based on interview results.
3.1 Model Components
The water allocation phenomenon created by water
use of each five Subak has been replicated in our
ABM. The model components are an irrigation canal
network consisting of Intake Weir and Irrigation
Canals, Intake Points of agents, and agents which
represent Subaks. Because Subak A worked as two
groups, group 1 and group 2, we created two agents
for Subak A. Consequently, our ABM has six agents,
Agent A1, Agent A2, Agent B, Agent C, Agent D and
Agent E. The six agents are aligned along Irrigation
Canals as they were observed and take water from
Intake Points which were given one for each agent.
The agents in this model know irrigation water flow
from Intake Points, and Intake Weir inflow is
ultimately shared among the agents. This information
conveyance brings about adjustment of agents’ water
use to maximize rice yield. The paddy field sizes of
agents are the same as the real sizes as Table 1 shows.
The water use behavior of agents was defined based
on interview results.
Table 1: Attributes of Subaks.
Subak
Rice field
(ha)
Members
(person)
A
Group A1 19
264
Group A2 103
B 21 44
C 17 34
D 71 156
E 71 132
3.2 Cropping Patterns
Subak A and the other Subaks had different cropping
patterns. Subak A grew paddy four times and non-
paddy crops once in two years thanks to abundant
irrigation water. For Subak A, growing non-paddy
crops was a purpose of pest control and soil
restoration. The rice farmers in the study area
experimentally knew that the rice yield was higher
when the harvest season was from September to
October. It was the reason why Subak A preferred to
grow non-paddy crops from April to May to secure
the rice yield of the next cropping season. On the
contrary, Subak B, Subak C, Subak D, and Subak E
changed cropping calendars and had double or triple
rice cropping per year depending on seasonal water
availability. If irrigation water seemed scarce to grow
paddy in the third cropping season which was the later
part of the dry season, they grew non-paddy crops
requiring no irrigation water.
ICAART 2020 - 12th International Conference on Agents and Artificial Intelligence
244

Therefore, our ABM had two sets of cropping
patterns. Subak A had (paddy-paddy-paddy-paddy-
nonpaddy) and (paddy-paddy-paddy-paddy-paddy),
and Subak B, Subak C, Subak D and Subak E had
(paddy-paddy-paddy) and (paddy-paddy-nonpaddy).
3.3 Customary Laws on Water Use
Owing to differences in water availability between
Subak A and the other Subaks, customary laws
describing their water use were different. In
summary, customary laws of five Subaks defined four
rice cropping phases; the beginning of the first rice
cropping season, paddling, rice growing, and
harvesting. Nonetheless, the general Subak system
basically prescribes that all Subak members in a
Subak have the same cropping pattern, exceptions
were found in all five Subaks. Thus, here we focus on
basic customary laws.
With abundant irrigation water, Subak A decided
the beginning date of the first cropping season freely.
It also usually didn’t have to heed change of water
availability to adjust the length of the paddling period.
Consequently, the customary laws of Subak A tended
to have fixed cropping calendars. Reflecting these
features, we created three cropping calendars (Table
2).
On the contrary, due to lack of irrigation water,
water use of the other Subaks, Subak B, Subak C,
Subak D and Subak E changed cropping schedules
depending on rainfall and availability of irrigation
water. The other Subaks scheduled the beginning date
of the first rice cropping season when the rainy season
started, but in the event of low irrigation water supply,
they staggered and scheduled the beginning date later
than that of upstream Subaks. In addition to that, these
Subaks seasonally adjusted length of the paddling
periods depending especially on water availability.
However, even with the adjustment if they estimated
water scarcity would happen, non-paddy crops were
chosen. The customary laws of the other Subaks
illustrate that water use of other upstream Subak(s),
especially Subak A is influential enough to change
their water use because of lack of irrigation water.
Following an annual change of rainfall patterns,
Subak B through E change water use. This is the
reason why their cropping calendars varied every year
(Table 3).
Water use of Subak A influenced to the other
Subaks, and the other Subaks adapted to changes of
water flow caused by upstream Subaks, especially
Subak A. Therefore, hereinafter, we refer to the set of
customary laws of Subak A as “dominant laws”, and
the set of customary laws of Subak B through Subak
Table 2: Customary laws of Subak A.
p
hase Customar
y
law Facto
r
The
beginning
of the first
rice
cropping
season
Freely decide the beginning
date of the first rice
cropping season
Water
resources
Paddling
Adjust the paddling period
depending on water
availability and labor force
Water
resources
Labor
force
Harvesting
Adjust the harvesting
period depending on labor
force
Labor
force
Table 3: Customary laws of the others.
p
hase Customary law Facto
r
The
beginning
of the first
rice
cropping
season
Set the beginning date of
the first rice cropping
season at the beginning of
the rain
y
season
Water
resources
In the event of low water
supply, stagger the
beginning date of the first
rice cropping season to set
later than upstream Subaks.
Water
resources
Paddling
Adjust the paddling period
depending on water
availability and labor force
Water
resources
Labor
force
Rice
growing
If estimated yield < 5
t/ha/season, plan non-paddy
cro
p
s
Water
resources
Harvesting
Adjust the harvesting period
depending on labor force
Labor
force
E as “submissive laws”. As Table 2 and Table 3 show,
the main factor of both dominant laws and submissive
laws was water resources. Therefore, from now, we
will only consider water resources-related laws to
simply replicate adjustment mechanisms of
submissive laws.
3.4 Adjustment of Cropping Calendars
Based on submissive laws, we set the model ran with
ten-day time steps, and modeled the adjustment
mechanism of two rice cropping phases; the
beginning of the first rice cropping season and
paddling. The two phases were governed by water
resource-related laws so that the paddling period
evaluation and yield were calculated on a demand-
supply basis.
The paddling period evaluation is evaluated by:
Agent-Based Model Application for Resource Management Analysis
245
𝑅
=
𝑇𝑆
𝑇𝐷
k
(1)
where, R
pad
is the total water supply and demand ratio
of the paddling period, TS
pad
is total water supply of
the paddling period𝑚
), TD
pad
is total water demand
of the paddling period 𝑚
). k is a coefficient
denoting the demand intensity of each agent. In our
model, TS
pad
= TD
pad
with (total rainfall amount of the
paddling period + total irrigation water amount of the
paddling period) ≥ TD
pad
, and
TS
pad
= (total rainfall
amount of the paddling period + total irrigation water
amount of the paddling period) with (total rainfall
amount of the paddling period + total irrigation water
amount of the paddling period) < TD
pad
. As following
research by Sembiring et al. (2011), we suppose that
TD
pad
is 200(mm/season). k is decided according to
the results of water flow measurement; 3.5 is for
Agent A1 and Agent A2, 2.5 is for Agent B, 1.5 is for
Agent C and Agent D, and 1.0 is for Agent E.
Yield is calculated by:
y
=
𝑇𝑆
𝑇𝐷
k
𝑦
(2)
where, y is yield (t/ha/season), TS is total water
supply of the rice growth period 𝑚
); TD is the total
water demand of the rice growth period 𝑚
). k is
coefficient denoting demand intensity, and 𝑦
is
maximum yield (t/ha/season). In our model, TS is
calculated as (1), TD is calculated on 20 (mm/day)
basis referring to Japanese average, k is given as (1),
and y
max
is 9 (t/ha/season) according to our field
research result. For the yield evaluation, the yield
threshold for the first season and the second season is
7 (t/ha/season), and that for the third season is 5
(t/ha/season). We change the value of the yield
threshold to replicate an actual decision.
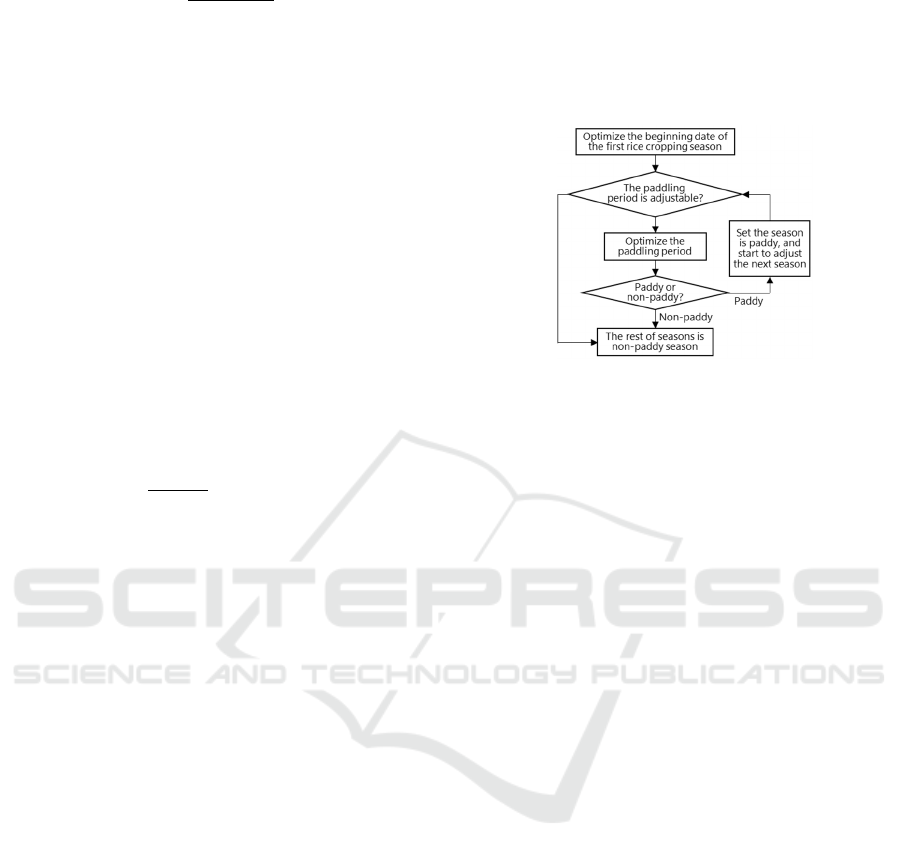
With the formula (1) and (2), agents in our ABM
optimize two phases of a given cropping pattern as
Figure 4 shows. First of all, agents optimize their
beginning date of the first rice cropping season. They
adjust the paddling period of the first rice cropping
season until R
pad
becomes 1 and its length becomes
the shortest among options. At the same time, if the
evaluated first rice yield is below the yield threshold,
agents stagger the beginning date until the first rice
yield becomes equal to or above the yield threshold.
Second, from the second cropping season, agents
evaluate the adjustability of the paddling period, and
if possible, optimize its length. Third, agents evaluate
whether the second rice yield is equal to or above the
yield threshold. If so, they start to adjust the third
season. However, if the paddling period is not
adjustable or rice yield is below the yield threshold,
they grow non-paddy crops in the rest of the cropping
year. When agents adjust the paddling period, they
choose the shortest days from 20 days, 30days and 40
days. However, the rice growth period and the
harvesting period are fixed, 90 days and 10 days
respectively.
Figure 4: Adjustment process of cropping calendars.
3.5 External Conditions
As external conditions, we use two sets of secondary
data of water resources; rainfall data observed in
Subak A and Saba Intake weir inflow data observed
by Bali River Basin Administration Office (Balai
Wilayah Sungai Bali-Penida (BWS-BP). First,
regarding rainfall data, to see water use behavior
under normal rainfall patterns, we chose rainfall data
from October 2000 to September 2002 and from
October 2003 to September 2009. Second, as Intake
Weir inflow in our ABM, we referred to Saba intake
weir inflow data from January 2004 to March 2006.
The data fluctuated by multiple reasons such as
irrigation canal repair, unusual irrigation water
request, and rainfall event so that, to simplify the
seasonal fluctuation tendency, the initial Intake Weir
inflow was set to 1750,000( 𝑚
/day) in the rainy
season and 122,500(𝑚
/day) in the dry season. In the
simulation, we used 10-days data of both water
resources.
4 SIMULATION RESULTS
In this section, we show simulation results that were
conducted to examine the effects of dominant laws
and submissive laws. First, we applied the same laws,
submissive laws, to all six agents; Agent A1, Agent
B, Agent A2, Agent C, Agent D, and Agent E. We
simulated cropping calendars with seven different
water volumes of Intake Weir flow and compared the
number of cropping calendars among the six agents.
Second, we applied the different laws; applied
ICAART 2020 - 12th International Conference on Agents and Artificial Intelligence
246

dominant laws to Agent A1 and Agent A2, and
applied submissive laws to the others; Agent B, Agent
C, Agent D, and Agent E. We simulated cropping
calendars with the initial Intake Weir inflow and
compared the number of cropping calendars with
ones simulated when all agents had the same laws.
With submissive laws, our model creates
cropping calendars randomly as the initial condition
of agents. Specifically, before a simulation runs,
agents have a cropping calendar coming from a
cropping pattern with randomly selected paddling
periods except for the beginning date of the first rice
cropping. Following the interview results, all agents
have October 1
st
as the initial beginning date. Once a
simulation starts, the model continues running until
cropping calendars of all agents converged. In every
Intake Weir inflow, we got results of 100 simulations.
4.1 The Same Customary Laws
Table 4 shows the number of cropping calendars
when all agents have the same laws; submissive laws.
When Intake Weir inflow is the initial, the number of
cropping calendars are one for Agent A1, Agent B,
and Agent A2, two for Agent C and Agent D, and four
for Agent E. When Intake Weir inflow increases more
than the initial, in the end, all agents have the same
cropping calendar. It shows that downstream agents
produce a couple of cropping calendars to adapt to
conditions of water scarcity, and when the irrigation
water supply is enough, all agents yield one cropping
calendar. Therefore, the selection of cropping
calendars is affected by the amount of water
resources.
Table 4: The number of cropping calendars with the same
law.
The volume of
Intake Weir
inflow
A
g
ent
A1 B A2 C D E
The initial -10% 1 1 2 2 2 1
The initial 1 1 1 2 2 4
The initial +10% 1 1 1 2 2 1
The initial +20% 1 1 1 1 1 1
The initial +30% 1 1 1 1 1 1
4.2 The different Customary Laws
Here, the initial Intake Weir inflow was applied. We
gave three fixed cropping calendars to Agent A1 and
Agent A2 based on dominant laws. The other agents;
Agent B, Agent C, Agent D, and Agent E, were given
a cropping calendar randomly as we did when all
agents had the same laws. We analyzed the number
of cropping calendars of all agents except Agent A1
and Agent A2. The simulation results are shown in
the bottom row of Table 5.
The number of cropping calendars is Agent E >
Agent D > Agent C > Agent B. Closer an agent is to
the tail, less irrigation water it gets, and more
cropping calendars it produces. The upper row of
Table 5 is the number of cropping calendars when all
agents have the same laws and the initial Intake Weir
inflow. Compared to the same laws, with the different
laws Agent D produces four times more cropping
calendars and Agent E does three times more. These
results show that the existence of the different laws in
an area increases cropping calendars of, especially,
downstream users when irrigation water is limited.
Table 5: Comparisons of the number of cropping calendars
between the same laws and the different laws.
Applied laws
Agent
BC D E
The same laws 1 2 2 4
The different laws 1 2 8 11
5 DISCUSSIONS
With Agent-Based Model this study replicated
changes in cropping calendars and found two factors
of behavioral changes. The field research found that
downstream Subaks especially such as Subak D and
Subak E varied their cropping calendars every year.
The model simulation results are consistent with the
field research result, and in the simulation results,
downstream agents produced various cropping
calendars. Concerning the replication of changes in
cropping calendars, this study shows that Agent-
Based Model is useful. With Agent-Based Model
simulation, this study also found that water resources
and the existence of different water use laws were the
factors of water use behavior of irrigators in irrigated
paddy fields sharing water resources. These results
show that ABM simulation can help analyze social
and environmental factors of water use behavior.
In Lansing and Kremer model (1993), WUAs
synchronized their cropping calendars to reduce pest
damage, and their grouping was the optimal way to
minimize water stress and increase rice yield.
Similarly, in our study area, water stress was a
constraint, but pest damage was not farmers’ concern
so that they didn’t have reasons to synchronize their
cropping calendars. WUAs were more exposed to the
risk of incurring damage stemming from water
shortage if water use timing of a WUA was the same
with upstream WUAs. Because of these differences,
Agent-Based Model Application for Resource Management Analysis
247

in the prior research two environmental factors
defined the water use behavior, and in the level of the
whole basins, the WUAs devised their way to adapt
to environmental changes. In our study, social and
environmental factors were mainly influential to
water use behavior, and adaptation methods were
developed only among the downstream WUAs.
Although exploring customary laws can reveal
factors of current conditions, it does not always let us
find solutions for problems or predict future
conditions. To examine customary laws on water use
we applied game theory. We supposed three values;
α, β and γ (0≥α>β>γ) showing negative impacts
and made a payoff table (Table 6). For Subak B
through Subak E, coordinating with other Subaks
took efforts and time to arrange water use, but the
restrained decline in rice production. On the contrary,
disarranging water use saved efforts and time but
caused a decline in rice production. From submissive
laws, we can see that for farmers decline in rice
production (=γ) is more serious damage than taking
efforts and time ( =β). In the case of Subak A,
coordinating with other Subaks did not benefit Subak
A nor increased rice production, but only took efforts
and time. However, uncoordinated water use with the
other Subaks yielded the same rice production as it
coordinated with the others and took none of the
efforts and time, too (=α). As Table 6 presents when
Subak A is uncooperative and Subak B through
Subak E are cooperative, they achieve Nash
equilibrium and Pareto optimality. It suggests that
with the current customary laws their water allocation
system not be changed and uncooperative water use
behavior of Subak A not change. This reveals that
focusing on one case study will not be enough to find
solutions. We can also see that predicting future
conditions should be difficult because future changes
of externalities cause changes in factors. Therefore, to
enhance sustainable resource management, we need
to understand what factors and their rules and/or laws
are useful to enhance the resilience and adaptability
of institutions. However, as prior researchers pointed,
although case studies have similarities, to employ
rules and/or laws found in other areas to solve
problems, we need to carefully tailor them to fit into
the target condition (
Mukherji et al., 2010). At this
point, digital technologies have the potential to
facilitate analysis.
Field research results suggested that labor force
also influences changes in cropping schedules. Hence,
considering rainfall and Saba intake weir inflow is
unlikely enough to conduct time series analysis at the
current stage of the model development. With further
development of digital technologies such as ABM,
Table 6: Payoff table between Subak A and Subak B
through Subak E.
Subak B through Subak E
Uncooperative Cooperative
Subak A
Uncooperative
(α, γ) (α, β)
Cooperative
(β, γ) (β, β)
analysis of time series and massive information in
resource management could be conducted. In our
study, we found that water resources were the main
factor of water users’ behavior, but other natural,
social and institutional factors also govern their
behavior. So far, factors could be divided into three
categories; irrigation facilities, cropping systems, and
institutions. Irrigation facilities are designed to
convey water supply using gravity so that they are
influenced by topographical features of an irrigated
area. For example, paddy field engineering in Japan
has been developed for more than 500 years, and
paddy field expansion reached physical limits (The
Japanese Society of Irrigation, Drainage and Rural
Engineering, 2010
). Cropping systems and cropping
patterns reflect preferences and strategies of farmers
to fit in natural conditions (Corselius et al., 2002 and
Dury et al., 2013). Institutions define rules for
collective resource use (Ostrom, 2005). This study
mainly focused on factors of institutions. To
understand and find out robust WUAs, factors in all
three categories are needed to consider together. If we
accumulate and analyze factors and their rules and/or
laws related to resource use in areas of both
developing and developed countries, we will be able
to grasp the nexus of factors. It will also help us
understand how a factor activates another factor(s)
and induce rules and/or laws. Understanding resource
use behavior in a factor level will enable us to
improve resource management by changing some
behavior in a more tailored manner. Applying the
method of this study to other agricultural resource
management needs further research. For instance,
agricultural land change may be more influenced by
economic change such as land price and market. In
such a case, economic models may need to be
incorporated into our method.
6 CONCLUSIONS
Recently, to improve food and water security, the
agriculture sector has attempted to systematize
agricultural management which currently mainly
relies on farmers’ experience. In addition to the
challenge, climate change and population growth
ICAART 2020 - 12th International Conference on Agents and Artificial Intelligence
248

have made resource management more severe. This
questions the sustainability of current resource use by
beneficiaries. The prior research shows that water use
behavior was subject to environmental factors under
limited water resources (Lansing and Kremer, 1993).
In consideration of tighter resource availability, it is
desirable to examine resource management behavior
of beneficiaries using scarce resources to analyze the
resilience and adaptability of institutions.
In our study, we studied irrigated rice farmers and
analyzed factors of water use behavior of water users’
associations in Bali, Subak, to solve the water
allocation problem. For analysis, we built ABM by
modifying Lansing and Kremer model and simulated
water use behavior. The ABM simulations show that
ABM can replicate annual changes in cropping
schedules which were found downstream WUAs, and
water resources and the existence of different water
use laws are the factors of water use behavior of
irrigators. Therefore, in the study area social and
environmental factors were influential to water use
behavior, and downstream WUAs developed
adaptation methods. Our study shows that digital
technologies such as ABM are useful to analyze
resource management behavior. To enhance
sustainable resource management, ABM also has the
potential to analyze factors and their rules and/or laws
to understand what enhance resilience and
adaptability of institutions. To understand and find
out robust WUAs, ABM needs to include more
factors related to such as irrigation facilities and
cropping systems.
REFERENCES
Corselius, K L., Simmons, S R., Flora, C B., 2003. Farmer
perspectives on cropping systems diversification in
northwestern Minnesota. Agriculture and Human
Values, 20, pp371-383.
Dury, J., Garcia, F., Reynaud, A., Bergez, J., 2013.
Cropping-plan decision-making on irrigated crop
farms: A spatio-temporal analysis. European Journal of
Agronomy, 50, pp1-10.
Geertz, C., 1980. Organization of the Balinese Subak. In
Irrigation and Agricultural Development in Asia:
Perspectives from the Social Sciences, Walter Coward
Jr., E (ed), Cornell University Press. New York, pp70-
90.
Lansing, J. S., Kremer, J.N., 1993. Emergent Properties of
Balinese Water Temple Networks: Coadaptation on a
Rugged Fitness Landscape. American Anthropologist,
New Series, 95 (1), pp97-114.
Mukherji, A., Fuleki, B., Shah, T., Suhardiman, D.,
Giordano, M., Weligamage, P., 2010. Irrigation reform
in Asia: A review of 108 cases of irrigation
management transfer. IWMI Research Reports
H042851, International Water Management Institute.
Nagano, Y., 2011. An Integrated System between Human
and Nature of an Irrigation Association (Subak) Bali,
Indonesia: A Case Study if Jatiluwih Village. Bulletin
of Senshu University school of human sciences,
Sociology, 2 (2), pp81-98.
Ostrom, E., 2005. Understanding Institutional Diversity,
Princeton University Press. Princeton.
Sembiring, H., Makarim, A. K., Abdulrachman, S.,
Widiarta, N., 2011. Current Status of Agricultural
Water Management in Indonesia. In GOI/ADB/OECD
International Workshop, Bogor Indonesia.
Suradisastra, K., Sejati. K. W., Supriatna, Y., Hidayat, D.,
2002. Institutional Description of the Balinese Subak.
Jurnal Litbang Pertanian, Vol. 21, No.1, pp11-18.
The Japanese Society of Irrigation, Drainage and Rural
Engineering (ed), 2010. Handbook of the Japanese
Society of Irrigation, Drainage and Rural Engineering,
JSIDRE. Tokyo, 7
th
edition.
Trendov, N. M., Varas, V., Zeng, M., 2019. Digital
technologies in agriculture and rural areas - Status
report. Rome. License: cc by-nc-sa 3.0 igo.
Agent-Based Model Application for Resource Management Analysis
249
