
Tactile Tile Detection Integrated with Ground Detection using an
RGB-Depth Sensor
Yutaro Yamanaka
1
, Eichi Takaya
2
and Satoshi Kurihara
2
1
Faculty of Science and Technology, Keio University, Yokohama, Japan
2
Graduate School of Science and Technology, Keio University, Yokohama, Japan
Keywords:
Industrial Applications of AI, Tactile Tile, Ground Detection, Visual Impairment.
Abstract:
Tactile paving is a system used to help visually impaired individuals walk safely. However, it is difficult to
recognize the surrounding tactile tiles on a first visit to an area. In this study, we propose a method for detecting
tactile tiles integrated with ground detection using an RGB-Depth sensor. For the ground detection, we use
the RANSAC algorithm and expand the region by using the breadth-first search. When detecting the tactile
tiles, we perform thresholding and construct a model to identify candidate areas. Experimental results showed
that the proposed method obtained a precision of about 83% in detecting tactile tiles on a paved asphalt road.
It was possible to correctly distinguish tactile tiles from other objects by combining ground detection in many
cases. On the other hand, there were many false detections of tactile tiles in challenging environments, and
the processing speed should be improved for real-time navigation.
1 INTRODUCTION
According to World Health Organization statistics
(World Health Organization, 2019), as of 2019, there
are 2.2 billion people around the world who have
some form of vision impairment or blindness. Gener-
ally, it is risky for visually impaired individuals to go
out alone. Therefore, a guide with professional quali-
fications is often asked to accompanythem. Neverthe-
less, they sometimes feel overburdened because they
have to worry about both their surroundings and the
labor of hiring the guide. Even when going out to un-
familiar places with a guide, they are concerned about
their surroundings and experience a lot of stress. For
such individuals, a tactile paving system is indispens-
able for walking safely. As they walk, they use a
white cane or the sole of the shoe to recognize the
protrusions on the surface of the tactile paving. This
system is used in many countries due to its useful-
ness in safely guiding visually impaired people. How-
ever, tactile paving has a problem in that the tiles can-
not be recognized unless the individual is standing on
them. Hence, it is difficult to search for surround-
ing tactile tiles in unfamiliar places. Simply installing
these tiles is not enough to ensure the safety of visu-
ally impaired individuals walking alone. Considering
the above, there is a need for a guide system that can
provide the visually impaired with information on the
surrounding environment, including tactile tiles. By
providing information for different environments and
helping with navigation, such a system will help them
go out safely and easily.
When detecting tactile tiles, two features must be
considered: color and shape. As the international
standard (ISO 23599, 2012) defines, the color of tac-
tile tiles is typically yellow, as this color is easy to
distinguish from paved asphalt roads. As for shape,
the surface of each tile is lined with linear protrusions
for guidance or point-like protrusions for calling at-
tention. A previous work proposed detecting tactile
tiles from images of the sidewalk by means of com-
puter vision algorithms (Ghilardi et al., 2016). Our
work extends this method so that it can be applied in
outdoor environments where multiple objects exist.
In any guide system for the visually impaired,
false detection is a very serious problem. For exam-
ple, if a tactile tile is falsely detected on a wall and
that navigation information is transmitted to the vi-
sually impaired, they will walk in that direction and
may actually collide with the wall. Generally, tac-
tile tiles are installed on flat ground. If a tactile tile
is detected at a location that is not estimated to be
flat ground in the image, the navigation information
should not be transmitted. We propose a method that
detects both tactile tiles and flat ground in parallel by
using an RGB-Depth sensor. Our contributions are
750
Yamanaka, Y., Takaya, E. and Kurihara, S.
Tactile Tile Detection Integrated with Ground Detection using an RGB-Depth Sensor.
DOI: 10.5220/0009092907500757
In Proceedings of the 12th International Conference on Agents and Artificial Intelligence (ICAART 2020) - Volume 2, pages 750-757
ISBN: 978-989-758-395-7; ISSN: 2184-433X
Copyright
c
2022 by SCITEPRESS – Science and Technology Publications, Lda. All rights reserved
summarized as follows.
• We detect tactile tiles in outdoor environments
where various objects exist.
• We reduce false detection of tactile tiles compared
to the case of detecting them in an entire image by
detecting flat ground and narrowing the detection
range.
• Processing time can be shortened compared to the
case of serial processing by executing two pro-
cesses in parallel: ground detection and tactile tile
detection.
2 RELATED WORK
Many approaches to the detection of specific objects
have been proposed for navigation systems used by
the visually impaired. In some approaches, the seg-
mentation of flat ground is performed using an RGB-
Depth sensor. Yang, Wang, Hu, and Bai proposed
a method to estimate normal vectors and extend re-
gions from depth information after detecting the plane
by using the RANSAC algorithm (Yang et al., 2016).
This method makes it possible to perform the navi-
gation by detecting areas where the visually impaired
can pass. The ground detection process in our work
draws on this technique. Caraiman et al. introduced a
method to detect specific objects such as doors, stairs,
and signs after completing the ground segmentation
(Caraiman et al., 2017).
Other approaches detect the tactile tiles from a
color image. Kassim et al. developed a method to
determine the types of protrusion on the surface of
a tactile tile by deriving the metric that represents
the geometrical characteristics of the figure (Kassim
et al., 2018). Jie, Xiaochi, and Zhigang detected the
straight lines of a tile by thresholding, edge detection,
and Hough transforming (Jie et al., 2010). Ghilardi,
Macedo, and Manssour proposed a method that de-
tects a tactile tile from sidewalk images using com-
puter vision algorithms and a decision tree (Ghilardi
et al., 2016). Our work extends these ideas for appli-
cation to outdoor environments where there are mul-
tiple objects besides tactile tiles.
Some approaches detect multiple objects simulta-
neously by semantic segmentation using a convolu-
tional neural network. Among these, a representative
example is a method by Yang et al. that detects ob-
jects such as sidewalks, stairs, and cars by means of a
unique model architecture (Yang et al., 2018). When
providing navigation for the visually impaired, it is
crucial to detect multiple objects simultaneously. In
our work, we also find semantic segmentation to be
effective for detecting multiple objects. However, we
need to devise additional approaches for objects such
as tactile tiles, where false detection can be a serious
problem.
3 PROPOSED METHOD
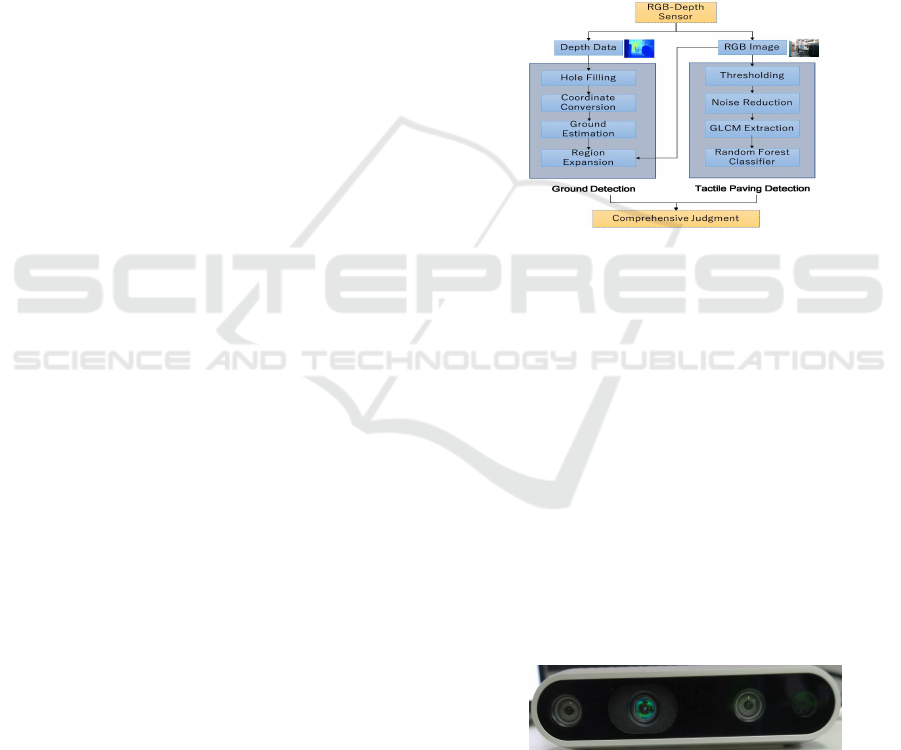
The flow chart of the proposed method is shown in
Figure 1. In this section, we describe the RGB-Depth
sensor we use for our experiment (Sec 3.1), ground
detection (Sec 3.2), tactile tile detection (Sec 3.3), and
the comprehensivejudgment for determining whether
tactile tiles do indeed exist (Sec 3.4).
Figure 1: Flow chart of proposed method.
3.1 RGB-Depth Sensor
We use the Intel RealSense Depth Camera D435i as
the RGB-Depth sensor (Figure 2). This is a stereo
vision camera that can measure depth. It is equipped
with two depth sensors, an RGB camera, and an active
IR projector that illuminates the object. It can also
acquire linear acceleration and angular velocity syn-
chronously with depth information, as it is equipped
with an inertial measurement unit (IMU). As shown in
Figure 3(b), there are some parts of the image where
the depth information is not obtained accurately due
to noise and lack of data. In this work, we remove
the noise and compensate for the lack of data by us-
ing the hole-filling filter that comes with RealSense
SDK. The effect of this filter is shown in Figure 3(c).
Figure 2: RealSense D435i.
3.2 Ground Detection
This subsection describes the coordinate conversion
(Sec 3.2.1), ground estimation (Sec 3.2.2), and esti-
mated region expansion (Sec 3.2.3) in detail.
Tactile Tile Detection Integrated with Ground Detection using an RGB-Depth Sensor
751
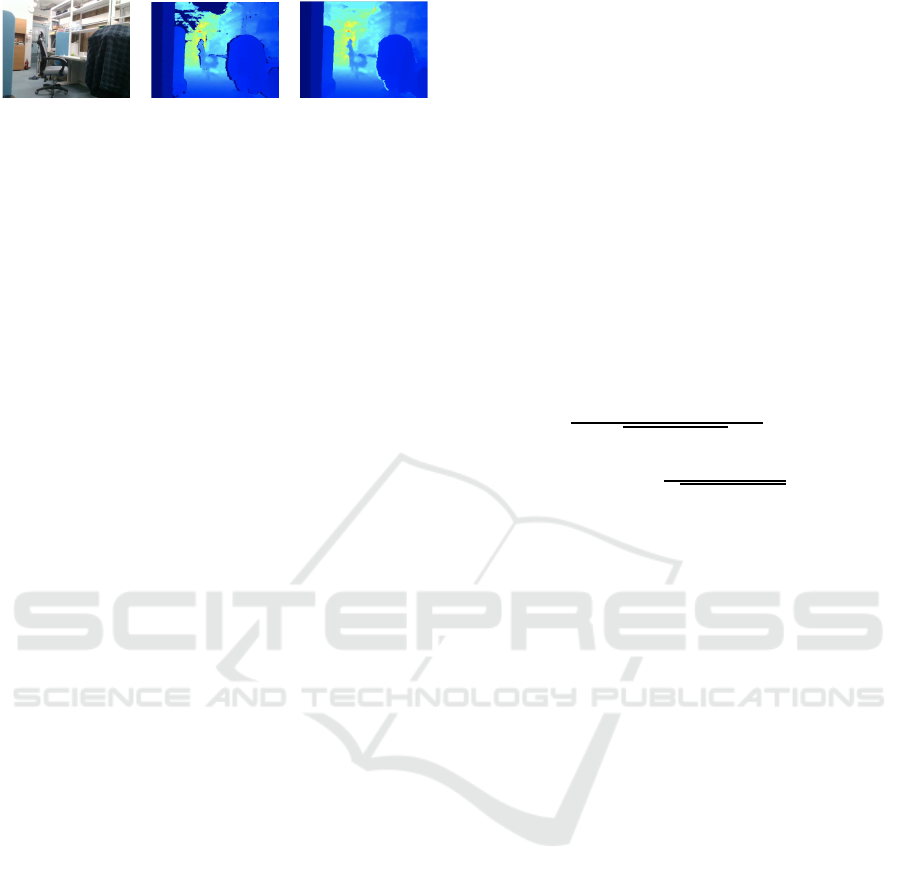
(a) (b) (c)
Figure 3: (a) Color image acquired by RGB camera (Re-
alSense D435i). (b) Original depth image. (c) Depth image
after applying hole-filling filter to (b).
3.2.1 Coordinate Conversion
We use a three-dimensional point cloud calculated
from the depth information to detect the ground. This
point cloud is acquired as coordinates in the camera
coordinate system, so we need to convert it to coor-
dinates in the global coordinate system. When con-
verting the coordinates, a rotation matrix based on
the attitude of the camera is required. We use the
quaternions to express the posture. The quaternions
are a four-dimensional vector that extends the com-
plex number, which is used to express the posture of
an object in 3D space. The quaternion q is shown in
Equation (1), where q
0
, q
1
, q
2
, and q
3
are real num-
bers, and i, j, and k are the basic quaternion units.
We use the Madgwick filter (Madgwick, 2010) to de-
rive the quaternions. According to Equation (2), the
point (X, Y, Z) in the camera coordinatesystem is con-
verted into the point (X
w
, Y
w
, Z
w
) in the global coordi-
nate system by using the quaternion q obtained by the
Madgwick filter (Diebel, 2006). In Equation (2), R is
equivalent to the rotation matrix.
q = q
0
+ q
1
i+ q
2
j+ q
3
k (1)
R =
q
2
0
+ q
2
1
−q
2
2
−q
2
3
2(q
1
q
2
−q
0
q
3
) 2(q
0
q
2
+ q
1
q
3
)
2(q
0
q
3
+ q
1
q
2
) q
2
0
−q
2
1
+ q
2
2
−q
2
3
2(−q
0
q
1
+ q
2
q
3
)
2(q
1
q
3
−q
0
q
2
) 2(q
2
q
3
+ q
0
q
1
) q
2
0
−q
2
1
−q
2
2
+ q
2
3
X
w
Y
w
Z
w
= R
X
Y
Z
(2)
3.2.2 Ground Estimation
We estimate the ground by using the random sam-
ple consensus (RANSAC) algorithm (Fischler and
Bolles, 1981), a robust estimation algorithm that con-
siders outliers in the given data and suppresses their
effects. RANSAC estimates the model parameters by
dividing a set of data into inliers (a set of data that the
model fits) and outliers (a set of data that the model
does not fit). The plane model of the point cloud in
the global coordinate is expressed in Equation (3) us-
ing four parameters A, B, C, and D. The condition to
be regarded as inliers is defined by Equation (4) and
consists of the threshold T for the distance between
the estimated plane and the point cloud. First, three
points are randomly selected from the point cloud.
Then, the parameter estimation is performed repeat-
edly by RANSAC. (See the work of Zeineldin and
El-Fishawy (Zeineldin and El-Fishawy, 2016) for a
detailed explanation of how the parameters are esti-
mated.) When the angle between the estimated plane
and the XY plane in Equation (5) is abnormally large,
(i.e., not considered to be the ground), we will return
the processing to the beginning of the loop to reduce
calculation time. In this way, ground with a small an-
gle between the XY plane is estimated. Figure 4(b)
depicts the estimated ground region.
AX
w
+ BY
w
+CZ
w
= D (3)
|AX
w
+ BY
w
+CZ
w
+ D|
√
A
2
+ B
2
+C
2
< T (4)
= arccos
|B|
√
A
2
+ B
2
+C
2
(5)
3.2.3 Estimated Region Expansion
As shown in Figure 4(b), only a part of the ground
is estimated by RANSAC. Hence, we need to ex-
pand the estimated region. In this work, we do this
by choosing seeds and performing the breadth-first
search. Algorithm (1) describes the details. First, sev-
eral points are randomly selected if two conditions are
satisfied: one, points belong to inliers in the model
estimation by RANSAC, and two, one or more four-
connected neighbors of them belong to outliers. Pix-
els of the color image corresponding to those points
are adopted as seeds S. If one of those pixels exists at
the outer edge of the color image, it is not adopted as
a seed. Then, the breadth-first search starts from the
first element of S, and the pixel visited in the search
is regarded as the ground. If a pixel meets at least one
of the following four conditions, we do not search fur-
ther from that pixel.
• The point in the point cloud corresponding to the
visited pixel p belongs to inliers.
• The visited pixel p has already been searched
• The difference between the hue h
p
of the visited
pixel p and the average hue h
avg
of pixels that
have corresponding points belonging to inliers is
greater than or equal to the threshold H.
• The visited pixel p is located at the Canny edge
(Harris et al., 1988) of the color image.
The search is repeated for all the elements in S.
The result of the estimated region expansion is shown
ICAART 2020 - 12th International Conference on Agents and Artificial Intelligence
752
in Figure 4(b) and 4(c), which depicts the expansion
of the region that is considered to be the ground.
Algorithm 1 : Region Expansion based on Breadth-First
Search.
Seeds S = [S
1
, ..., S
N
]
h
avg
= average hue value of inliers
for i = 1 to N do
Initialize Queue Q
Add S
i
to Q
while Q is not empty do
q = the first element of Q
Remove q from Q
for p = four-connected neighbors of q do
if p is not in the inliers and p is not visited
and |h
p
−h
avg
| < H and
p is not at the Canny edge of the image
then
Add p to Q
p ← visited
end if
end for
end while
end for
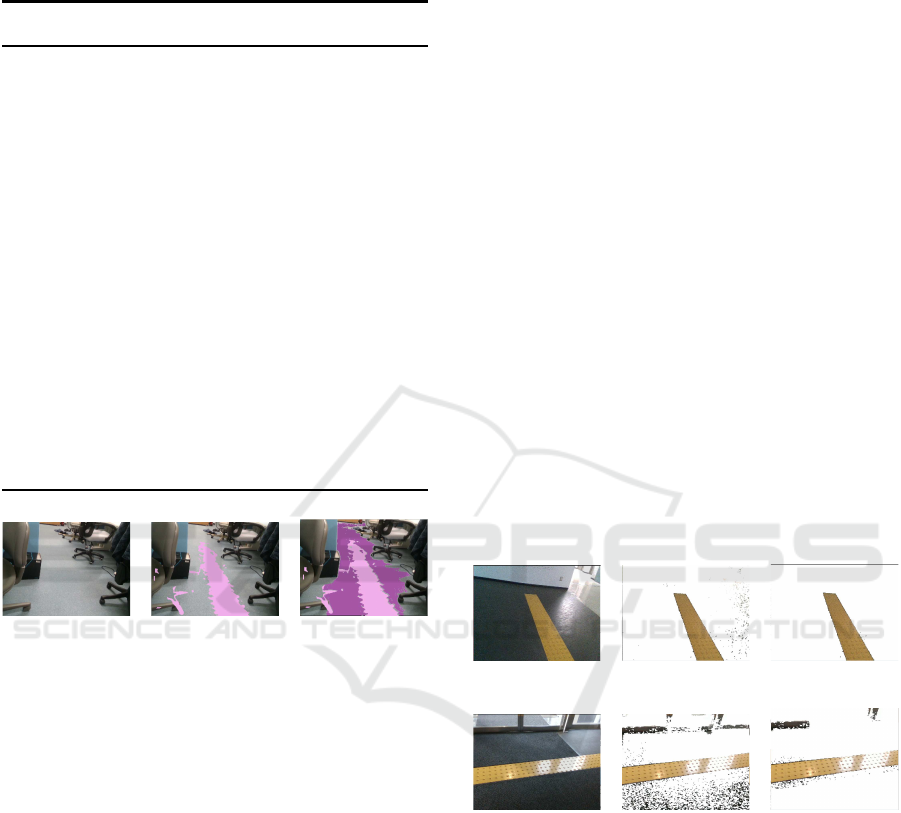
(a) (b) (c)
Figure 4: (a) Color image acquired by RGB camera (Re-
alSense D435i). (b) Region estimated to be ground by
RANSAC (pink). (c) Region added to (b) by expansion
(purple).
3.3 Tactile Tile Detection
This subsection describes the thresholding (Sec
3.3.1), noise reduction by DBSCAN clustering (Sec
3.3.2), and model construction by extracting features
(Sec 3.3.3) in detail.
3.3.1 Thresholding
From the viewpoint of visibility, the color of tactile
tiles is usually yellow. First, we convert the RGB im-
age into an image in the YCbCr color space, which
is robust to light conditions, as a previous work (Ghi-
lardi et al., 2016) showed. The YCbCr color space
expresses the color with the luminance (Y), the blue-
difference chroma (Cb) obtained by subtracting the
luminance from blue, and the red-difference chroma
(Cr) obtained by subtracting the luminance from red.
Thus, we can perform thresholding regardless of the
brightness of the image because the hue and bright-
ness are independent in the YCbCr color space. Sec-
ond, we create a histogram for Cb and Cr and perform
thresholding. Figure 5(b) and (e) shows the threshold-
ing results.
3.3.2 Noise Reduction
When candidate areas are detected by thresholding, a
small area is sometimes found, as indicated in Figure
5(b) and (e). Small areas like this are considered a
noise in the detection of tactile tiles because they ex-
ist in a large area of candidate areas. We reduce the
noise with DBSCAN clustering (Ester et al., 1996)
in the pixel coordinate system with the upper-left of
the image as the origin. Since DBSCAN clustering
is a density-based clustering method, which makes it
unnecessary to determine the number of clusters in
advance, it is robust against outliers. In the result of
DBSCAN clustering against remaining pixels as can-
didate areas, some pixels do not belong to any clus-
ters. These pixels are considered noise and are re-
moved. Figure 5(c) and (f) shows the result of noise
reduction. Identification after the noise reduction is
necessary because multiple clusters sometimes exist
as candidate areas in outdoor environments.
(a) (b) (c)
(d) (e) (f)
Figure 5: (a), (d) Color image acquired by RGB camera
(RealSense D435i). (b), (e) Color image including noise af-
ter thresholding. (c), (f) Denoised color image by DBSCAN
clustering, where one cluster in (c) and three clusters in (f)
exist as candidates areas.
3.3.3 Model Construction
The shape of the tactile paving surface is unique com-
pared with other objects in an outdoor environment.
Constructing a model that captures this feature is key
for determining whether or not a tactile tile exists in
a candidate area. We use a random forest classifier
(Breiman, 2001) based on a decision tree as the model
to judge its existence. The image texture features
Tactile Tile Detection Integrated with Ground Detection using an RGB-Depth Sensor
753
calculated from the gray-level co-occurrence matrix
(GLCM) are adopted as features of the model. First,
the GLCM is calculated for each offset defined by dif-
ferent distances and angles. Second, the image texture
features are acquired by extracting statistic informa-
tion from these GLCMs. In this work, we obtain them
through the following procedure.
1. Several pixels are chosen randomly from near the
center of one candidate area.
2. Twenty-five-pixel square images are cropped
from the original image (Figure 5(a) and (d))
around these pixels. These images are regarded
as patches
3. Steps 1 and 2 are repeated for each candidate area.
4. For each patch, the image texture features are ob-
tained by calculating the GLCM with the deter-
mined offsets.
Pixels are selected from near the center of candi-
date areas in step 1 so that we can create patches that
capture the major part of the candidate area. We use
three different distances (1, 2, and 3 pixels) and four
different angles (0, 45, 90, and 135 degrees) as an off-
set and extract six different statistic information, so
a total of 72 features are generated from each patch.
Then, we label these patches as to whether they con-
tain tactile tiles or not. Lastly, the learning of the
model is initiated.
3.4 Comprehensive Judgment
The calculation time to process ground detection and
tactile tile detection in series is long. If these two pro-
cesses are executed in parallel, we can reduce the cal-
culation time. In the result of parallel processing, we
obtain outputs of the ground detection and tactile tile
detection separately. Hence, it is necessary to make
a comprehensive judgment as to whether the tactile
tile does exist. In this study, we count the number of
patches if the following two conditions are satisfied.
• The model (Sec 3.3.3) prediction of the patch is
positive.
• The center of the patch is considered to be the
ground in the ground detection (Sec 3.2).
If this number is equal to or greater than a certain
percentage (P) of the number of patches in the area,
the candidate area is considered to be a tactile tile.
4 EXPERIMENTS
This section gives an overview of the experiments we
performed to evaluate the proposed method (Sec 4.1)
and reports the results for the effectiveness of incor-
porating ground detection processing (Sec 4.2), the
parallelism of the proposed method (Sec 4.3), and the
robustness to environments (Sec 4.4).
4.1 Overview of Experiment
To evaluate the proposed method, we performed the
following three experiments.
• Evaluation of the effectiveness of incorporating
ground detection (Sec 4.2).
• Evaluation of the parallelism of the proposed
method (Sec 4.3).
• Evaluation of the robustness to environments (Sec
4.4).
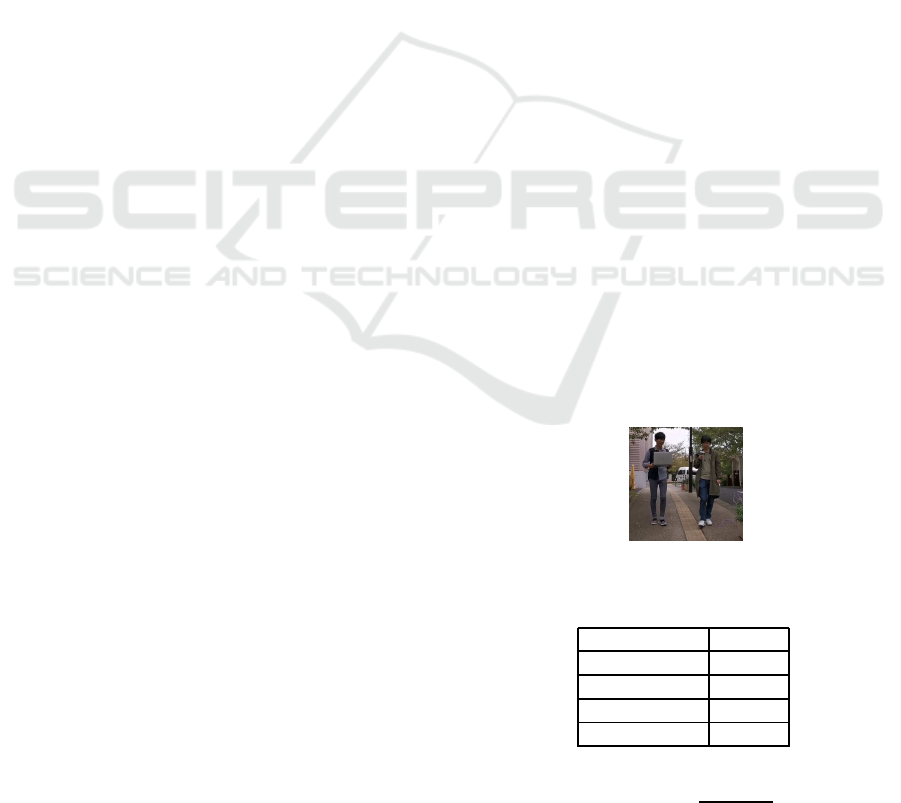
We held the RGB-Depth sensor at a height of
about 1.5 m from the ground surface using a hand-
held tripod. We tilted it from the horizontal at an an-
gle of about 45 degrees toward the ground. Figure
6 shows the experimental scene. We performed the
processing of the proposed method by a laptop com-
puter with an Intel Core i7 processor and 16GB of
memory. The parameter values are listed in Table 1
and we created five patches (See Sec 3.3.3) per candi-
date area. The identification results of candidate areas
are labeled as True Positive (TP), True Negative(TN),
False Positive (FP), or False Negative (FN).
Regarding an area that is not a tactile tile as pos-
itive (FP) is a serious problem. Therefore, the pre-
cision shown in Equation (6) is used to evaluate the
identification results.
Figure 6: Experimental scene in outdoor environment.
Table 1: Parameter values used in experiment.
T (Sec 3.2.2) 0.03 m
(Sec 3.2.2) 10
◦
N (Sec 3.2.3) 50
H (Sec 3.2.3) 20
P (Sec 3.4) 40 %
Precision =
TP
TP+ FP
(6)
ICAART 2020 - 12th International Conference on Agents and Artificial Intelligence
754

4.2 Effectiveness of Incorporating
Ground Detection
4.2.1 Experimental Design
To evaluate the effectiveness of incorporating ground
detection, we took videos with the RGB-Depth sensor
in the following two environments.
• Tactile tiles on a paved asphalt road in a sunny
area (measuring distance: about 200 m) (Env 1).
• Tactile tiles on a paved asphalt in a shaded area
(measuring distance: about 200 m) (Env ).
When identifying candidate areas in each frame,
we performed two operations simultaneously: nar-
rowing the detection range of tactile tiles incorporat-
ing ground detection, and detecting them from the en-
tire image. We examined the following four cases.
1. Detecting the ground and narrowing the detection
range of tactile tiles in Env 1 (Case 1).
2. Detecting tactile tiles from the entire image with-
out ground detection in Env 1 (Case 2).
3. Detecting the ground and narrowing the detection
range of tactile tiles in Env 2 (Case 3).
4. Detecting tactile tiles from the entire image with-
out ground detection in Env 2 (Case 4).
In Cases 2 and 4, only the first condition of the
comprehensive judgment (Sec 3.4) was valid. We cal-
culated the precision of the identification results and
compared them.
4.2.2 Results and Discussion
Table 2 lists the results of the candidate area iden-
tification for each of the four cases. As shown, the
precision was higher when ground detection was per-
formed in both Env 1 and Env 2. We conclude that
incorporating ground detection is effective for reduc-
ing false detections of tactile tiles.
Table 2: Effectiveness of ground detection.
Case TP FP FN TN Precision
1 171 31 155 164 0.8465
2 206 73 120 122 0.7384
3 95 20 183 398 0.8261
4 162 124 116 294 0.5664
4.3 Parallelism of Proposed Method
4.3.1 Experimental Design
In the proposed method, ground detection and tactile
tile detection are performed in parallel. To evaluate
the parallelism, we performed an experiment where
two processes are performed in series for comparison.
First, we excluded pixels that were not considered
ground in the ground detection (Sec 3.2). Second, we
performed tactile tile detection (Sec 3.3) on the re-
maining pixels. As a result, two processes were per-
formed sequentially. We took videos with the RGB-
Depth sensor in Env 1. For these two cases, we calcu-
lated the average processing time per frame and com-
pared it.
4.3.2 Results and Discussion
Table 3 lists the average processing time per frame for
these two experiments. As shown, the processing time
per frame can be shortened by processing in parallel.
Table 3: Evaluation of parallel processing.
Type Processing time per frame
Serial 1.5904 sec
Parallel 1.4832 sec
4.4 Robustness to Environments
4.4.1 Experimental Design
We investigated whether the proposed method can be
applied in various environments. We took videos with
the RGB-Depth sensor in Env 1, Env 2, and the fol-
lowing three environments.
• Tactile tiles with a small luminance ratio with the
road (measuring distance: about 80 m) (Env ).
• Tactile tiles on a tiled sidewalk (measuring dis-
tance: about 80 m) (Env 4).
• A tiled sidewalk with no tactile tiles (measuring
distance: about 80 m) (Env 5).
For each environment, we calculated the precision
of identification results and compared them.
4.4.2 Results and Discussion
Table 4 lists the identification results of candidate ar-
eas in various environments. Figure 7 shows the re-
sults of tactile tile detection by the proposed method,
where green and blue boxes indicate positive and neg-
ative patches by comprehensive judgment (Sec 3.4),
respectively. As Figure 7(a)-(c) shows, the candidate
Tactile Tile Detection Integrated with Ground Detection using an RGB-Depth Sensor
755
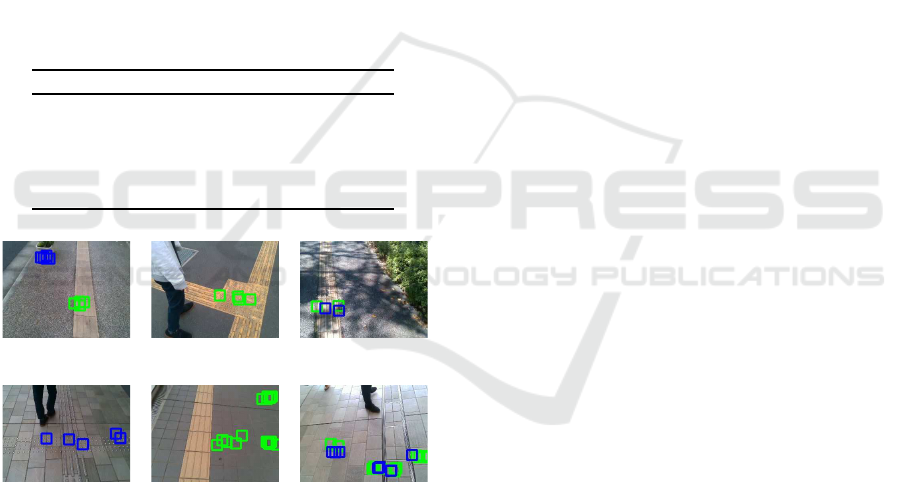
area was identified relatively accurately, and the pre-
cision was high: 84.7% in Env 1 and 82.6% in Env 2.
In contrast, as Figure 7(d)-(f) shows, there were many
false detections of tactile tiles in Env 3, Env 4, and
Env 5, and the precision was low.
As mentioned in the international standard (ISO
23599, 2012), the tactile tile should have a high lu-
minance ratio with the road. The tactile tile in Env 3
did not follow this standard. It seems that these tac-
tile tiles were not detected correctly because the pro-
posed method expected them to follow the standard.
In Env 4 and Env 5, we presume that tiled sidewalks
were the problem; specifically, the shape of the tiles
on the sidewalks was similar to the surface of the tac-
tile tiles for guidance. We also think that most of the
pixels remained due to the tile color after threshold-
ing. Furthermore, the model prediction probably gave
false positives because the training data lacked data
that had negative labels of the tiles on the sidewalks.
Table 4: Identification results in each environment.
Env TP FP FN TN Precision
1 171 31 155 164 0.8465
2 95 20 183 398 0.8261
3 20 37 59 12 0.3509
4 22 37 12 95 0.3729
5 0 39 0 47 0
(a) (b) (c)
(d) (e) (f)
Figure 7: Detection results in each environment. (a), (b)
Env 1. (c) Env 2. (d) Env 3. (e) Env 4. (f) Env 5.
5 CONCLUSIONS
In this paper, we have proposed a method of detect-
ing ground and tactile tiles in parallel by means of
an RGB-Depth sensor to provide information on the
surrounding tactile tiles to the visually impaired. Ex-
perimental results showed that the proposed method
obtained the precision of about 83% on a paved as-
phalt road.
In future work, we aim to improve the detection
performance of the model and the real-time perfor-
mance of the processing. Moreover, it is vital to de-
vise an actual navigation method. To improve the de-
tection performance, we will use pictures of tactile
tiles in various environments as training data for the
model. Also, although we shortened the processing
time by parallel processing in this study, the speed
was insufficient for real-time navigation. Therefore,
we will optimize the processing or consider another
faster method. Lastly, the information derived from
the detection results should be conveyed to the visu-
ally impaired through voice and so on. This required
information includes the direction and distance of tac-
tile tiles from the current standing point. For the dis-
tance, the depth information acquired by the RGB-
Depth sensor should be useful. We will examine a
concrete navigation method and develop a prototype
that incorporates an RGB-Depth sensor.
REFERENCES
Breiman, L. (2001). Random forests. Machine learning,
45(1):5–32.
Caraiman, S., Morar, A., Owczarek, M., Burlacu, A.,
Rzeszotarski, D., Botezatu, N., Herghelegiu, P.,
Moldoveanu, F., Strumillo, P., and Moldoveanu, A.
(2017). Computer vision for the visually impaired: the
sound of vision system. In Proceedings of the IEEE
International Conference on Computer Vision, pages
1480–1489.
Diebel, J. (2006). Representing attitude: Euler angles,
unit quaternions, and rotation vectors. Matrix, 58(15-
16):1–35.
Ester, M., Kriegel, H.-P., Sander, J., Xu, X., et al. (1996).
A density-based algorithm for discovering clusters in
large spatial databases with noise. In Kdd, volume 96,
pages 226–231.
Fischler, M. A. and Bolles, R. C. (1981). Random sample
consensus: a paradigm for model fitting with appli-
cations to image analysis and automated cartography.
Communications of the ACM, 24(6):381–395.
Ghilardi, M. C., Macedo, R. C., and Manssour, I. H. (2016).
A new approach for automatic detection of tactile
paving surfaces in sidewalks. Procedia computer sci-
ence, 80:662–672.
Harris, C. G., Stephens, M., et al. (1988). A combined cor-
ner and edge detector. In Alvey vision conference, vol-
ume 15, pages 10–5244. Citeseer.
ISO 23599 (2012). Assistive products for blind and vision-
impaired persons - Tactile walking surface indicators.
Jie, X., Xiaochi, W., and Zhigang, F. (2010). Research
and implementation of blind sidewalk detection in
portable eta system. In 2010 International Forum on
Information Technology and Applications, volume 2,
pages 431–434. IEEE.
ICAART 2020 - 12th International Conference on Agents and Artificial Intelligence
756

Kassim, A. B. M., Yasuno, T., Suzuki, H., Aras, M. S. M.,
Shukor, A. Z., Jaafar, H. I., and Jafar, F. A. (2018).
Vision-based tactile paving detection method in navi-
gation systems for visually impaired persons. In Ad-
vances in Human and Machine Navigation Systems.
IntechOpen.
Madgwick, S. (2010). An efficient orientation filter for in-
ertial and inertial/magnetic sensor arrays. Report x-io
and University of Bristol (UK), 25:113–118.
World Health Organization (2019). Fact sheet blindness
and vision impairment. https://www.who.int/news-
room/fact-sheets/detail/blindness-and-visual-
impairment.
Yang, K., Wang, K., Bergasa, L., Romera, E., Hu, W., Sun,
D., Sun, J., Cheng, R., Chen, T., and L´opez, E. (2018).
Unifying terrain awareness for the visually impaired
through real-time semantic segmentation. Sensors,
18(5):1506.
Yang, K., Wang, K., Hu, W., and Bai, J. (2016). Expanding
the detection of traversable area with realsense for the
visually impaired. Sensors, 16(11):1954.
Zeineldin, R. A. and El-Fishawy, N. A. (2016). Fast and
accurate ground plane detection for the visually im-
paired from 3d organized point clouds. In 2016 SAI
Computing Conference (SAI), pages 373–379. IEEE.
Tactile Tile Detection Integrated with Ground Detection using an RGB-Depth Sensor
757
