
Impact of Task-evoked Mental Workloads on Oculo-motor Indices
during a Manipulation Task
Minoru Nakayama
1 a
and Yoshiya Hayakawa
2
1
Information and Communications Engineering, Tokyo Institute of Technology, Japan
2
Mechanical Engineering, Tokyo Institute of Technology, Japan
Keywords:
Interface Recognition, Mental Workload, Eye Movement, Microsaccade, Causal Relationship.
Abstract:
Oculo-motor metrics which included metrics of microsaccades were analysed in response to the level of cogni-
tive mental workload during a manipulation task. While some oculo-motor metrics correlate with the estimated
scores of the mental workload, these metrics mutually correlate with each other. A model of causal relation-
ship was created using all metrics, including subjective measurements. Metrics of microsaccades perform the
function of intermediating behaviour between participant’s subjective assessments and conventional ocular
measurements, such as saccades and pupil responses.
1 INTRODUCTION
The design of an operational interface helps users to
be able to manipulate the underlying system using
peripheral devices, in order to develop better con-
trols. Eye tracking techniques have been introduced
to evaluate human mental workloads in order to im-
prove the manipulation interfaces and address envi-
ronmental issues, as some studies using eye move-
ments have already been conducted in the field of
aviation (Ziv, 2016; Peiß et al., 2018). While oculo-
motor indices have been employed to evaluate system
usability for operational interfaces (Nakayama and
Katsukura, 2011), metrics of microsaccades (MSs)
have often been used recently, as they reflect the level
of task difficulty or a higher order cognitive process
(Dalmaso et al., 2017; Kohama et al., 2017; Krejtz
et al., 2018). Therefore, various indices of eye move-
ments and pupil responses can be applied to eval-
uate mental workloads, and these indices also have
some relationships between themselves, because the
responses are based on a common system. The po-
tential for assessment using MSs is recognised, and
the details of the behaviour of MS have been studied
using various approaches.
A mechanism for stimulating the appearance of
MSs was discussed in a previous study (Engbert,
2006), and the mutual relationships between the met-
rics of oculo-motors were also discussed (Nakayama
a
https://orcid.org/0000-0001-5563-6901
and Hayakawa, 2019). A detailed analysis of
these mutual relationships during a manipulation task
should be conducted carefully. In this paper, all met-
rics are re-analysed and their contributions to each
other considered in comparison with the previous re-
port (Nakayama and Hayakawa, 2019). In particular,
detailed features of MSs have been introduced, and
the contributions of these are additionally analysed.
For this purpose, the following topics are ad-
dressed.
1. The relationships between recognised mental
workloads and metrics of eye activity, such as mi-
crosaccades, saccades, and pupil reactions are ex-
amined.
2. The causal relationships between recognised men-
tal workloads and metrics of eye activity are anal-
ysed.
2 METHOD
2.1 Experiment Overview
2.1.1 Experimental Tasks
In order to control the level of cognitive workload dur-
ing a task, a black box interface (Furuta et al., 1993)
for the manipulation of an object on a PC monitor was
developed, as shown in Figure 1.
274
Nakayama, M. and Hayakawa, Y.
Impact of Task-evoked Mental Workloads on Oculo-motor Indices during a Manipulation Task.
DOI: 10.5220/0009091502740279
In Proceedings of the 13th International Joint Conference on Biomedical Engineering Systems and Technologies (BIOSTEC 2020) - Volume 4: BIOSIGNALS, pages 274-279
ISBN: 978-989-758-398-8; ISSN: 2184-4305
Copyright
c
2022 by SCITEPRESS – Science and Technology Publications, Lda. All rights reserved
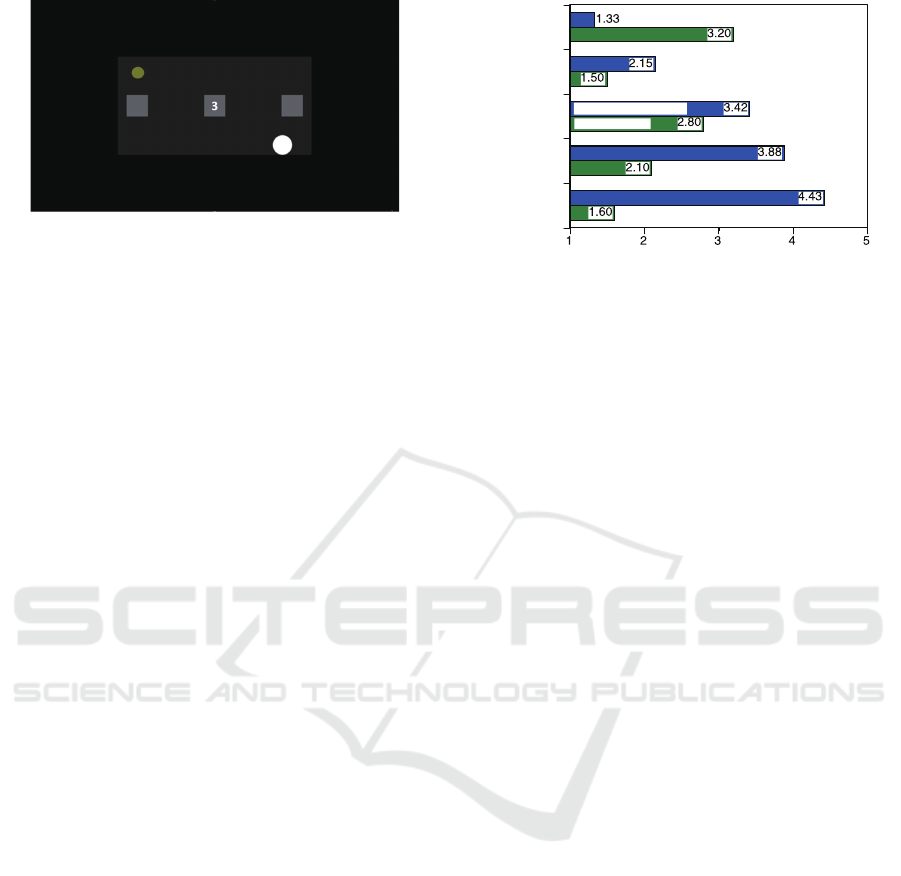
Figure 1: A screen-shot of the manipulation task.
The task is to move a disc (the small yellow disc)
to the goal (the white circle) as fast as possible, us-
ing the four arrow keys of a keyboard. Task difficulty
consisted of three cube obstacles, which were located
in the centre of the display, along the path between
the initial position and the goal position, as shown in
Figure 1. As a penalty, the disc returned to its starting
position whenever it touched an obstacle while being
moved.
2.1.2 Manipulation Conditions
The 5 conditions that the black box interface modifies
are manipulations of keys, as follows:
1. Output 1: The disc moved smoothly at a speed
people felt comfortable with, which was deter-
mined during the preparation experiments (Nor-
mal condition).
2. Output 2: The key response speed was reduced to
1/4 of the speed in Output 1.
3. Output 3: The key response speed was increased
to 4 times the speed in Output 1.
4. Output 4: The direction of the key manipulation
was rotated 45 degrees.
5. Output 5: Key assignments and direction of
movement were randomised.
For each condition, the task duration was 10 sec-
onds, and two sets of trials using the 5 randomised
conditions were conducted as a repeated-measure ex-
periment design. The mean durations of the manip-
ulation tasks were below 10 seconds, although the
“Output 1” condition required around 5 seconds.
2.1.3 Participants
Participants were 10 male university students aged
21-25 years old who had sufficient visual acuity. Be-
fore the experiment, participants gave their informed
written consent after a short description of the aims of
the experiment.
F1: Mental workload
F2: Fulfilment
Factor score
Manipulation tasks
Output 1
Output 2
Output 3
Output 4
Output 5
Figure 2: Factor scores for experimental conditions.
2.2 Subjective Assessment of the Task
Participant’s overall impressions of their manipulat-
ing the directional keys during the 5 conditions were
measured using the 5-point scale of an assessment in-
ventory which consisted of seven questions that rated
aspects such as “difficulty”, “being in a hurry”, “un-
pleasant”, “unusable”, “fulfilment”, “irritating” and
“mental workload” (Mizushina et al., 2011).
Two factors such as “Mental workload” (Factor 1)
and “Fulfilment” (Factor 2) have been extracted us-
ing factor analysis (Nakayama and Hayakawa, 2019),
and the mean factor scores are summarised in Figure
2. Since factor scores for “Mental workload” increase
with the levels of difficulty of the five experimen-
tal conditions, participants recognised the difficulty
of the tasks (Nakayama and Hayakawa, 2019). The
other factor scores for “Fulfilment” almost always de-
creases as the difficulty of the experimental condition
increases, and the two factor scores negatively corre-
late with each other.
2.3 Oculo-motor Measurement
The stimulus was presented on a 27 inch LCD mon-
itor which was 40cm from the viewer. Both eye
movements and pupil diameters were measured at
400Hz (Arrington Research: Viewpoint EyeTracker
USB400).
In response to manipulation tasks, the following
metrics were re-analysed (Nakayama and Hayakawa,
2019).
• Microsaccades (MSs) were extracted using a
piece of microsaccade detection software (Mi-
crosaccade Toolbox 0.9 (Engbert et al., 2015)),
and frequency, peak velocities, amplitudes and
durations of MSs were compared.
• Saccade frequencies and amplitudes were ex-
tracted from eye fixations using a threshold of
Impact of Task-evoked Mental Workloads on Oculo-motor Indices during a Manipulation Task
275
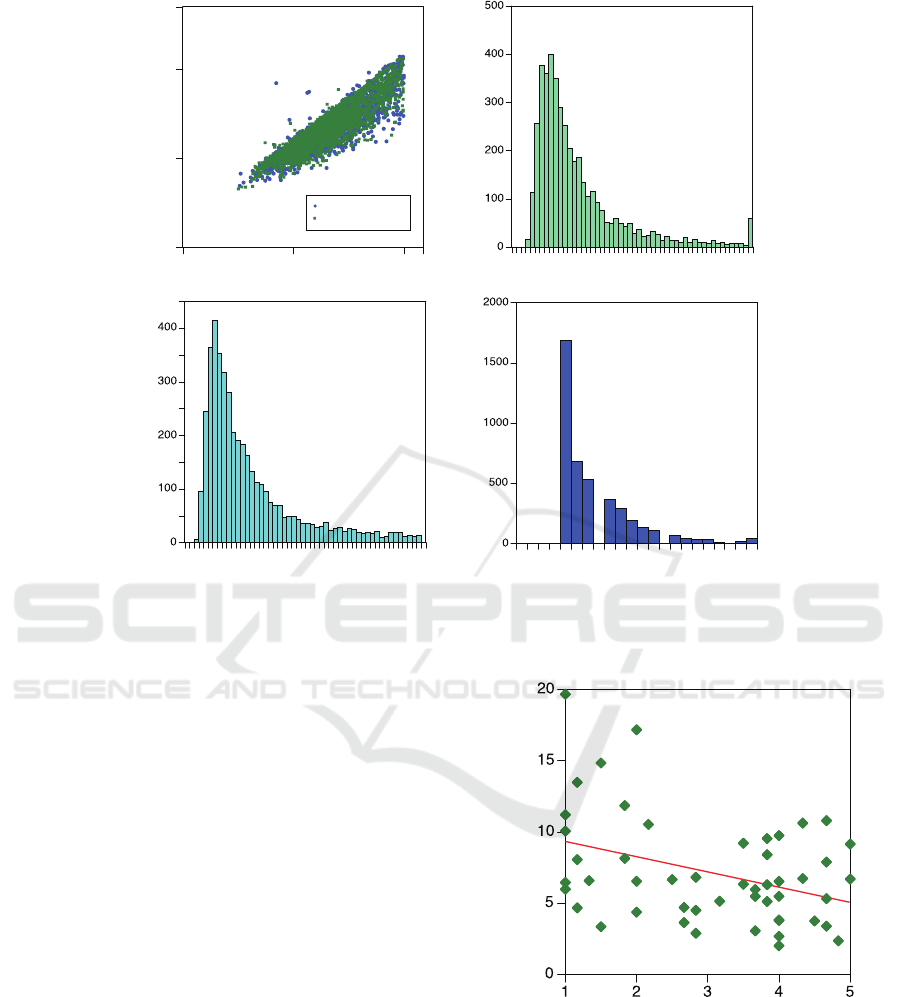
Amplitude (deg)
10 0.5
Frequency
100
Velocity (deg/sec.)
0 50
Frequency
10 20 30
Duration (msec.)
400
Frequency
(a) (b)
(c) (d)
10
1
10
2
Velocity (deg/sec.)
Amplitude (deg)
0
10
-1
10
0
10
-2
First trial set
Second trial set
Figure 3: Characteristics of observed microsaccades: (a) relationship between amplitudes and velocities, histograms for (b)
peak velocity, (c) amplitude, and (d) duration.
40deg/s (Ebisawa and Sugiura, 1998; Andersson
et al., 2017).
• Mean pupil size and power spectral of density
(PSD) for pupillary oscillations were also calcu-
lated (Nakayama and Shimizu, 2004; Nakayama
and Katsukura, 2011).
3 RESULTS
3.1 Oculo-motor Indices
3.1.1 MS Characteristics
Features of MSs during manipulation tasks are sum-
marised in Figure 3, using the same format as in the
previous study (Engbert, 2006). As the overall ten-
dency is similar to the reported results, the appropri-
ate MSs may be extracted. In Figure 3 (a), the data
in the two sets of trials are illustrated similarly, and
the repetition of the measure may not influence the
behaviours of MS.
Factor score (F1)
Saccade frequency
Figure 4: Relationship between factor score as subjective
evaluation (Factor1) and saccade frequency (r = −0.37).
3.1.2 Relationship between Oculo-motor Indices
To evaluate the effect of the experimental conditions,
all metrics of every trial are summarised (N=50: 10
subject × 5 conditions).
The influence of the manipulation of the condi-
BIOSIGNALS 2020 - 13th International Conference on Bio-inspired Systems and Signal Processing
276
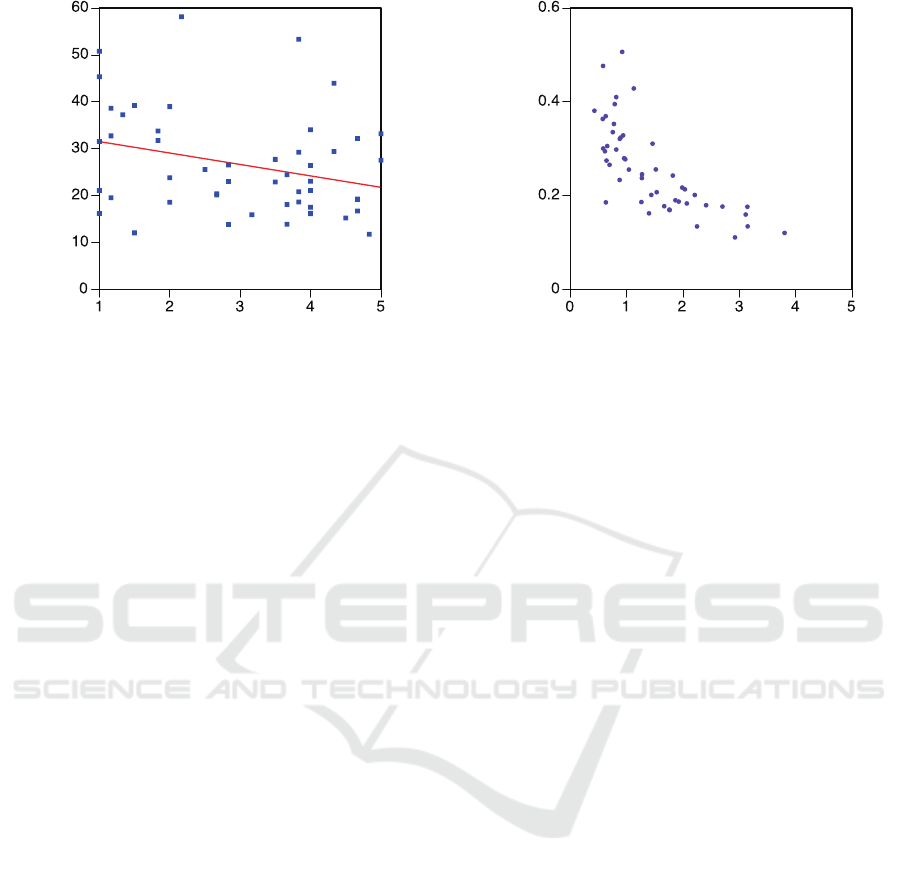
Factor score (F1)
MS Peak Velocity (deg/sec.)
Figure 5: Relationship between factor score as subjective
evaluation (Factor1) and peak velocity of micro saccade
(r = −0.29).
tions on oculo-motors were examined using One-way
ANOVA . However, the contributions of the condi-
tions to the metrics are few, including to the sac-
cades and pupil responses. On the other hand, some
metrics correlate with the factor scores for “Mental
workload”. Figure 4 represents a scattergram between
the factor scores and saccade frequency (r = −0.37,
p < 0.01), and Figure 5 represents the relationship be-
tween the factor scores and the peak velocity of MS
(r = −0.29, p < 0.05). Also, the deviations in pupil
diameters correlate with the factor scores.
The above results suggest that oculo-motor in-
dices correlate with the factor scores for “Mental
workload”, though the manipulation of the condi-
tions showed few contributions. As participants rated
scales based on their individual impressions in re-
sponse to their own oculo-motor reactions, the rela-
tionships emphasised these associations.
3.2 Causal Analysis between Observed
Metrics
In the above analyses, the impact of the experimen-
tal conditions and the subjective assessments of men-
tal workloads on ocular indices were examined. The
observed metrics are definitely correlated with each
other. For example, there is a relationship between
the saccade amplitude and the amplitude of the MS,
as shown in Figure 6. There is a significant correla-
tion (r = −0.73, p < 0.01). During the trial session,
the saccade amplitude negatively correlated with the
frequency of saccades (r = −0.71, p < 0.01), and the
saccade metrics significantly correlated with peak ve-
locities and amplitudes of MSs, while both peak ve-
locities and amplitudes of MSs correlated with each
Mean amplitude of MS (deg)
Saccade amplitude (deg)
Figure 6: Relationship between amplitudes of saccades and
micro saccades (r = −0.71).
other.
In regards to the relationships between the ob-
served metrics, overall relationships such as causal
relationships are considered step by step, on trial and
error basis. In order to illustrate these mutual relation-
ships, a structural equation modeling technique was
introduced (Toyoda, 2007). All parameters were esti-
mated using AMOS packages (Toyoda, 2007), and the
model of fitness was evaluated using a GFI (goodness
of fit index).
An optimised model, from subjective evaluation
to oculo-motor indices, is created using the procedure
explained above as shown in Figure 7. Path coef-
ficients are indicated using path arrow lines as path
connections between the variables of the first and the
second sets of trials. In regards to the results of the op-
timisation, the GFI is 0.91, thus this path model is an
acceptable model (RMSEA: Root Mean Square Error
of Approximation < 0.05). In this figure, the differ-
ences in path coefficients of the two sets are compared
statistically. The coefficients of the three paths be-
tween two sets are significantly different (p < 0.05).
These paths are indicated as blue paths in Figure 7.
The structure of the model suggests that factor
scores directly affect the indices of MS and the fre-
quency of saccades, and that indices of MS are mu-
tually related. Finally, subjective impression affects
both saccades and pupil responses due to MS be-
haviours. Relationships between MS indices and the
amplitude of saccades and pupil sizes deviated be-
cause there are significant differences between the
three path coefficients, although the relationships be-
tween features of MSs are stable.
Impact of Task-evoked Mental Workloads on Oculo-motor Indices during a Manipulation Task
277
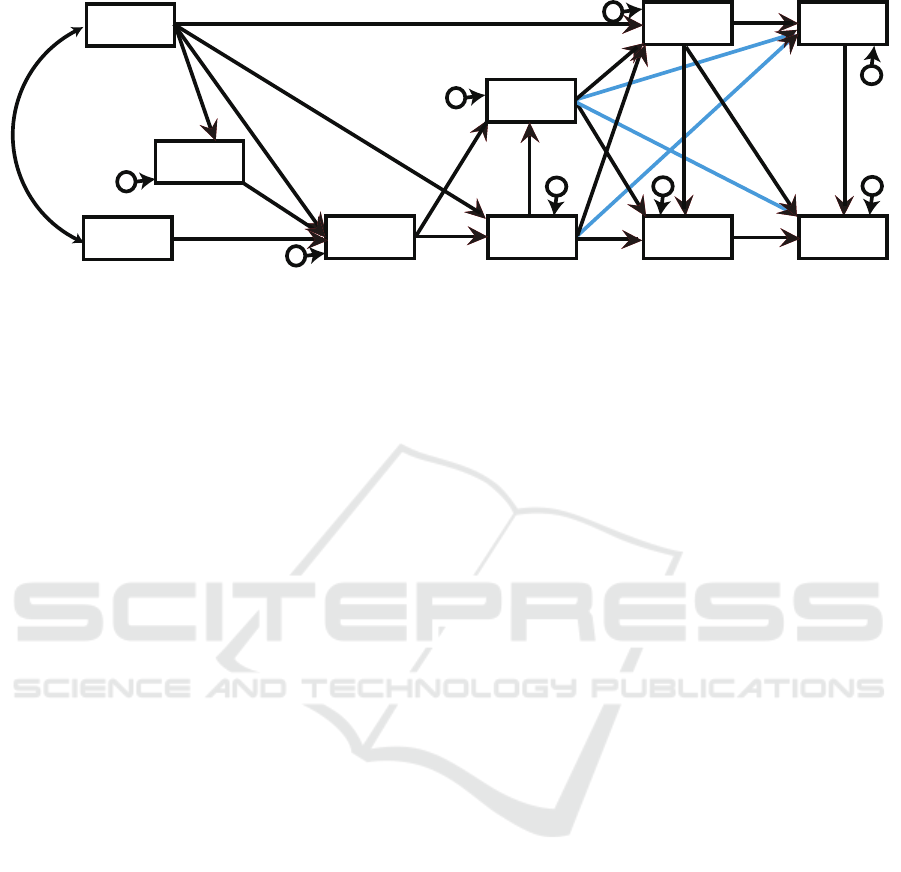
G
F
I=0.91, AG
F
I=0.79, R
MSEA=0.
04
-.33
-.24 / -.03
e
e
-.23 / -.10
e
0.28 / 0.19
0.19 / 0.31
-.11 / -.29
0.14 /
0.20
e
-.24 / -.31
-.24 / -.19
1.45 / 0.33
-.32 / -.06
-.05 / 0.45
0.23 / -.18
1.01 / 1.01
-.42 / -.10
-1.74 / -.04
1.36 / -.58
-1.50 / -.05
2.01 / 0.95
-.62
/ -.29
0.51 / -.51
e
-.29 / -.16
e
e
e
Fulfillment
Pupil PSD
[0.8-2.3Hz]
Mental
workload
Frequency
of MS
Duration
of MS
Peak Velocity
of MS
Amplitude
of MS
Frequency
of saccade
Amplitude
of saccade
Pupil size
Figure 7: Causal relationships between observed variables. The “e” nodes indicate residual term. Path coefficients are
indicated for the first and the second sets of trials as shown as the “first/second” format. Blue causal paths indicate that
there are significant difference in two path coefficients between two trial sets (p < 0.05). The model is validated in regards
to the statistical indices of GFI(Goodness of Fit Index), AGFI(Adjusted GFI), and RMSEA(Root Mean Square Error of
Approximation) as displayed above.
4 DISCUSSION AND SUMMARY
The conditions in a visual experiment with varying
levels of mental workload resulted in behaviour re-
sponses which were measured and analysed. Though
the participant’s subjective assessments are well con-
trolled by the different task manipulation conditions,
the eye metrics may reflect the mental states of the
participants. Individual differences in these metrics
and in the impacts of the experimental conditions may
affect the associations in these relationships.
As ocular motor indices, microsaccades and ordi-
nary eye behaviour correlate significantly with mental
workload. Therefore, the possibility that oculo-motor
metrics can be an index of cognitive mental workload
was examined.
A causal connection between these metrics, which
are based on mutual relationships, was established us-
ing a structural equation modeling technique. A sta-
tistically significant model suggests that metrics of
MSs between subjective impressions and ordinary eye
behaviour, such as saccades and pupil responses, are
correlated. Some previous studies have suggested that
MSs reflect the internal activity of human information
processing (Engbert and Kliegl, 2003; Meyberg et al.,
2017). In particular, Engbert has suggested that the
superior colliculus (SC) of the human brain, which
is concerned with pupil response and eye movement,
including saccades, plays a major role in generating
MSs during information processing (Engbert, 2006).
As this experiment employed a repeated-measure
design, participants might have become familiar with
the manipulation tasks. During the causal analysis,
path coefficients between two sets of trials were com-
pared. Three coefficients for saccades and pupil size
changed significantly, but all coefficients between
MS metrics remained comparably similar. This phe-
nomenon may illustrate the stability of metrics of
MSs.
The detailed relationships between these metrics
should be examined once more. Also, the subjective
assessment should employ more robust metrics in or-
der to better evaluate mental workload. These points
will be topics of our further study.
ACKNOWLEDGEMENT
This research was partially supported by the Japan
Society for the Promotion of Science (JSPS), Grant-
in-Aid for Scientific Research (KAKEN, 17H00825:
2017-2019).
REFERENCES
Andersson, R., Larsson, L., Holmqvist, K., Stridh, M., and
Nystr
¨
om, M. (2017). One algorithm to rule them all?
An evaluation and discussion of ten eye movement
event-detection algorithms. Behavior Research Meth-
ods, 49(2):616–637.
Dalmaso, M., Castelli, L., Scatturin, P., and Galfano, G.
(2017). Working memory load modulates microsac-
cadic rate. Journal of Vision, 17(3):1–12.
BIOSIGNALS 2020 - 13th International Conference on Bio-inspired Systems and Signal Processing
278

Ebisawa, Y. and Sugiura, M. (1998). Influences of target
and fixation point conditions on characteristics of vi-
sually guided voluntary saccade. The Journal of the
Institute of Image Information and Television Engi-
neers, 52(11):1730–1737.
Engbert, R. (2006). Microsaccades: a microcosm for re-
search on oculomotor control, attention, and visual
perception. Progress in Brain Research, 154:177–192.
Engbert, R. and Kliegl, R. (2003). Microsaccades uncover
the orientation of covert attention. Vision Research,
43:1035–1045.
Engbert, R., Sinn, P., Mergenthaler, K., and Truken-
brod, H. (2015). Microsaccade toolbox 0.9.
http://read.psych.uni-potsdam.de.
Furuta, T., Ishikawa, H., Toyama, N., Suzuki, H., and
Sakamoto, T. (1993). Effects of instruction in de-
vice operation learning. IEICE Transactions, J76–D–
II(9):2031–2041.
Kohama, T., Nakai, Y., Ohtani, S., Yamamoto, M., Ueda,
S., and Yoshida, H. (2017). Quantitative compari-
son of cognitive load derived from voice or manual
responses based on microsaccade rate analysis. The
Transactions of Human Interface Society, 19(2):189–
197.
Krejtz, K., Duchowski, A. T., Niedzielska, A., Biele, C.,
and Krejtz, I. (2018). Eye tracking cognitive load us-
ing pupil diameter and microsaccades with fixed gaze.
PloS One, 13:1–23.
Meyberg, S., Sinn, P., Engbert, R., and Sommer, W. (2017).
Revising the link between microsaccades and the spa-
tial cueing of voluntary attention. Vision Research,
133:47–60.
Mizushina, H., Sakamoto, K., and Kaneko, H. (2011).
The relationship between psychlogical stress induced
by task workload and dynamic characteristics of sac-
cadic eye movements. IEICE Transactions, J94–
D(10):1640–1651.
Nakayama, M. and Hayakawa, Y. (2019). Relationships
between oculo-motor measures as task-evoked mental
workloads during a manupulation task. In 23rd Inter-
national Conference Information Visualisation (IV),
pages 170–174.
Nakayama, M. and Katsukura, M. (2011). Development of
a system usability assessment procedure using oculo-
motors for input operation. Universal Access in Infor-
mation Society, 10(1):51–68.
Nakayama, M. and Shimizu, Y. (2004). Frequency analysis
of task evoked pupillary response and eye-movement.
In Spencer, S. N., editor, Eye-Tracking Research and
Applications Symposium 2002, pages 71–76, New
York, USA. ACM, ACM Press.
Peiß, S., Wickens, C. D., and Baruah, R. (2018). Eye-
tracking measures in aviation: A selective literature
review. The International Journal of Aerospace Psy-
chology, 28(Issue 3–4):98–112.
Toyoda, H. (2007). KYO BUNSAN KOUZOU BUNSEKI
[AMOS HEN]. Tokyo Syoseki, Tokyo, Japan.
Ziv, G. (2016). Gaze behavior and visual attention: A re-
view of eye tracking studies in aviation. The Inter-
national Journal of Aviation Psychology, 26(3–4):75–
104.
Impact of Task-evoked Mental Workloads on Oculo-motor Indices during a Manipulation Task
279
