
Using Convolutional Neural Networks and Raw Data to Model
Intraday Trading Market Behaviour
Vitaliy Milke
a
, Cristina Luca
b
, George Wilson and Arooj Fatima
c
School of Computing and Information Science, Anglia Ruskin University, East Road, Cambridge, U.K.
Keywords: Convolutional Neural Networks, Intraday Trading, Raw Financial Market Data, Machine Learning, Deep
Learning, Supervised Learning.
Abstract: This paper presents the use of Convolutional Neural Network (CNN) for finding patterns within intraday
trading by being trained with raw Tick and other financial data. The network is specifically used to predict
the probability of future movement at the intraday level of trading. The method of raw data pre-processing is
evaluated and is critical to avoid errors that reduce the final accuracy of the model; for intraday trading, this
includes a focus on the irregular Tick event rather than an arbitrary equal measure of interval time, such as a
minute or a day. Training involves the use of a moving image window of 200 Ticks, where each increment of
time is from 1 to 10 Ticks. For normalization (atypical for financial data) Tick intervals are capped at 20
milliseconds, Volumes are capped at 10 million, and Prices scaled over local extremes for each 200-Tick chart
interval. The neural network was trained using the publicly accessible cloud computing GPU processors of
Google Colaboratory. An original methodology for selecting the training data was used which reduced the
number of calculations by including only patterns close to the active movements of interest.
1 INTRODUCTION
Stock and currency markets are known to exhibit
increased volatility influenced by negative political
events and unexpected government decisions. It is
challenging to predict such events and the high levels
of volatility have a high associated risk (Weissman,
2005) for Algorithmic Trading Systems (ATS) which
use long-term historical trends based on the analysis
of time-series that average and thereby veil the
behaviour patterns of securities market participants.
The volatility of market prices during short-term
periods, such as a day (intraday trading) depends on
the over-arching macro-economic or political trend at
the previously known time of publication of the
macro-economic statistics. During most of a 24-hour
intraday trading session, volatility is then influenced
by the behaviour of the market participants. Just as
predictive techniques can be applied to the long term
behaviour of the markets, so can such techniques be
applied to intraday trading behaviour.
a
https://orcid.org/0000-0001-7283-2867
b
https://orcid.org/0000-0002-4706-324X
c
https://orcid.org/0000-0001-6129-9032
In recent years, powerful open-source new
technologies of Machine Learning (ML) have been
introduced, including Deep Learning (DL) which
utilises the functionality of neural networks whose
architecture includes hidden layers. One of the areas
where ML/DL techniques are already applied is
Financial Market trading and in particular the
development of ATS with a ML/DL learning basis
(Chen at al., 2016), (Zhang, Zohren and
Roberts
,
2019).
This paper presents some research undertaken on
intraday trading using Convolutional Neural
Networks (CNN) using the Tick’s database with the
aim to predict the probability of financial market
behaviour for short periods of up to 60 minutes into
the future. Integral data, such as five, fifteen-minute
or longer-term data, as well as Recurrent Neural
Networks (RNN), are often used for market following
strategies. This paper focuses on the strategy of
finding market pivot points where patterns of
behaviour of market participants that are visible on
tick data are essential.
224
Milke, V., Luca, C., Wilson, G. and Fatima, A.
Using Convolutional Neural Networks and Raw Data to Model Intraday Trading Market Behaviour.
DOI: 10.5220/0008992402240231
In Proceedings of the 12th International Conference on Agents and Artificial Intelligence (ICAART 2020) - Volume 2, pages 224-231
ISBN: 978-989-758-395-7; ISSN: 2184-433X
Copyright
c
2022 by SCITEPRESS – Science and Technology Publications, Lda. All rights reserved

The remainder of this paper is structured as
follows: Section 2 reviews existing works related to
our research. In Section 3 the proposed approach is
presented along with a description of the data used
and the normalization techniques applied. Section 4
discusses the preliminary results obtained and the
validation of the proposed approach. In section 5 the
benefits of the selected neural network and future
work are discussed. Finally, the conclusions are
drawn in Section 6.
2 RELATED WORK
Traditional statistical methods of data analysis are
well described (Halls-Moore, 2019), (Baralis et al.,
2017), (Bekiros, 2015), (Zhong and Enke, 2017) and
include technologies/methodologies such as Online
Analytical Processing (Chaudhuri and Dayal, 1997)
but are mainly focused on testing pre-formulated
hypotheses. Many researchers have used Recurrent
Neural Networks (RNN) (Hagan at al., 2016), (Dixon,
2018), (Lee and Soo, 2017) to provide predictions for
financial time-series (Chen at al., 2018), (Wang at al.,
2016) but they are not so good at filtering out noise
from very large amounts of input data. Furthermore,
in the selection of the period of interest, fixed time
interval units (weeks, days, hours, minutes) are often
used within which critical information can be lost due
to the smoothing effect of integrating the transaction
data within each fixed equal unit time interval over
the set of intervals covering that period. Such critical
information (dependent on the behaviour of the
financial market participants) might be time intervals
between transactions, large share/contract (volume)
individual transactions, and pivot point indicators. In
contrast to RNN, Convolution Neural Networks
(CNN) process input data in a reduced-resolution
form allowing all data to contribute to the training
process and finding patterns in the data that otherwise
would not be revealed (Samarasinghe, 2016).
A CNN is a type of artificial neural network that
has successfully been applied to analyzing two-
dimensional visual imagery. The work of a CNN (as
applied to an image) is usually interpreted as a
transition from specific image features to more
abstract details via a series of stages culminating in a
set of high-level concepts. At the same time the
network self-tunes its weights and generates the
necessary hierarchy of abstract attributes, filtering
unimportant details and highlighting the essential
properties. The same principle of creating the
abstracts may be employed for analyzing financial
market data. Several approaches have used technical
indicators in market transaction data to identify
patterns (Chen and Liao, 2018), (Dymova,
Sevastjanov and Kaczmarek, 2016), (Chen and Chen,
2016). In (Sezer and Ozbayoglu, 2018), the authors
utilised 15 images of time series charts from stock
market and exchange traded funds and 15 technical
indicators to train a CNN over a 15-day period.
However, technical indicators are based on integral
(averaged) parameters and significant market
information can be lost (Gocken at al., 2016). The
approach of representing financial time-series in the
form of two-dimensional images for further analysis
using standard CNN for image recognition has also
gained popularity (Chen at al., 2016). For the analysis
of medium-term movements, a combination of a long
short-term memory neural network and CNN has
been used (Zhang, Zohren and
Roberts, 2019). All the
above papers examine medium-term movements of
financial markets that are longer than one day. On the
other hand, CNN has also been used to predict
outcomes specifically for high-frequency financial
market data (Doering, Fairbank and Markose, 2017),
although it remains to be seen if this technique
performs better than other machine learning methods.
The purpose of the current research is to present
an intraday trading method that uses a CNN, with raw
tick data with variable interval transactions that
preserve critical information in order to predict the
probabilities of the directions and depths of the next
price movement. As opposed to other research, this
paper does not aim to predict a specific price level in
the future, but only determines the probabilities of
directions and depths of movement, which is
sufficient to open a long or short position in a
financial instrument. Closing a position is carried out
by standard methods of money and risk management.
Thus, this model is a classification algorithm, not a
regression. Also, this paper differs from previous
work by using a CNN to analyse the intraday
movements of the financial market without use of
high-frequency trading (HFT) order books so
allowing utilization of publicly available GPU
machine resources. In addition, this paper presents a
unique method of nonlinear normalisation of prices,
intervals and volumes to improve the quality of
probability prediction. The authors also propose a
method for reducing the number of calculations by
pre-processing the data and considering only patterns
ready for significant movement.
Using Convolutional Neural Networks and Raw Data to Model Intraday Trading Market Behaviour
225
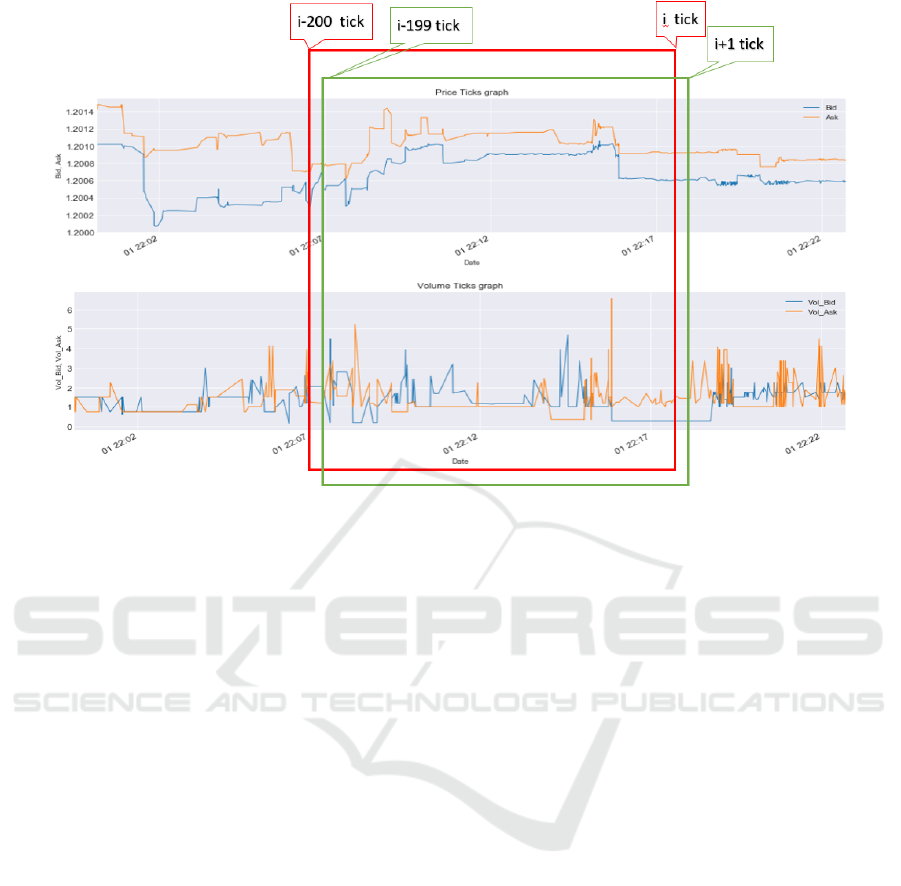
Figure 1: Two hundred tick charts (pictures) for finding patterns.
3 PROPOSED APPROACH
The present study hypothesises that the CNN will
accurately model short-term patterns of intraday
trading because of training with non-linear time
interval data and appropriate data pre-processing. The
majority of the CNN experimental data analyses in
this work was undertaken using the Google
Colaboratory (Google Inc, 2019) utilising the Keras
library (Chollet, 2015) based on the TensorFlow
backend (Abadi, 2015).
3.1 Data Used
Data for this work was downloaded from the
EUR/ESD Forex historical trading data resources
(Dukastcopy Swiss Banking Group, 2019). The data
consists of the date and time of transactions providing
irregular time intervals between bid and offer price
(Ticks) with an accuracy of milliseconds, the prices
of supply and demand (Ask and Bid), as well as the
Volume data (millions of Lots, where Lots are the
number of trading units in one transaction). Most of
the experiments used a period of twelve months from
January to December 2018 inclusive; this dataset
consists of more than 25 million rows. 80% of the
dataset was used for training and 20% was reserved
for validation using an iterative approach. For the
initial testing of ideas/models a dataset of six months
from January to June 2019 inclusive was used; this
dataset consists of more than 16.6 million rows. Each
epoch used by the CNN-DL algorithm utilises
training data and then checks the model with the
validation dataset. Due to the very large amount of
data the model is trained iteratively using data from
approximately two-week intervals.
3.2 Generation of a Three-dimensional
Tensor
Given that a CNN has been proven successful in the
analysis of images and is able to find local patterns in
a picture, the analysis of short-term trading can be
compared with the analysis of images of the type
presented in Figure 1. The CNN takes a 200 Tick
moving image window of Tick prices and volumes
versus time, progressing left-to-right (increasing
time) in Tick increments. As each new tick appears a
new chart is generated for the last 200 Ticks (about 5
minutes for this data). As a result, the two-
dimensional arrays of prices and volumes are
transformed into a three-dimensional tensor. Once the
nonlinear data is normalized it is submitted as source
data to the CNN, which is used for training and
subsequent pattern recognition. The third dimension
of 200 ticks for each chart was chosen as the practical
maximum possible of GPU memory for the tensor
training on the open-source Google Colaboratory.
ICAART 2020 - 12th International Conference on Agents and Artificial Intelligence
226
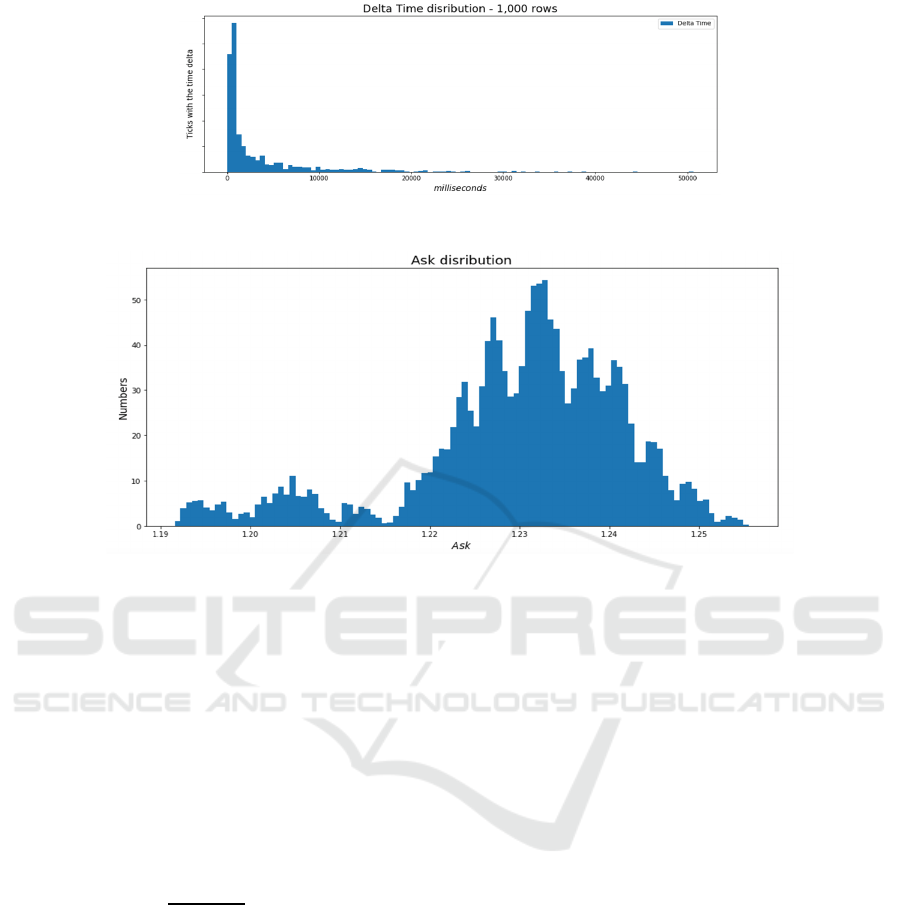
Figure 2: Distribution of 1,000 first intervals between Ticks.
Figure 3: Ask Price distribution over a 4-month period.
3.3 Normalisation of Input Data
The raw data contains transaction information where
the interval between transaction times, volumes and
price ranges vary enormously. It is desirable that the
matrices of input parameters, the output response
vector and the matrix of calculated coefficients
(weights) should take values from the interval [0,1] as
such data normalization will increase the accuracy of
the CNN training.
The typical linear mathematical normalization for
each parameter is calculated by the formula:
x
(1)
In the current paper, instead of absolute minimum and
maximum values, boundaries are chosen where the
value of the variable has a high probability.
3.3.1 Tick Intervals
The raw data includes transaction times and,
therefore, by differencing successive times, time
array data can be converted to Tick intervals (a
measure of the intensity of trading). Figure 2 shows
that for the first 1,000 Ticks since January 1
st
2018,
the vast majority of Tick intervals are less than 20
seconds. The same conclusion was confirmed for
other periods. Accurate counting of all Ticks with
time intervals of more than 20 seconds gives a figure
of 7,374 out of more than 8.5 million or about
0.086%. Any linear scaling over such a skewed
distribution (maximum Tick interval for this data is
100,000 milliseconds) would be unrepresentative and
lose information, and so for purposes of
normalization any Tick value greater than 20 seconds
is capped at that value, thus when scaled to [0,1]
retains the detail of the trading activity for 98.7% of
the trading session time. This approach does not lose
important information since long intervals are
primarily associated either with stops of exchange
trades or with weekends (low activity).
3.3.2 Volume
A similar method of normalization (as described
above for Tick intervals) is applicable for Volumes,
which also have a substantial unevenness. A
statistical distribution of the Lot size versus Volume
for any 1,000 Ticks (data rows) and more show a
skewed distribution similar to Tick intervals and the
vast majority of high trading unit Volumes do not
exceed 10 million. Thus, all Volumes over 10 million
equate to 10 million and the data scaled accordingly
to ensure a better fit between the data and the
interpolation.
Using Convolutional Neural Networks and Raw Data to Model Intraday Trading Market Behaviour
227

3.3.3 Prices
Figure 3 shows the statistical distribution of Ask price
over four months, varying slightly from 1.19 to 1.26.
The Bid price distribution is similar. One approach is
to normalize the data before splitting it into training
and test data using forecasted maximum and
minimum prices; this approach is not used here due
to uncertainties in such forecasts. Given that the detail
of price changes during any 200 Tick chart is
important to retain but is less significant relative to
the changes over four months, the normalization of
prices was based on the local maximum and
minimum prices of each Tick chart as generated
rather than the global extremes of the period of
interest.
3.4 Probabilities
The interval (depth) of a possible short-term price
movement in both directions was divided into 12
irregular intervals (Figure 4).
Figure 4: Probabilities vector.
The division is done based on the statistical
distribution of intraday margin (the difference
between ask and bid prices), as well as based on the
stochastic distribution of flat fluctuations, which are
the most likely cause of stop losses. Each interval has
the probability of price movement from the current
tick, which has ask
i
and bid
i
prices. The price
movements may go up or down, which correspond to
P
+
and P
-
probabilities.
Data analysis done by the authors shows that the
margin and the flat movements have similar statistical
distribution close to Normal (Gaussian) distribution
(Figure 5). Therefore, the splitting of the probability
vector can be associated with two standard deviations
of these distributions. It is possible to equal the border
between the P
1+
and P
2+
interval to two standard
deviations of the margin distributions. Similarly, the
border between P
2+
and P
3+
is equal to two standard
deviations of the flat movement (fluctuations)
distributions. The flat fluctuations are the most likely
cause of stop losses. For intraday trading, it is very
important to reduce the number of stop-losses (Alves,
Caarls and Lima, 2018). The stop loss level was also
tied to two standard deviations of flat movements as
can be seen in Figure 4. Thereby, a reduction in losses
in real trading is achieved. Splitting of the other parts
of the probability vector is implemented as the stop-
loss level multiplied by 5, 10 and 50. The multipliers
have been chosen to ensure a similar probability of
achieving these price levels. Most of the time
financial markets are flat but demonstrate an
oscillatory (retreating) movement with a small
amplitude. For this reason, stop loss often occurs
during intraday trading. This feature of financial
markets is often overlooked when neural networks
solve the regression task of predicting future prices.
The probability categorization task described in this
paper has advantages over the indicated regression
task since only recoilless movements were taken into
account when forming the probability vector.
Rollbacks were considered movements in which
returns from the beginning did not exceed half of the
movement passed.
The authors performed experiments with other
measures of flat movement, including the Golden
Ratio. However, this half-reverse movement forms
the clearest distributions over the above 12 intervals.
The data collection for supervised learning was
done on a complete 1.5 year dataset. The supervisory
signals (outputs vector) were formed based on the
recoilless movement for the next 8,000 ticks
(approximately one hour) but taking into account that
any open position should be sold before the end of the
trading day.
3.5 Reduction of Calculations
To be able to use publicly available GPU processor
resources for a reasonable time the number of
calculations needs to be reduced. To do this an
additional variable L was introduced equal to the
number of ticks before the significant movement of
the financial market began. If during the L-ticks after
the considered time the price does not go beyond the
ICAART 2020 - 12th International Conference on Agents and Artificial Intelligence
228

opposite stop loss, then the current tick is considered
uninteresting, and the algorithm goes to the next tick.
As mentioned above, the size of the stop loss was
calculated from the standard deviation of the flat
fluctuation distribution. Consequently, a significant
size of the useless flat fluctuation was excluded from
the training dataset for the neural network. Through
an iterative experiment, the most relevant value L =
14 was chosen which retained the most significant
number of long recoilless movements in the training
dataset. For the 1.5 year dataset containing 42 million
lines this simple improvement reduced the dataset
size by 73%. The authors understand that entering an
additional dropout parameter can also remove some
interesting movement data, especially those that start
slowly. However, for intraday trading, it is not so
essential to catch all the movements. It is more
important to recognize the movements with the
highest probability of continuation and not to take a
stop loss.
The decrease made in calculations can be
especially useful in the authors' further work on
Reinforcement Learning agents, where the number of
iterations for training the neural network can increase
by orders of magnitude.
4 RESULTS
A supervised learning method was used for training a
one-dimensional eight layer CNN where non-uniform
intervals between adjacent Ticks are presented to the
network in the form of a separate column feature.
Consequently, the non-uniformity of intervals
between Ticks was explicitly entered into the neural
network along with data on prices and volumes.
Validation compares the existing correct values of the
next short-term price movement that the CNN did not
see during training with the probability of the
predicted direction and the interval (depth) of this
movement.
Due to the very large amount of input data the
CNN training was carried out iteratively,
approximately one million Ticks each on Google
Colaboratory. This approach emulates training in real
trading. The Keras ModelCheckpoint callback
function was used to memorize training results for
each epoch with the subsequent choice being the
epoch with the best accuracy. For this research, the
authors ran experiments for data batch size
parameters ranging from 10 to 100, and the number
of epochs in the range 5 to 30. The best results for the
current time were achieved when using a data batch
size parameter equal to 20 with the number of epochs
equal to 12. For the mentioned sets of global
parameters, the CNN training on 12 month Tick data
took 15 hours of continuous time divided into
iterations. Preliminary results show a sufficiently
high accuracy which must still be comprehensively
verified in cross-validation calculations, taking into
account the restrictions used for time-series.
Calculations utilizing the public GPU processing
resources can take a substantial amount of time due
to the size of the data and the limited time of
uninterrupted use of these resources. Once
comprehensive validations are completed these
results will be published.
5 CONCLUSIONS
In this work, the authors used CNN to predict the
probability of direction and interval of future
movement of intraday transactions of the financial
market using non-standard methods of preliminary
processing of raw data. Fundamental to the approach
is normalization of the non-linear data and the
translation of 2D data into a 3D tensor through
creation of successive 200 Tick charts. As a result, the
dimension of the input data increases dramatically
with the associated impact on resources. The authors
propose an original method for selecting the training
data which reduces the number of calculations by
including only patterns close to the active movement.
The approach uses raw Tick data to train the neural
network to predict the probability of direction and
interval of future movement. The training process
itself is dependent on the capabilities of the Google
Colaboratory platform and the model must be re-
trained continuously.
One observation is that the loss of information on
extra-large volume Lots is more sensitive than on
large time intervals between Ticks. However, in
transactions with extra-large Lots there are often
substantial price changes and possible delays with the
execution of market orders, lowering the quality of
the prediction. In further research the authors may
create a separate parallel path to the main neural
network for analyzing massive volumes. It may be
worthwhile to use machine learning methods that are
faster than neural networks, such as decision trees and
their variations.
The current results show that CNNs can be used
as a useful additional tool for modelling intraday
trading. An aspirational goal for future work by the
authors is to create an agent with Reinforcement
Learning which will use all the original approaches
described in the current paper to normalize raw data
Using Convolutional Neural Networks and Raw Data to Model Intraday Trading Market Behaviour
229
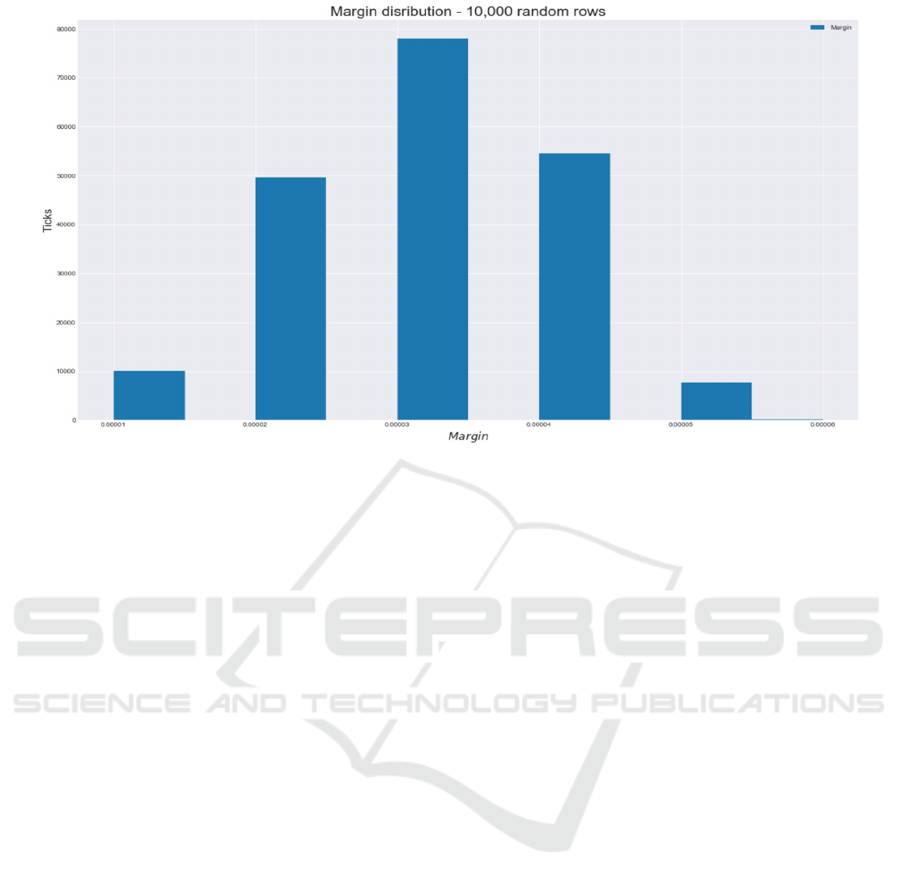
Figure 5: Margin distribution.
and reduce the number of calculations for the
possibility of using publicly available GPU cloud
processor resources. A major difficulty is, of course,
that the financial markets are constantly changing, so
that one trained neural network is likely to become
less accurate when predicting events ever further into
the future from the period of time over which the net
was trained. For this reason it is necessary to
periodically re-train the neural network; for example,
once a week during the weekend when financial
markets are closed. Future work by the current
authors will also explore the use of a hybridized
approach using a combination of CNN-RNN in
conjunction with reinforcement learning.
REFERENCES
Abadi, M., Agarwal, A., Barham, P., Brevdo, E., Chen, Z.,
Citro, C., Corrado, G., Davis, A., Dean, J., Devin, M.,
Ghemawat, S., Goodfellow, I., Harp, A., Irving, G.,
Isard, M., Jia, Y., Jozefowicz, R., Kaiser, L., Kudlur,
M., Levenberg, J., Mane, D., Monga, R., Moore, S.,
Murray, D., Olah, C., Schuster, M., Shlens, J., Steiner,
B., Sutskever, I., Talwar, K., Tucker, P., Vanhoucke,
V., Vasudevan, V., Viegas, F., Vinyals, O., Warden, P.,
Wattenberg, M., Wicke Machine Learning on
Heterogeneous Distributed Systems. [online] Available
through: <https://www.tensorflow.org> [Accessed 17
October 2019]., M., Yu, Y. and Zheng, X., 2015.
TensorFlow: Large-Scale
Alves, S.A., Caarls, W. and Lima, P.M., 2018. Weightless
Neural Network for High Frequency Trading. In 2018
International Joint Conference on Neural Networks
(IJCNN). IEEE
Baralis, E., Cagliero, L., Cerquitelli, T., Garza, P. and
Pulvirenti, F., 2017. Discovering profitable stocks for
intraday trading. Information Sciences 405.
Bekiros, S., 2015. Heuristic learning in intraday trading
under uncertainty. Journal of Empirical Finance, 30.
Chaudhuri, S. and Dayal, U., 1997. An overview of data
warehousing and OLAP technology. ACM Sigmod
record, 26(1).
Chen, C. and Liao, C., 2018. Short term intraday trading of
futures market analysis. In 33rd Youth Academic
Annual Conference of Chinese Association of
Automation (YAC). IEEE.
Chen, J.F., Chen, W.L., Huang, C.P., Huang, S.H. and
Chen, A.P., 2016. Financial time-series data analysis
using deep convolutional neural networks. In 7th
International Conference on Cloud Computing and Big
Data (CCBD). IEEE
Chen, T.L. and Chen, F.Y., 2016. An intelligent pattern
recognition model for supporting investment decisions
in stock market. Information Sciences, 346.
ELSEVIER.
Chen, W., Yeo, C.K., Lau, C.T. and Lee, B.S., 2018.
Leveraging social media news to predict stock index
movement using RNN-boost. Data & Knowledge
Engineering, 118. ELSEVIER.
Chollet, F., 2015. Keras [Online]. Available through:
<https://keras.io> [Accessed 17 October 2019].
Dixon, M., 2018. Sequence classification of the limit order
book using recurrent neural networks. Journal of
Computational Science, 24. ELSEVIER.
Doering, J., Fairbank, M. and Markose, S., 2017.
Convolutional neural networks applied to high-
frequency market microstructure forecasting. In 9th
ICAART 2020 - 12th International Conference on Agents and Artificial Intelligence
230

Computer Science and Electronic Engineering
Conference. IEEE.
Dukastcopy Swiss Banking Group, 2019. Historical Data
Feed, [online] Available through:
<https://www.dukascopy.com/swiss/english/marketwa
tch/historical/> [Accessed 17 October 2019].
Dymova, L., Sevastjanov, P. and Kaczmarek, K., 2016. A
Forex trading expert system based on a new approach
to the rule-base evidential reasoning. Expert Systems
with Applications, 51. ELSEVIER.
Goçken, M., Ozçalıcı, M., Boru, A. and Dosdoğru, A.T.,
2016. Integrating metaheuristics and artificial neural
networks for improved stock price prediction. Expert
Systems with Applications, 44. ELSEVIER.
Google Inc, 2019. Google Colaboratory, [online] Available
through: <https://colab.research.google.com/notebooks
/welcome.ipynb> [Accessed 17 October 2019].
Hagan, M., Demuth, H., Beale, M. and De Jesus, O., 2016.
Neural Network Design, Martin Hagan. Lexington, KY,
2nd. Ed.
Halls-Moore, M., 2019. Advanced Algorithmic Trading, [e-
book]. Available through:
<https://www.quantstart.com/advanced-algorithmic-
trading-ebook> [Accessed 17 October 2019].
Lee, C.Y. and Soo, V.W., 2017. Predict Stock Price with
Financial News Based on Recurrent Convolutional
Neural Networks. In Conference on Technologies and
Applications of Artificial Intelligence (TAAI). IEEE.
Samarasinghe, S., 2016. Neural networks for applied
sciences and engineering: from fundamentals to
complex pattern recognition. Auerbach publications.
Sezer, O.B. and Ozbayoglu, A.M., 2018. Algorithmic
financial trading with deep convolutional neural
networks: Time series to image conversion
approach. Applied Soft Computing, 70. ELSEVIER.
Wang, J., Wang, J., Fang, W. and Niu, H., 2016. Financial
time series prediction using elman recurrent random
neural networks. Computational intelligence and
neuroscience.
Weissman, R., 2005. Mechanical trading systems: Pairing
trader psychology with technical analysis. John Wiley
& Sons.
Zhang, Z., Zohren, S. and Roberts, S., 2019. DeepLOB:
Deep convolutional neural networks for limit order
books. IEEE Transactions on Signal Processing,
67(11), pp.3001-3012
Zhong, X. and Enke, D., 2017. Forecasting daily stock
market return using dimensionality reduction. Expert
Systems with Applications, 67, pp.126-139.
Using Convolutional Neural Networks and Raw Data to Model Intraday Trading Market Behaviour
231
