
Food Data Integration by using Heuristics based on Lexical
and Semantic Similarities
Gorjan Popovski
1,2 a
, Gordana Ispirova
1,2 b
, Nina Hadzi-Kotarova
3
, Eva Valen
ˇ
ci
ˇ
c
1,2,4 c
,
Tome Eftimov
2 d
and Barbara Korou
ˇ
si
´
c Seljak
2 e
1
Jo
ˇ
zef Stefan International Postgraduate School, 1000 Ljubljana, Slovenia
2
Computer Systems Department, Jo
ˇ
zef Stefan Institute, 1000 Ljubljana, Slovenia
3
Faculty of Computer Science and Engineering, Ss. Cyril and Methodius University, 1000 Skopje, North Macedonia
4
School of Health Sciences, Faculty of Health and Medicine, Priority Research Centre in Physical Activity and Nutrition,
The University of Newcastle, Callaghan, Australia
Keywords:
Data Normalization, Food Data Integration, Lexical Similarity, Semantic Similarity, Word Embeddings.
Abstract:
With the rapidly growing food supply in the last decade, vast amounts of food-related data have been collected.
To make this data inter-operable and equipped for analyses involving studying relations between food, as one
of the main environmental and health outcomes, data coming from various data sources needs to be normalized.
Food data can have varying sources and formats (food composition, food consumption, recipe data), yet the
most familiar type is food product data, often misinterpreted due to marketing strategies of different producers
and retailers. Several recent studies have addressed the problem of heterogeneous data by matching food
products using lexical similarity between their English names. In this study, we address this problem, while
considering a non-English, low researched language in terms of natural language processing, i.e. Slovenian.
To match food products, we use our previously developed heuristic based on lexical similarity and propose two
new semantic similarity heuristics based on word embeddings. The proposed heuristics are evaluated using a
dataset with 438 ground truth pairs of food products, obtained by matching their EAN barcodes. Preliminary
results show that the lexical similarity heuristic provides more promising results (75% accuracy), while the
best semantic similarity model yields an accuracy of 62%.
1 INTRODUCTION
State-of-the-art data fusion approaches enable inte-
gration of various data sources to produce more con-
sistent, usable, and accurate information than those
provided by any individual data source. However,
before using fused data for predictive modelling, we
must find an efficient way of linking unstructured
data attributes that are shared across the multiple data
sources. To enable this, a data normalization pro-
cess is required as a pre-processing step before start-
ing with some further analyses (Pramanik and Hus-
sain, 2019). By applying data normalization the same
concepts that might be represented with different text
a
https://orcid.org/0000-0001-9091-4735
b
https://orcid.org/0000-0001-8558-6909
c
https://orcid.org/0000-0001-8560-920X
d
https://orcid.org/0000-0001-7330-1902
e
https://orcid.org/0000-0001-7597-2590
descriptions (i.e. names) or standards are linked to-
gether.
There are many studies performed in the biomed-
ical domain, where different data sources that in-
clude phenotype and genotype information are linked
together in order to explore some hidden relations.
The biomedical domain is well-researched, as a re-
sult of the existence of extensive biomedical vocab-
ularies, standards, and resources that are available
(Aronson, 2006). The Unified Medical Language
System (UMLS) (Bodenreider, 2004) integrates and
distributes key terminology, classification and cod-
ing standards, to promote the creation of more effec-
tive and inter-operable biomedical information sys-
tems and services (Schuyler et al., 1993). It also con-
sists of tools for normalizing English strings, generat-
ing lexical variants, and creating indexes. This means
that having the text description of a biomedical con-
cept, we can find its matching from the UMLS vocab-
ulary by using the lexical tools.
208
Popovski, G., Ispirova, G., Hadzi-Kotarova, N., Valen
ˇ
ci
ˇ
c, E., Eftimov, T. and Seljak, B.
Food Data Integration by using Heuristics based on Lexical and Semantic Similarities.
DOI: 10.5220/0008990602080216
In Proceedings of the 13th International Joint Conference on Biomedical Engineering Systems and Technologies (BIOSTEC 2020) - Volume 5: HEALTHINF, pages 208-216
ISBN: 978-989-758-398-8; ISSN: 2184-4305
Copyright
c
2022 by SCITEPRESS – Science and Technology Publications, Lda. All rights reserved

However, the food domain is still low-resourced
regarding the availability of resources that can be
used for developing artificial intelligence-based mod-
els. The food supply has evolved in recent years,
alongside the increasing demand for nutritional and
other food-related components. From recent studies
involving nutrition huge amounts of data have been
collected. In order for this data to be reusable and in-
teroperable and equipped for data analysis, it needs to
be harmonized and integrated. Data harmonization is
the process of bringing together data of varying differ-
ent formats, naming conventions, columns, and trans-
forming it into one cohesive data set. One way of
performing data harmonization is to match concepts
to an existing and widely used domain-specific ontol-
ogy. In the food and nutrition domain, this translates
to matching food concepts to the few food ontolo-
gies that exist such as FoodOn (Griffiths et al., 2016),
OntoFood and SNOMED CT (Donnelly, 2006). How-
ever, a recently published study (Popovski et al.,
2019) showed that all of them were developed for
some specific problems and their coverage is lim-
ited. Regarding other approaches for data harmoniza-
tion and normalization in the food and nutrition do-
main, there is a semi-automatic system for classifying
and describing foods according to FoodEx2 ((EFSA),
2015), known as StandFood (Eftimov et al., 2017),
which can be used for data normalization of food con-
cepts. The limitation of StandFood is that currently, it
works only with English foods’ names.
Food data can have various sources and formats:
food composition data, food consumption data, recipe
data, etc. The most commonly used type is food prod-
uct data. However, this type of data is often misin-
terpreted as a result of the vast and very competitive
marketing system nowadays. Different producers and
retailers manipulate product names to achieve better
marketing. The misinterpretation can also occur due
to the vast variety of diet styles that have emerged re-
cently.
In this paper, we focus on linking food-related
concepts provided in a non-English (i.e. Slovenian)
language which are extracted from two online gro-
cery stores. By linking food concepts from multiple
data sources, which often provide complementary in-
formation about food products, we can complete or at
least enrich the available information. This can also
be helpful in the process of missing value imputation
in food composition databases (FCDBs), especially
for branded food products.
It is important to note that the Slovenian language
is a low-resourced language from the perspective of
availability of natural language processing tools such
as part-of-speech tagging (POS) (Voutilainen, 2003),
chunking, lemmatization, which has represented an
additional challenge while working with textual data.
To link food products using their text description,
we use lexical and semantic similarity as heuristics.
The lexical similarity focuses on the syntactic and
morphological similarity of the compared text, while
the semantic similarity focuses on their context sim-
ilarity. In Section 2, we provide a critical overview
of the related work. Next, in Section 3, our proposed
methodology is explained in detail, followed by an
explanation of the data in Section 4. Additionally,
the experimental results and discussion are given in
Section 5, where we also provide some directions for
future work.
2 RELATED WORK
One of the challenges while working on text similar-
ity is that the same concept can be mentioned using
phrases with a variety of structures, which is a con-
sequence of how people express themselves. In order
to combine the information for the same concept that
is represented in different ways, we should apply text
normalization methods. Text normalization methods
are based on text similarity measures.
Text similarity measures operate on string se-
quences and give us a metric of similarity (or dissimi-
larity) between two text strings. Text similarity deter-
mines how distant two texts are both in surface (i.e.
lexical similarity) and meaning (i.e. semantic similar-
ity).
Normalization methods based on text similar-
ity measures are well presented in (Aronson, 2001;
Savova et al., 2010). Several normalization methods
that are based on ranking technique are available, with
the goal to rank the candidate matches and then to find
the most relevant match (Collier et al., 2015). Nor-
malization methods can also utilize machine learning
(ML) algorithms to improve results, which was shown
in the gene normalization task as part of BioCre-
ative II (Morgan et al., 2008) and BioCreative III (Lu
et al., 2011). Regarding the food and nutrition do-
main, methods for normalization of short text seg-
ments (e.g., names or descriptions of nutrients, food
composition data, food consumption data) have re-
cently been proposed (Eftimov and Seljak, 2015; Ef-
timov et al., 2017; Ispirova et al., 2017; Eftimov et al.,
2018) by using two approaches: two approaches: (i)
standard text similarity measures; and (ii) a modified
version of Part of Speech (POS) tagging probability-
weighted method, first proposed in (Eftimov and Sel-
jak, 2015).
Food Data Integration by using Heuristics based on Lexical and Semantic Similarities
209

2.1 Lexical Similarity
Lexical similarity can be calculated either on the char-
acter or word level. Most of the lexical similarity
measures do not take into account the actual mean-
ing behind words or the entire phrases in context, but
focus on how many characters or words overlap.
Let D
1
and D
2
be two pieces of text. Some of
the standard lexical similarity measures are (Metzler
et al., 2007):
• The Levenshtein distance counts the number of
deletions, insertions and substitutions necessary
to turn D
1
into D
2
.
• The Optimal String Alignment distance is like the
Levenshtein distance but also allows transposition
of adjacent characters. Each substring may be
edited only once.
• The full Damerau-Levenshtein distance is like the
optimal string alignment distance except that it al-
lows for multiple edits on substrings.
• The longest common substring is defined as the
longest string that can be obtained by pairing char-
acters from D
1
and D
2
while keeping the order of
characters intact.
• A q-gram is a subsequence of q consecutive char-
acters of a string. If x (y) is the vector of counts
of q-gram occurrences in D
1
(D
2
), the q-gram dis-
tance is given by the sum over the absolute differ-
ences |x
i
− y
i
|.
• The cosine distance is computed as 1 −
x·y
||x||||y||
,
where x and y were defined above.
• Let X be the set of unique q-grams in D
1
and Y the
set of unique q-grams in D
2
. The Jaccard distance
is defined as 1 −
|X∩Y |
|X∪Y |
.
• The Jaro distance is defined as 1 −
1
3
(w
1
m
|D
1
|
+
w
2
m
|D
2
|
+ w
3
(m−t)
m
), where |D
i
| indicates the num-
ber of characters in D
i
, m is the number of char-
acter matches and t the number of transpositions
of matching characters. The w
i
are weights asso-
ciated with the characters in D
1
, characters in D
2
and with transpositions.
• The Jaro-Winkler distance is a correction of the
Jaro distance. It uses a prefix scale p which gives
more favourable ratings to strings that match from
the beginning for a set prefix length l.
• The skip-grams are generalization of n-grams in
which the components (typically words) need not
be consecutive in the text, but may leave gaps that
are skipped over.
2.2 Semantic Similarity
Semantic similarity is a metric that defines the dis-
tance between two pieces of text based on their mean-
ing or semantic content. Calculating semantic simi-
larity is related to representational learning (i.e. learn-
ing embeddings), which has become an important re-
search task for learning representation of symbolic
data. The idea of representational learning is to rep-
resent each piece of text (e.g., word, sentence, para-
graph, depending on the problem) as a vector of con-
tinuous numbers. In the case of learning word em-
beddings, the learned vector captures the context of a
word in a piece of text, as well as semantic and syn-
tactic similarity, relation with other words, etc. To
find the similarity between two words, we should cal-
culate the similarity between their vectors. To do this,
we can find the angle between their vectors. The co-
sine distance between two words represented by their
vectors x and y can be calculated using the following
equation:
cos(x, y) =
xy
||x||
2
||y||
2
. (1)
2.2.1 Word2vec Embeddings
In order to include the semantic information in these
representations, Mikolov et al. (Mikolov et al., 2013a;
Mikolov et al., 2013b) presented the word2vec model,
which learns high-quality distributed vector represen-
tations that capture a large number of precise syn-
tactic and semantic word relationships. These repre-
sentations are also known as embeddings. Using this
model, each token (i.e. words) is represented as a vec-
tor of continuous numbers.
2.2.2 GloVe Embeddings
GloVe (Pennington et al., 2014) is an unsupervised
learning algorithm for obtaining vector representa-
tions for words, which is based on aggregated global
word-word co-occurrence statistics from a corpus,
and the resulting representations are linear substruc-
tures of the word vector space.
3 METHODOLOGY
To match the information about the same food prod-
ucts from different data sources, we first preprocess
the data. Next, we match the food products by apply-
ing lexical similarity measures, followed by matching
them with regard to semantic similarity. Finally, we
compare the mapping results by evaluating them on a
HEALTHINF 2020 - 13th International Conference on Health Informatics
210

set of pairs that represent the ground truth, which are
pairs matched by their EAN barcodes.
3.1 Lexical Similarity
Let D
1
and D
2
be two pieces of text. First POS tag-
ging, also called grammatical tagging, is applied to
each of them to identify the part-of-speech tags such
as nouns (NN, NNS, NNP, NNPS), verbs (VB, VBD,
VBG, VBN, VBP, VBZ), adjectives (JJ, JJR, JJS),
cardinal numbers (CD), etc (M
`
arquez and Rodr
´
ıguez,
1998). Let us define
Y
i
= {tokens f rom D
i
that belong to one word class},
(2)
where i = 1, 2. The word classes are: nouns, adjec-
tives, verbs, adverbs, prepositions, determiners, pro-
nouns, conjunctions, modal verbs, particles, and nu-
merals. For example, Y
i
can be a set of all tokens from
D
i
that are tagged as nouns. In such case, the set con-
sists of all tokens that are tagged as NN, NNS, NNP,
and NNPS.
The next step is to define which of the extracted
word classes (morphological POS tags) are significant
to describe the domain to which the text belongs. The
set of nouns is crucial because nouns carry most of the
information in the text, while all other word classes
(adjectives, verbs, numbers, etc.) only give an addi-
tional explanation. After extracting the set of nouns
and the sets of other word classes that are significant
for the domain, lemmatization (Korenius et al., 2004)
is applied to each of them. To find string similarity
between both pieces of text, a probability event is de-
fined as a product of independent events
X = N
k
∏
j=1
Z
j
, (3)
where N is the similarity between the sets of nouns
found in both pieces of text, k is the number of ad-
ditional word classes that are selected and are signif-
icant for the domain, and Z
j
is the similarity between
the sets of word class, j, found in both text. The ad-
ditional word classes can be adjectives, verbs, etc.
Because these events are independent, the proba-
bility of the event X can be calculated as
P(X) = P(N)
k
∏
j=1
P(Z
j
). (4)
To calculate it, the probabilities of the independent
events need to be defined. Because the problem looks
for the similarity between two sets, it is logical to
use the Jaccard index, J, which is used in statistics
for comparing similarity and diversity of sample sets
(Kosub, 2019). For the similarity between the nouns,
the Jaccard index is used, while for the similarity be-
tween the additional word classes the Jaccard index in
combination with Laplace probability estimate (Cest-
nik et al., 1990) is used. This is because, in some short
segments of text, the additional information provided
by other word classes can be missed, so there will be
no zero probabilities. The probabilities are calculated
as
P(N) =
|N
1
∩ N
2
|
|N
1
∪ N
2
|
,
P(Z
j
) =
|Z
j
1
∩ Z
j
2
| +1
|Z
j
1
∪ Z
j
2
| +2
. (5)
By substituting Equations 5 into Equation 4, we ob-
tain a weight for the matching pair.
If we focus on the food domain, or specifically
on the food matching problem, let D
1
and D
2
be the
(Slovenian) names of two selected food products. As
we said before, the nouns carry most of the informa-
tion, while the additional word classes that describe
the food domain are adjectives, which explain the
food item in more detail (e.g., frozen, fresh), and the
verbs, which are generally related with the method of
preparation (e.g., cooked, drained). Let us define
N
i
= {nouns extracted f rom D
i
},
A
i
= {ad jectives extracted f rom D
i
},
V
i
= {verbs extracted f rom D
i
} (6)
(7)
where i = 1, 2.
To find the similarity between the names of food
products, an event is defined as a product of two other
events
X = N · (A +V ), (8)
where N is the similarity between the nouns found in
N
1
and N
2
, and A + V is the similarity between the
two sets of adjectives and verbs handled together as
A
1
+V
1
and A
2
+V
2
. The adjectives and verbs are han-
dled together to avoid different forms with the same
meaning. Additionally, lemmatization is applied for
each extracted noun, verb and adjective, and the sim-
ilarity event uses their lemmas.
Because these two events are independent, the
probability of the event X can be calculated as
P(X) = P(N) · P(A +V ). (9)
The probabilities are calculated as
P(N) =
|N
1
∩ N
2
|
|N
1
∪ N
2
|
,
P(A +V ) =
|(A
1
∪V
1
) ∩(A
2
∪V
2
)| +1
|(A
1
∪V
1
) ∪(A
2
∪V
2
)| +2
(10)
By substituting Equations 10 into Equation 9, we ob-
tain a weight for each matching pair.
Food Data Integration by using Heuristics based on Lexical and Semantic Similarities
211

3.2 Semantic Similarity
For mapping the food products from both datasets
considering semantic similarity, we decided to apply
two different word embedding techniques – word2vec
(Mikolov et al., 2013a) and GloVe (Pennington et al.,
2014). For the model training we used the lemmas of
the words contained in the names of the food prod-
ucts. The reason for learning vector representations
for the lemmas and not the whole words is the fact that
one word, grammatically, can have different cases in
Slovene. Lets have f p is the name of the food prod-
uct, which is consisted of n words:
f p =
n
word
1
, word
2
, ..., word
n
o
(11)
After obtaining the lemmas of each word:
f p =
n
lemma
1
, lemma
2
, ..., lemma
n
o
(12)
We then apply the two algorithms and obtain vector
representations for each lemma (i.e. word) in the food
product name:
E[lemma
a
] =
h
x
a1
, x
a2
, ..., x
ad
i
(13)
Where a ∈ {1, ..., n}, and d is the dimension of the
generated word vectors, manually defined for the both
of the algorithms. After obtaining the vector represen-
tations, the next step is to apply a heuristic for merg-
ing the vectors for all the lemmas of a name, in order
to obtain the vector representation for the whole food
product name. We chose to work with two heuristics:
1. Average – Calculating the vector representation
for the food product name as an average from the
vector representations of the lemmas of the words
from which it consists of:
E
average
[ f p] =
h
x
a1
+ ... + x
n1
n
, ...,
x
ad
+ ... + x
nd
n
i
(14)
2. Sum – Calculating the vector representation of the
food product name as a sum from the vector repre-
sentations of the lemmas of the words from which
it consists of:
E
sum
[ f p] =
h
x
a1
+ ... + x
n1
, ..., x
ad
+ ... + x
nd
i
(15)
Finally, to perform the matching, we calculate the
cosine similarity between the vector representations
of the food product.
3.2.1 Word2vec Embeddings
The only numeric parameters that varied between the
different word2vec models were the dimension size
and the sliding window size. Values for the sliding
window were chosen to be [2, 3, 5], while the dimen-
sions were [100, 200]. Additionally, the feature ex-
traction algorithms included Bag of Words and Skip-
gram. By combining these parameter values, a total
of 12 word2vec models were trained.
3.2.2 GloVe Embeddings
Analogous to the word2vec parameter choice, the
same values were used for the numeric parameters of
GloVe, i.e. [2, 3, 5] for the sliding window and [100,
200] for the number of dimensions. Thus, a total of
six models were trained.
In both cases, the sliding windows were chosen
according to the average number of words per food
product, which rounded equals to nine.
4 DATA
In this section we explain the data collection process,
after which we elaborate on the data pre-processing
step.
4.1 Data Collection
The data about food products used in this study were
scrapped from the web sites of two food retailers (for
convenience purposes let us name them: Retailer
1
and Retailer
2
). Each website contains some, but not
complete, information about each food product, such
as the food product name in Slovenian, the EAN bar-
code, the food label, the lists of ingredients and al-
lergens, and the name of the producer. For the food
products for which we have their food product names
and EAN codes, we constructed datasets containing
these two pieces of information about each product
(the format of the datasets is shown in Table 1). It
needs to be pointed out that the food names were sim-
ilar, but not the same (e.g. bread is named by one re-
tailer as “bel kruh”, i.e “white bread” in English, and
by another retailer as “p
ˇ
seni
ˇ
cni kruh, bel”, i.e. “wheat
bread, white”).
Where f p is the food product name, bc is the cor-
responding EAN code, and n is the number of food
products in each dataset – for Retailer
1
, n = 1, 836
and for Retailer
2
, n = 6, 587.
HEALTHINF 2020 - 13th International Conference on Health Informatics
212
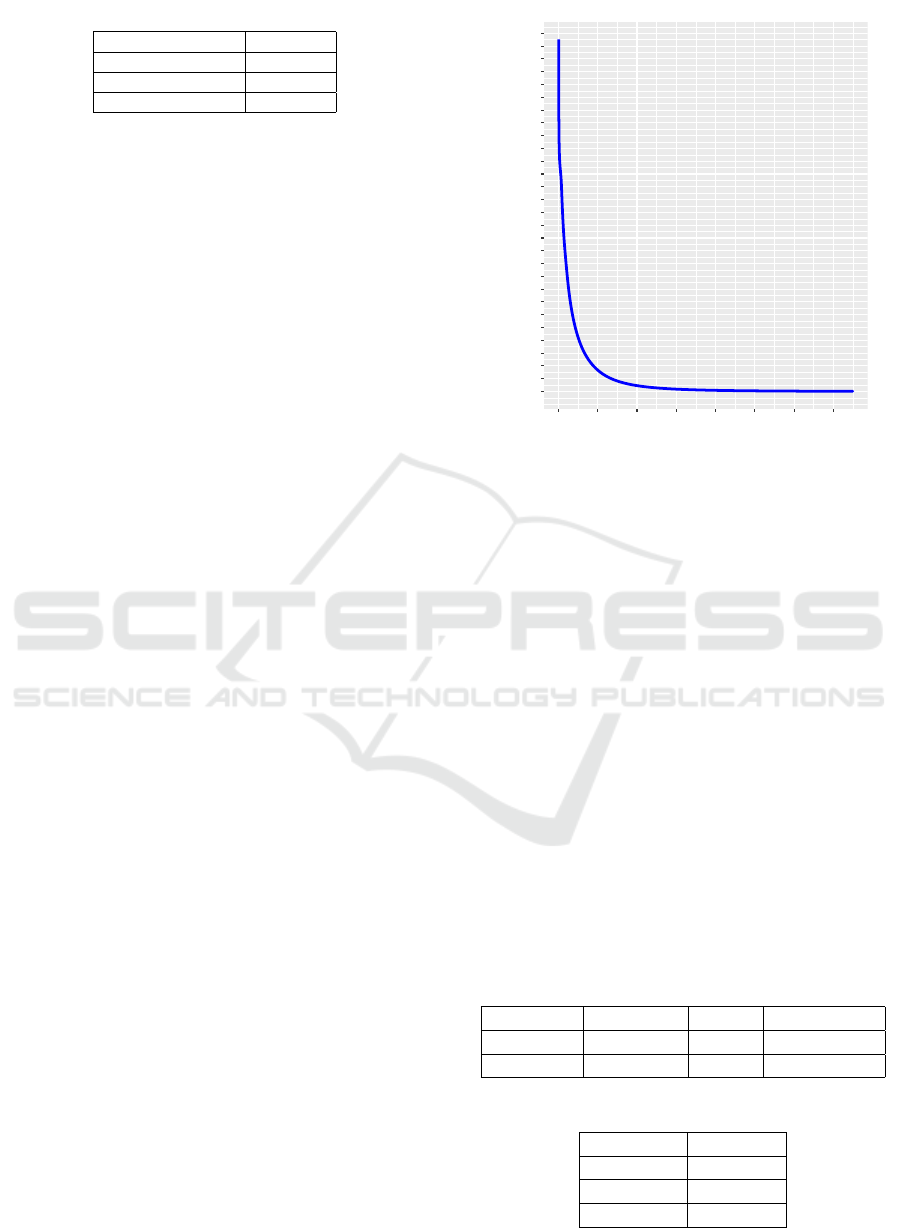
Table 1: Dataset format.
Food product name EAN code
fp
1
bc
1
...
...
fp
n
bc
n
4.2 Data Pre-processing
Having the datasets in the format presented in Table 1,
before applying the algorithms for obtaining semantic
similarity or calculating lexical similarity with Equa-
tion 10, the data needed to be pre-processed. The first
step was to perform POS tagging on the food product
names. Since we are working with words in Slove-
nian, the POS tagger that is used is for Slovenian
(Grcar et al., 2012). The Slovenian tagger outputs
the tokens in three types of data: word form, lemma,
and morph-syntactic description or tag. We use the
lower case lemmas for each word. The data con-
sists of words spanning across multiple morpholog-
ical types. However, only the lemmas nouns, adjec-
tives, and verbs convey semantic information. There-
fore, these are the only three types that are consid-
ered while calculating lexical similarity and training
the word embedding models.
5 EVALUATION
In order to produce a dataset consisting of ground
truth values, we matched the food products by us-
ing their corresponding EAN codes. With this, we
obtained 438 food products that are available in both
retailers’ catalogues.
Since Retailer1 has significantly fewer food prod-
ucts to offer, we find the five most similar food prod-
ucts from Retailer2 and check whether one of them
corresponds to the food product matched by the EAN
code. If so, we count this as a positive example, oth-
erwise as a negative one.
For computing the similarity between the food
products, we fixed the dimensionality to 200, used
a sliding window of 5 for both the word2vec and
GloVe models. Additionally, word2vec was trained
using CBOW. Lastly, the lexical similarity measure
was computed according to formulas 9 and 10.
The hyper-parameter choice was made after evalu-
ating the models described in Section 3.2. The model
with the best empirical results proved to be the ones
with a dimensionality of 200 and a sliding window of
5. Therefore, we use this model in our final evalua-
tion.
To gain some insight regarding the embedding
training process, it is useful to look at the values of
0.000
0.001
0.002
0.003
0.004
0.005
0.006
0.007
0.008
0.009
0.010
0.011
0.012
0.013
0.014
0.015
0.016
0.017
0.018
0.019
0.020
0.021
0.022
0.023
0.024
0.025
0.026
0.027
0.028
0 200 400 600 800 1000 1200 1400
Number of iterations
Loss
Loss while training GloVe for each iteration (epoch)
Figure 1: The loss function value plotted over the number
of iterations (epochs) while training GloVe embeddings for
the dataset.
the loss function for each training iteration (epoch).
On Figure 1 these values are plotted. It is evident that
the loss improvement plateaus after a certain point,
so it is computationally beneficial to stop the training
process after this plateau is reached. This also pre-
vents over-fitting the training data, which is important
if new data is added for future evaluation. In this case,
the plateau is somewhere around iteration 800, which
is where it is favorable to stop the training process.
5.1 Results and Discussion
In Table 2, we present the results of the evaluation
on the dataset of 438 food products having similar,
but not the same, food names and the same EAN bar-
codes. It is interesting to note that both summing and
averaging the vector embeddings provided identical
predictive results. Additionally, in Table 3, the accu-
racy of each model is presented.
Table 2: Evaluation results for each model.
Word2vec GloVe Lexical sim.
Positives 271 238 329
Negatives 167 200 109
Table 3: Accuracy for each model.
Model Accuracy
Word2Vec 0.61872
GloVe 0.54338
Lexical 0.75114
Food Data Integration by using Heuristics based on Lexical and Semantic Similarities
213

Looking at Table 2 it follows that out of a total of
438 food products, 271 were in the top five predic-
tions when using the word2vec model; 238 were in
the top five predictions when using the GloVe model
and 329 were in the top five predictions when using
the lexical model.
Further insight into the matching evaluation can
be obtained by counting how many food products
were not found (Negatives) for all models. Specif-
ically, we count how many food products were not
positively matched by any model at all. Taking this
into consideration, 355 out of a total of 438 products
in the evaluation set were positively matched by at
least one of the models. These results are additionally
presented in Table 4.
Table 4: Accuracy for each model.
Total positively matched Accuracy
355 0.81050
For example, in Table 5 the top five matches for
a food product (in this case “jogurt mu borovnica
1,3mm 1l”, i.e blueberry fruit yogurt) from each
model is presented. In this example, one of each five
matches is a positive match in the ground truth evalu-
ation dataset.
Additionally, even if the matches from the se-
mantic models do not include the ground truth prod-
uct, they still convey significant semantic information
about the food products. In Table 6 we provide one
such example, where it is evident that all five matches
are related to the food product of interest. In this
example, all food products are related to “sir”, i.e.
cheese. Therefore, the semantic models are not lim-
ited by the lexical information of the food product
name and can be used to match food concepts in cases
where there is low lexical similarity, but the semantic
similarity is high.
One thing to notice is that using lexical similar-
ity as a heuristic will always yield better results when
considering the task of matching branded food prod-
ucts, while semantic similarity as a heuristic can pro-
vide more insight when considering other tasks, such
as matching food data for imputing missing nutrient
values from food composition databases.
One weakness of the semantic models is that they
are using embeddings on a word level. For our fu-
ture work, we are planning to explore more advanced
textual representational models such as BERT (De-
vlin et al., 2018), RoBERTa (Liu et al., 2019), XL-
Net (Yang et al., 2019), and ALBERT (Lan et al.,
2019). There are pre-trained models for English text
for all of these embedding methods. However, in or-
der for these methods to be used with Slovenian text,
we should acquire more data and train the correspond-
ing models. Additionally, the same methodology de-
scribed in this paper can be generalized and applied to
any language, provided sufficient pre-trained models,
or data to train the required models on, exist.
6 CONCLUSIONS
The problem of food data integration becomes espe-
cially important with one of the 2030 development
goal of the United Nations, which states “End hunger,
achieve food security and improved nutrition and pro-
mote sustainable agriculture” (Lartey, 2015). With
the huge amount of food and nutrition-related data
that is collected in the last 10 years, there is a need
for data normalization techniques that will link these
data sets.
In this paper, we propose two heuristics that can
be used for matching food products represented by
their non-English descriptions (i.e. Slovenian). To
give a matching score of a pair of food products, the
first one is based on lexical similarity, and the match-
ing score is a probability event define as a product
of similarity between the set of nouns that appear in
their names and the joint set of adjectives and verbs.
The second one is based on semantic similarity and
uses word embeddings. For it, first vector represen-
tations (i.e. embeddings) for the lemmas of nouns,
adjectives, and verbs, which appear in food products
names, are learned. After that, the vector representa-
tion of a food product name can be calculated as an
average or sum from the vector representations of the
lemmas of the words from which it consists of. The
matching score of a pair of food products is the cosine
similarity between the vector representations of their
names.
We evaluated the proposed heuristics by mapping
food products from two online grocery stores. We
compared the results for the proposed heuristics using
a data set of 438 food product pairs, which present
the ground truth. They were obtained by matching
the food products from every pair based on their EAN
codes. By applying the proposed heuristics, for the
first food product from every pair, we returned the 5
most similar food products, and we checked whether
one of them corresponds to the second food product
from the pair. Experimental results showed that the
best semantic models achieve an accuracy of 62%,
while the lexical model outperforms this with an ac-
curacy of 75%. Additionally, if all the models are
considered together, an accuracy of 81% is obtained.
For our future work, we are planning to explore
more advanced textual representational methods (i.e.
HEALTHINF 2020 - 13th International Conference on Health Informatics
214

Table 5: Positive match food product examples.
(a) Word2Vec model
Food product: jogurt mu borovnica 1,3mm 1l
Match 1: sadni jogurt borovnica 1,3 m. m. mu 500g
Match 2: sadni jogurt borovnica super 150g
Match 3: sadni jogurt s chia semeni crni ribez borovnica 1,5 m. m. meggle 330g
Match 4: tekoci jogurt borovnica mu 1l
Match 5: sadni bio jogurt s senenim mlekom borovnica 150g
(b) GloVe model
Food product: jogurt mu borovnica 1,3mm 1l
Match 1: tekoci jogurt borovnica mu 1l
Match 2: tekoci jogurt kramar 500g
Match 3: grski jogurt z borovnico 0 m. m. total 170g
Match 4: sadni jogurt borovnica 1,3 m. m. mu 500g
Match 5: lca jogurt nula 150 g borovnica 3,3 m. m.
(c) Lexical model
Food product: jogurt mu borovnica 1,3mm 1l
Match 1: tekoci jogurt borovnica mu 1l
Match 2: sadni jogurt borovnica 1,3 m. m. mu 500g
Match 3: sadni jogurt borovnica 1,2 m. m. lca 180g
Match 4: grski jogurt z borovnico 0 m. m. total 170g
Match 5: sadni jogurt borovnica super 150g
Table 6: Positive match food product examples.
(a) Word2Vec model
Food product: topljeni sir kiri navadni 100g
Match 1: topljeni sir slovenka 200g
Match 2: topljeni sir 140g
Match 3: naravni topljeni sir president 140g
Match 4: topljeni sir camembert president 125g
Match 5: topljeni sir gauda v listicih kaeserei champignon 150g
(b) GloVe model
Food product: topljeni sir kiri navadni 100g
Match 1: topljeni sir slovenka 200g
Match 2: topljeni sir klasik zdenka 140g
Match 3: topljeni sir klasik zdenka 280g
Match 4: topljeni sir cardas zdenka 140g
Match 5: topljeni sir v listicih klasik 150g
embeddings methods), and also use the information
from graph-based embeddings to improve the match-
ing process.
ACKNOWLEDGEMENTS
This work was supported by the project from the
Slovenian Research Agency (research core funding
No. P2-0098), and the European Union’s Hori-
zon 2020 research and innovation programme (grant
agreements No. 863059 and No. 769661).
Information and the views set out in this publica-
tion are those of the authors and do not necessarily re-
flect the official opinion of the European Union. Nei-
ther the European Union institutions and bodies nor
any person acting on their behalf may be held respon-
sible for the use that may be made of the information
contained herein.
Food Data Integration by using Heuristics based on Lexical and Semantic Similarities
215

REFERENCES
Aronson, A. R. (2001). Effective mapping of biomedical text
to the umls metathesaurus: The metamap program.
Aronson, A. R. (2006). Metamap: Mapping text to the umls
metathesaurus. Bethesda, MD: NLM, NIH, DHHS,
pages 1–26.
Bodenreider, O. (2004). The unified medical language sys-
tem (umls): integrating biomedical terminology. Nu-
cleic acids research, 32(suppl 1):D267–D270.
Cestnik, B. et al. (1990). Estimating probabilities: a crucial
task in machine learning. In ECAI, volume 90, pages
147–149.
Collier, N., Oellrich, A., and Groza, T. (2015). Concept se-
lection for phenotypes and diseases using learn to rank.
Journal of biomedical semantics, 6(1):24.
Devlin, J., Chang, M.-W., Lee, K., and Toutanova, K.
(2018). Bert: Pre-training of deep bidirectional trans-
formers for language understanding. arXiv preprint
arXiv:1810.04805.
Donnelly, K. (2006). Snomed-ct: The advanced terminol-
ogy and coding system for ehealth. Studies in health
technology and informatics, 121:279.
(EFSA), E. F. S. A. (2015). The food classification and de-
scription system foodex 2 (revision 2). EFSA Support-
ing Publications, 12(5):804E.
Eftimov, T., Ispirova, G., Finglas, P., Korosec, P., and
Korousic-Seljak, B. (2018). Quisper ontology learn-
ing from personalized dietary web services. In KEOD,
pages 277–284.
Eftimov, T., Koro
ˇ
sec, P., and Korou
ˇ
si
´
c Seljak, B. (2017).
Standfood: standardization of foods using a semi-
automatic system for classifying and describing foods
according to foodex2. Nutrients, 9(6):542.
Eftimov, T. and Seljak, B. K. (2015). Pos tagging-
probability weighted method for matching the internet
recipe ingredients with food composition data. In 2015
7th International Joint Conference on Knowledge Dis-
covery, Knowledge Engineering and Knowledge Man-
agement (IC3K), volume 1, pages 330–336. IEEE.
Grcar, M., Krek, S., and Dobrovoljc, K. (2012). Obeliks:
statisticni oblikoskladenjski oznacevalnik in lematiza-
tor za slovenski jezik. In Zbornik Osme konference
Jezikovne tehnologije, Ljubljana, Slovenia.
Griffiths, E. J., Dooley, D. M., Buttigieg, P. L., Hoehn-
dorf, R., Brinkman, F. S., and Hsiao, W. W. (2016).
Foodon: A global farm-to-fork food ontology. In
ICBO/BioCreative.
Ispirova, G., Eftimov, T., Korousic-Seljak, B., and Korosec,
P. (2017). Mapping food composition data from var-
ious data sources to a domain-specific ontology. In
KEOD, pages 203–210.
Korenius, T., Laurikkala, J., J
¨
arvelin, K., and Juhola, M.
(2004). Stemming and lemmatization in the clustering
of finnish text documents. In Proceedings of the thir-
teenth ACM international conference on Information
and knowledge management, pages 625–633. ACM.
Kosub, S. (2019). A note on the triangle inequality for the
jaccard distance. Pattern Recognition Letters, 120:36–
38.
Lan, Z., Chen, M., Goodman, S., Gimpel, K., Sharma, P.,
and Soricut, R. (2019). Albert: A lite bert for self-
supervised learning of language representations. arXiv
preprint arXiv:1909.11942.
Lartey, A. (2015). End hunger, achieve food security and im-
proved nutrition and promote sustainable agriculture.
UN Chronicle, 51(4):6–8.
Liu, Y., Ott, M., Goyal, N., Du, J., Joshi, M., Chen, D.,
Levy, O., Lewis, M., Zettlemoyer, L., and Stoyanov, V.
(2019). Roberta: A robustly optimized bert pretraining
approach. arXiv preprint arXiv:1907.11692.
Lu, Z., Kao, H.-Y., Wei, C.-H., Huang, M., Liu, J., Kuo, C.-
J., Hsu, C.-N., Tsai, R. T.-H., Dai, H.-J., Okazaki, N.,
et al. (2011). The gene normalization task in biocre-
ative iii. BMC bioinformatics, 12(8):S2.
M
`
arquez, L. and Rodr
´
ıguez, H. (1998). Part-of-speech tag-
ging using decision trees. In European Conference on
Machine Learning, pages 25–36. Springer.
Metzler, D., Dumais, S., and Meek, C. (2007). Similar-
ity measures for short segments of text. In Euro-
pean conference on information retrieval, pages 16–
27. Springer.
Mikolov, T., Chen, K., Corrado, G., and Dean, J. (2013a).
Efficient estimation of word representations in vector
space. arXiv preprint arXiv:1301.3781.
Mikolov, T., Sutskever, I., Chen, K., Corrado, G. S., and
Dean, J. (2013b). Distributed representations of words
and phrases and their compositionality. In Advances
in neural information processing systems, pages 3111–
3119.
Morgan, A. A., Lu, Z., Wang, X., Cohen, A. M., Fluck, J.,
Ruch, P., Divoli, A., Fundel, K., Leaman, R., Haken-
berg, J., et al. (2008). Overview of biocreative ii gene
normalization. Genome biology, 9(2):S3.
Pennington, J., Socher, R., and Manning, C. (2014). Glove:
Global vectors for word representation. In Proceedings
of the 2014 conference on empirical methods in natu-
ral language processing (EMNLP), pages 1532–1543.
Popovski, G., Korou
ˇ
si
´
c Seljak, B., and Eftimov, T. (2019).
Foodontomap: Linking food concepts across differ-
ent food ontologies. In Proceedings of the 11th In-
ternational Joint Conference on Knowledge Discov-
ery, Knowledge Engineering and Knowledge Manage-
ment - Volume 2: KEOD,, pages 195–202. INSTICC,
SciTePress.
Pramanik, S. and Hussain, A. (2019). Text normalization us-
ing memory augmented neural networks. Speech Com-
munication, 109:15–23.
Savova, G. K., Masanz, J. J., Ogren, P. V., Zheng, J., Sohn,
S., Kipper-Schuler, K. C., and Chute, C. G. (2010).
Mayo clinical text analysis and knowledge extraction
system (ctakes): architecture, component evaluation
and applications. Journal of the American Medical In-
formatics Association, 17(5):507–513.
Schuyler, P. L., Hole, W. T., Tuttle, M. S., and Sherertz,
D. D. (1993). The umls metathesaurus: representing
different views of biomedical concepts. Bulletin of the
Medical Library Association, 81(2):217.
Voutilainen, A. (2003). Part-of-speech tagging. The Oxford
handbook of computational linguistics, pages 219–
232.
Yang, Z., Dai, Z., Yang, Y., Carbonell, J., Salakhutdinov,
R., and Le, Q. V. (2019). Xlnet: Generalized autore-
gressive pretraining for language understanding. arXiv
preprint arXiv:1906.08237.
HEALTHINF 2020 - 13th International Conference on Health Informatics
216
