Comparison of Binary Images based on Jaccard Measure using
Symmetry Information
Sofia Fedotova
a
, Olesia Kushnir
b
and Oleg Seredin
c
Tula State University, Tula, Russian Federation
fedotova.sonya@gmail.com, kushnir-olesya@rambler.ru, oseredin@yandex.ru
Keywords:
Comparison of Binary Raster Images, Jaccard Measure, Reflection Symmetry, Symmetry Axis of the Shape.
Abstract:
Method of comparing binary raster images using information about the axes of symmetry of the shapes is
proposed, which will allow to take into account the translation, rotation and scaling of a pair of images. The
symmetry axis of the figure is searched by one of the previously developed methods: based on the skeleton
representation of the figure (Kushnir et al., 2016), the adjustment of the skeleton axis or exhaustive search
(Kushnir et al., 2019). Jaccard measure is used as a measure of similarity. Three comparison algorithms were
developed. The paper demonstrates that using information about the symmetry of the shapes with simple
principle of comparison as the Jaccard measure allows to obtain significant results. The possibility of using
this approach for image classification is also investigated. The algorithms were experimentally studied on the
“Flavia” and “Butterflies” datasets.
1 INTRODUCTION
The task of comparing binary raster images arises in
many applications, such as classifying objects (for ex-
ample, when determining the type of leaves by their
shape) or detecting tumors in medical images.
When comparing images, it is necessary to con-
sider that objects can be of different sizes, shifted rel-
ative to each other and rotated. To solve this problem,
it is proposed to use the axes of approximate sym-
metry as the basis for matching the compared figures.
Obviously, it is quite easy to bring two images to the
same size, location and angle of inclination using in-
formation about the location and size of the axes of
symmetry.
The task of symmetry detection and symmetry
measure evaluation for 2D shapes is well-known.
There are both effective and efficient methods for its
solution. In this work we use an exact algorithm for
finding the axis of reflection symmetry based on the
Jaccard similarity of two image parts (for binary sets
it is also known as Tanimoto (Lesot et al., 2009)):
µ(B) =
|
S(B) ∩ S(B
r
)
|
|
S(B) ∪ S(B
r
)
|
, (1)
a
https://orcid.org/0000-0002-3436-6540
b
https://orcid.org/0000-0001-7879-9463
c
https://orcid.org/0000-0003-0410-7705
where B – binary image, the brightness of the black
pixels denote 1, white – 0; B
r
– reflection of the binary
image B with respect to a line, S(B) – set of pixels
belonging to the image B, the brightness of which is
equal to 1. The measure possesses the basic “good”
measure properties: 0 ≤ µ(B) ≤ 1, and µ(B) = 1, if B
– absolutely symmetric, and µ(B) = 0, if B and B
r
not
overlapped.
The exact algorithm for determining reflection
symmetry routine iterates over all possible lines
crossing the figure and finds the one for which the
symmetry measure (Jaccard similarity) is maximum.
This line will be the axis of reflection symmetry of the
image.
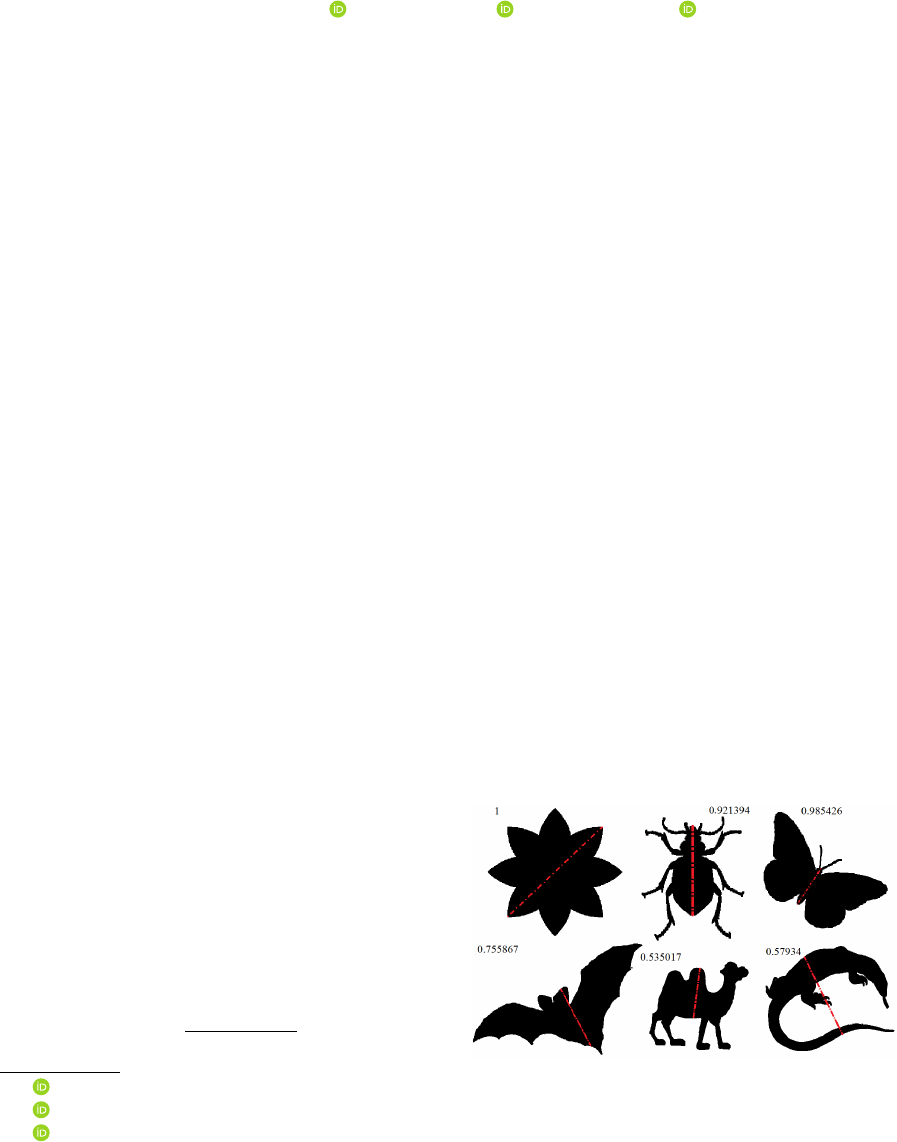
Figure 1: Examples of images with higher (top) or lower
(bottom) value of symmetry measure evaluated on the basis
of Jaccard similarity.
The purpose of the work is to study the possibil-
ity of image comparison using information about the
symmetry. Figure 1 shows examples of axes for both
perfectly symmetrical images (a figure with a Jaccard
measure equal to 1) and asymmetric ones. In identi-
cal images, the axes of symmetry will be located on
the figure in approximately the same place. For al-
most similar images (for example, images of butter-
flies with opened wings), the axis of symmetry will
always be located along the body. Thus, on the found
axis of symmetry, two images of butterflies will be
correctly combined, and it will be necessary to cal-
culate the measure of similarity. In this work we use
the Jaccard similarity as a measure of the similarity of
two images. We will not use the comparison of parts
of one image, but two different shapes – A and B:
µ(A, B) =
|
S(A) ∩ S(B)
|
|
S(A) ∪ S(B)
|
. (2)
The quality of the obtained measure and its appli-
cation for image recognition are also investigated.
2 RELATED WORKS
The task of symmetry detection and symmetry mea-
sure evaluation for 2D shapes is well-known, and
there are many effective methods for its solution
based on: 1) Fourier series expansion of paramet-
ric contour representation (Van Otterloo, 1988), 2)
contour representation by turning function (Sheynin
et al., 1999), 3) contour representation by critical
points and computation of similarity measure for two
sub-contours via vectors of geodesic distances (Yang
et al., 2008), 4) model of Electrical Charge Distri-
bution on the Shape (ECDS) (Li et al., 2014), 5)
Boundary-Skeleton Function (BSF) (Niu et al., 2015),
6) pair-wise comparison of sub-sequences of skeleton
primitives (Kushnir et al., 2016), 7) Fourier descriptor
of the image contour (Mestetskiy and Zhuravskaya,
2019), 8) image gradient (Sun and Si, 1999).
However, there are a few works devoted to the use
of the symmetry information in other applications,
such as image comparison. In particular, (Hauagge
and Snavely, 2012) describes the use of local symme-
tries of architectural structures to compare images of
buildings.
3 COMPARISON OF IMAGES
In this paper, we propose to use information about the
symmetry of shapes to compare images. We will rely
on the procedures for finding the axis of symmetry
proposed in previous works. To achieve reliability
in the verification of the proposed procedure, an ex-
act algorithm for determining the reflection symmetry
of binary raster images (Kushnir et al., 2016) and its
parallel version (Fedotova et al., 2017) will be used,
requiring a complete search of all potential axes of
symmetry. Calculations were carried out on a super-
computer, however, in the works (Kushnir et al., 2016;
Kushnir et al., 2019) methods of significant accelera-
tion of the computational procedure were developed.
This algorithm searches for the axis of symmetry
by iterating over all possible lines passing through a
pair of points on the contour of the figure. The value
of symmetry is calculated with respect to each line.
The line with respect to which the symmetry measure
is maximal is considered to be the symmetry axis.
To estimate the value of symmetry, the Jaccard mea-
sure is used, which shows the degree of similarity of
two sets. The sets are the pixels of the binary image.
When searching for a symmetry measure, the image
is mirrored relative to the selected line and overlays
the original one. Consequently, the areas of intersec-
tion and union of two sets are formed, and the Jaccard
measure is calculated as their ratio (1). It is worth not-
ing that the axes of symmetry found with the help of
the Jaccard measure do not always coincide with the
visual assessment by a person, a discussion is given
in Section 7 of the paper (Kushnir et al., 2016).
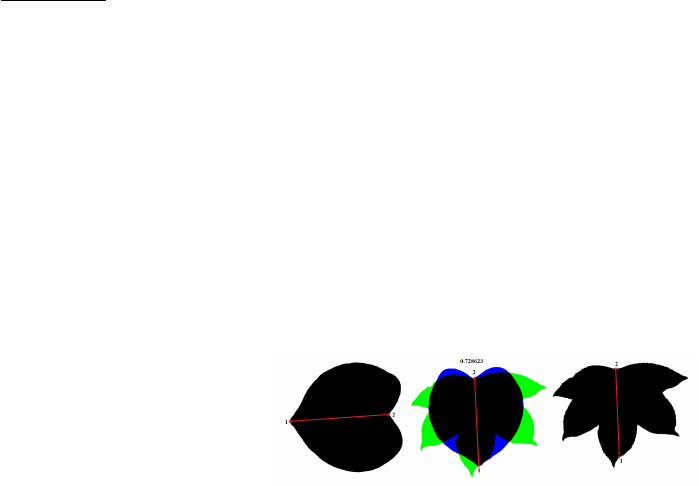
After the symmetry axes are found for the pair of
images being compared, it is proposed to align the
axes in the images with each other and calculate the
Jaccard measure (2), which will show the value of
similarity, as shown in figure 2.
Figure 2: Example of intersection of two images (black
color in the central shape indicates the intersection zone,
blue and green-areas that do not match).
It is obvious that two different shapes can be dif-
ferent sizes, rotated through a certain angle and bi-
ased. Just using information about the location of the
axes of symmetry we will achieve invariance to the
shift, rotation and scale.
In similar images, the axes of symmetry will be
in the shape approximately the same. Knowing the
location of the axis of symmetry, we can calculate
the affine transformation, which will allow to over-
lay (match) one image on another, aligning their axes
of symmetry.
Three points are required to calculate the affine
transformation. The axis of symmetry is defined by
two points of intersection of the line with the contour.
The third point is defined on the median perpendicular
to the axis of symmetry at a distance equal to half of
the symmetry segment. The coordinates of the third
point are calculated as:
x =
a
p
k
2
n
+ 1
+ x
0
, y =
k
n
a
p
k
2
n
+ 1
+ y
0
, (3)
where a is half the length of the axis of symmetry
k
n
is the tangent of the slope of the line orthogonal
to the axis of symmetry; x
0
, y
0
– the coordinates of
the center of the segment lying between the points of
symmetry axis.
The two images are overlaid on three points which
are combined on corresponding numbers by affine
transformation (the first point with the first, the sec-
ond with the second, the third with the third). The
similarity measure (Jaccard measure) is calculated.
However, it is noted that the image orientation is
not known in advance (who knows where ”top” and
where ”the bottom”), and therefore, the imposition of
the axes must be performed two times. In addition, we
use a reflection copy of one of the compared images.
Of the four measures obtained, the best one will be
chosen, which will be considered a measure of the
similarity of the two images.
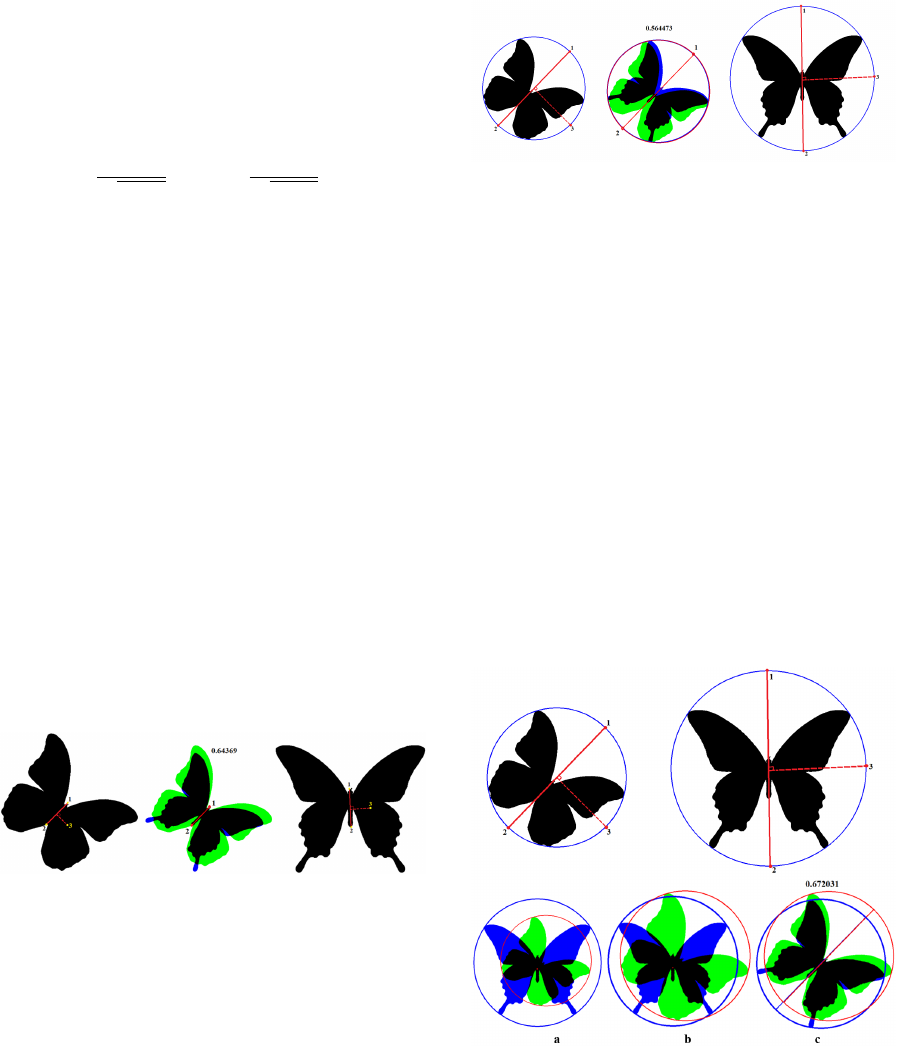
Figure 3 shows an example of an overlay of two
images: black area corresponds to the intersection of
two sets, blue and green areas correspond to the mis-
matched parts of the two images.
Figure 3: An example of matching two images by three
points and corresponding measure of similarity.
Two more variants of algorithm were also devel-
oped. In the second algorithm it is proposed to use
the intersection points of the symmetry axis with the
minimum bounding circle around the binary image.
Figure 4 shows an example of combining two images
at the intersection of the axis of symmetry with the
circumscribed circle.
As in the first version of the overlay, the orienta-
tion of the image is not known in advance, so the axis
overlay must be performed twice. Of the two mea-
sures obtained, the best one will be chosen, which will
be considered a measure of the similarity of the two
images.
Figure 4: An example of combining two images on three
points using the intersection points of the axis of symmetry
with the circle described near the figure.
The third algorithm also uses the intersection
points of the symmetry axis with the circumscribed
circle, but the overlay operation is performed in two
stages. First, it is required to determine the centers of
the segments of the axes of symmetry, bounded by the
contour of the figure. Images are aligned so that these
centers coincide. The scaling factor is calculated as
the ratio of the radiuses of the circumscribed circles.
In order for the axes of two figures to lie on the same
straight line, the rotation matrix is calculated. For an
image that has a longer axis of symmetry, the opera-
tions of transfer, scaling, and rotation are applied se-
quentially. For the obtained images, the Jaccard mea-
sure is calculated. Figure 5 shows an example of com-
bining pair of images using three points by the third
algorithm with every process stage explanation. It can
be noted that the three proposed algorithms give dif-
ferent measures of similarity on a pair of images.
Figure 5: Example of step-by-step alignment of two images
on three points using the third algorithm: a) alignment of
image centers, b) scaling, c) rotation.
4 EXPERIMENTAL STUDY
The developed methods were experimentally studied
on two image datasets: ”Butterflies” dataset (accessi-
ble at http://lda.tsu.tula.ru/papers/ Butterflies.zip) and
the well-known FLAVIA binary image dataset (Yang
et al., 2008).
The ”Butterfly” dataset contains 30 images with
resolution of 400 by 600 pixels which were found on
public Internet resources and binarized.
Symmetry axes and Jaccard measures for images
from the ”Butterfly” and FLAVIA datasets were ob-
tained by an exact algorithm implemented on super-
computer ”Lomonosov” (Kushnir et al., 2019; Vo-
evodin et al., 2019).
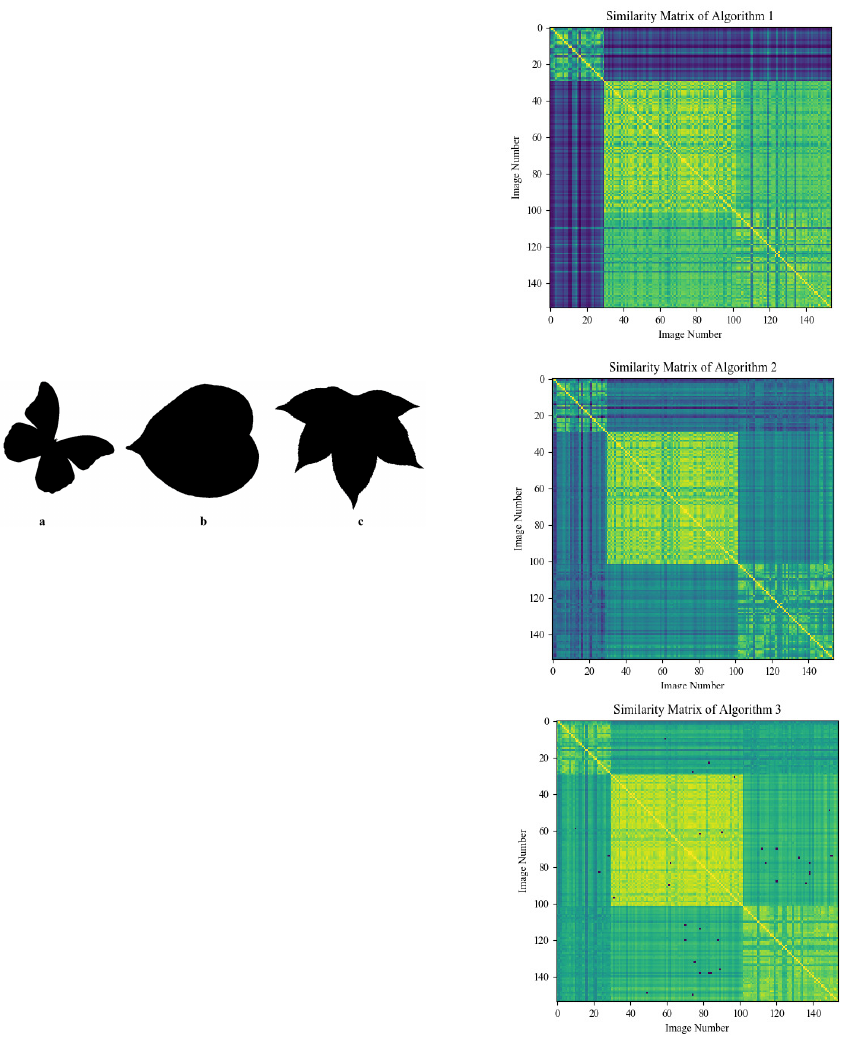
Class ”Butterflies” and 4, 8 classes from FLAVIA
dataset were taken for experiment. Class 4 of leaves
from the FLAVIA dataset contains 72 images, class
8 –52 images. Figure 6 shows some sample images
from each class.
Figure 6: Examples of images from class a) ”Butterflies”,
b) class 4 from FLAVIA leaf base, c) class 8 from FLAVIA.
To assess the applicability of the proposed im-
age comparison approach in the classification prob-
lem, a similarity matrix among all objects of the three
classes was calculated. The result is shown in Figure
7.
In Figure 7 different colors indicate the values of
the similarity measure (Jaccard measure) for 154 im-
ages of three classes of objects. Dark blue color corre-
sponds to the minimum of Jaccard measure (equal to
zero), yellow – the maximum (equal to one). Compar-
ing the object with itself gives a measure of similarity
equal to 1 - the bright yellow diagonal of the matrix.
The figure highlights the first class – the Butterfly
class for all variants of the comparison algorithm. The
class 4 of leaves is well separated by algorithms 2 and
3. However, class 8 is not so well separated.
Figure 8 shows the mapping of the distance matrix
to the three-dimensional feature space. Distances are
obtained as a addition of the Jaccard measure to unit
µ(A, B) = 1 − µ(A, B). FastMap algorithm (Faloutsos
and Lin, 1995) was used to visualize the distance ma-
trix.
To determine the possibility of solving classifi-
cation problems on the obtained similarity matrices,
the so-called Bulls-eye test was performed (Bai et al.,
2014). It is traditionally used to assess the quality
of object comparison procedures in recognition prob-
lems. The significance of the study is as follows. For
a particular object a given number M of its nearest
Figure 7: Similarity matrix among objects of classes But-
terflies, 4 and 8 classes from FLAVIA.
neighbors is determined, among them the proportion
m of objects of the same class as the original object is
calculated. The ratio m to M averaged for all objects
determines the ability of the developed algorithms to
produce compact groups for different classes. Fig-
ure 9 shows graphs of the dependence of recognition
quality on the number of nearest neighbors for the
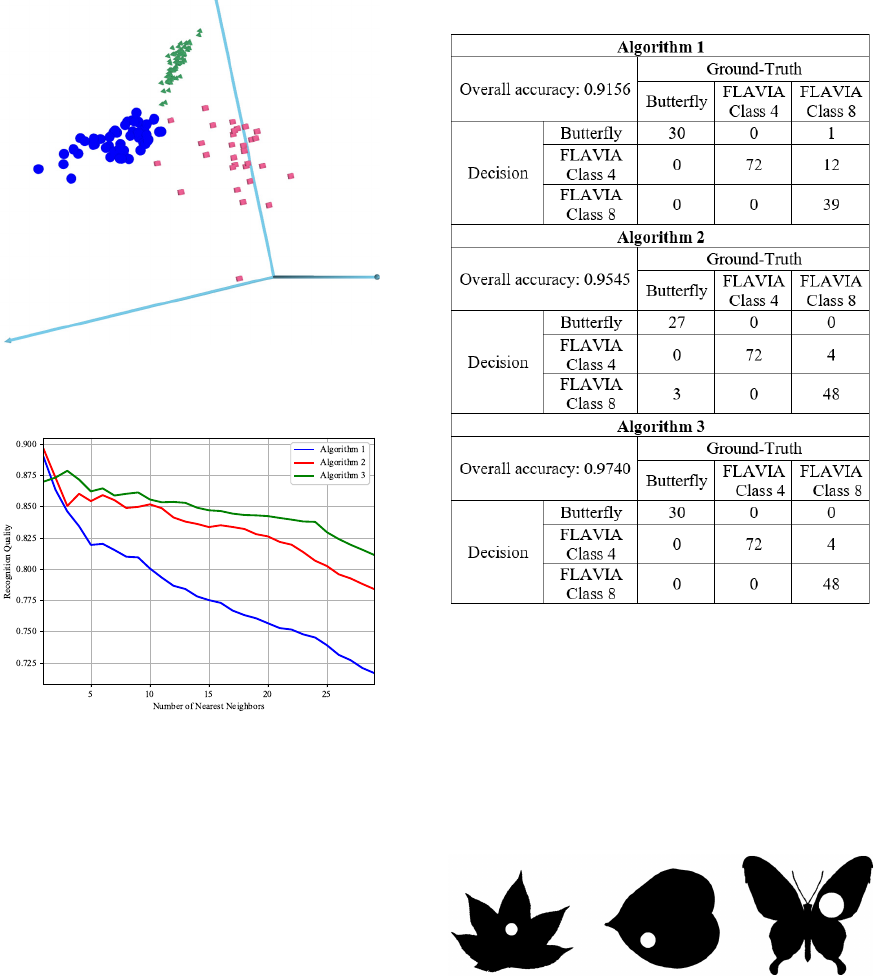
Figure 8: Visualization of distance matrix between ob-
jects of classes “Butterflies” (square markers), 4 (triangular
markers) and 8 (round markers) classes from FLAVIA.
Figure 9: Graphs of recognition quality dependence on the
number of nearest neighbors for three variants of image
overlay algorithms.
three developed variants of the image overlay algo-
rithm.
In addition, the study of the obtained similarity
measures for a simple method of recognition-the al-
gorithm of the nearest centers. In particular, in each of
the classes were found ”centers” - the significance of
the objects with the maximum total score of similarity
for objects within the class. Recognition is performed
as a calculation of similarity with class centers.
Classification accuracy above 0.9 was obtained
for all three proposed algorithms. The results show
that this measure can be apply for image comparing.
In particular, the proposed measure can be used in
classification problems as an additional characteris-
tic (modality) in featureless pattern recognition based
only on pairwise dis(similarity) function.
Table 1: The confusion matrix of nearest centers method.
5 IMAGES WITH ”HOLES”
There are such morphologically complex objects (fig-
ures) that not only have an external contour, but also
contain holes, that is, have internal contours, as shown
in figure 10. It is obvious that holes shift the axis of
symmetry in such images and image comparing pro-
cedure will give different result.
Figure 10: Examples of images with randomly added
”holes”.
Let us analyze how stable the proposed measure
of similarity of images will be in case of changing the
axis of mirror symmetry in the presence of holes in the
image. In our experiment, we find the axis of symme-
try in the image without holes (preliminary filling of
internal contours is carried out), then the measure of
similarity with respect to this line is calculated, but al-
ready in the image with a hole. As an alternative, you
can consider the option when the axis of symmetry is
determined directly from the image with holes with-
out filling. Apparently, this approach can be used in
cases where a comparison with an accurate reference
image is performed, for example, the silhouette of a
part on a conveyor is analyzed for the purpose of its
rejection.
In this experiment, holes were artificially added
to the images. In one case the hole was set a
random center location and a radius in the range
[0.01R;0.1R], where the radius described around the
figure of the circle, the other radius is specified as a
range [0.01R;0.2R].
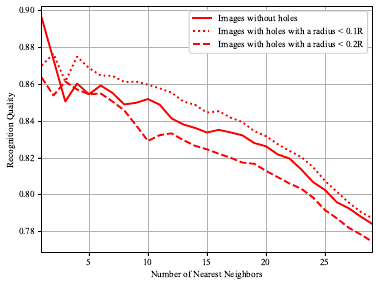
Figure 11 shows graphs of the dependence of
recognition quality on the number of nearest neigh-
bors for images without holes, images with holes with
a radius not exceeding 0.1 and 0.2 radius of the cir-
cumscribed circle. Algorithm 2 was used to compare
the images in this experiment. We were puzzled by
the fact that the results with small holes turned out to
be better than for the original images, in future studies
we will try to answer this question.
Figure 11: Graphs of the dependence of recognition qual-
ity for Algorithm 2 on the number of nearest neighbors for
images with holes.
From the analysis of the curves in figures 9-11
and table 1 as a whole, it can be concluded that the
proposed simple procedure can not only give quite
acceptable quality in the problems of recognizing
shapes, but also solve the problem of holes in the
compared shapes.
6 CONCLUSIONS
The paper shows that even such a simple principle
of image comparison as the Jaccard measure, but us-
ing information about the symmetry of the compared
figures, allows to obtain a significant results. In par-
ticular, after the symmetry axes are found for a pair
of compared images, it is proposed to combine these
segments with each other and calculate the Jaccard
measure. Three comparison algorithms have been de-
veloped and tested. The idea of method lies in the
sphere of relational discriminant analysis - there is no
need to hand craft some features for particular tasks.
Good pairwise (dis)similarity function translate pto-
blem of classification into the area of featureless pat-
tern recognition. Proposed similarity measure can be
used while solving featureless classification task with
combination of another relational modalities of im-
ages (Mottl et al., 2005).
To determine the possibility of solving classifi-
cation problems on the obtained similarity matrices,
Bull’s-eye test and recognition by the method of near-
est centers were carried out. From the analysis of
the results, it can be concluded that the proposed
simple procedure can not only give quite acceptable
quality (more than 0.9 classification accuracy rate) in
the problems of recognizing shapes, but also possible
to applied for the problem of holes in the compared
shapes.
In our opinion, the use of the axis of symmetry for
image comparison should give a more stable result in
classification problems compared to the method based
on the main axis (PCA) of the figure. We will try to
test this hypothesis in future works.
ACKNOWLEDGEMENTS
The work is supported by the Russian Fund for Basic
Research, grants 18-07-00942, 18-07-01087. The re-
search is carried out using the equipment of the shared
research facilities of HPC computing resources at
Lomonosov Moscow State University.
REFERENCES
Bai, X., Rao, C., and Wang, X. (2014). Shape vocabulary:
A robust and efficient shape representation for shape
matching. IEEE Transactions on Image Processing,
23(9):3935–3949.
Faloutsos, C. and Lin, K.-I. (1995). FastMap: A fast al-
gorithm for indexing, data-mining and visualization
of traditional and multimedia datasets, volume 24.
ACM.
Fedotova, S., Seredin, O., and Kushnir, O. (2017). The par-
allel implementation of algorithms for finding the re-
flection symmetry of the binary images. The Interna-
tional Archives of Photogrammetry, Remote Sensing
and Spatial Information Sciences, 42:179.
Hauagge, D. C. and Snavely, N. (2012). Image matching
using local symmetry features. In 2012 IEEE Con-
ference on Computer Vision and Pattern Recognition,
pages 206–213. IEEE.
Kushnir, O., Fedotova, S., Seredin, O., and Karkishchenko,
A. (2016). Reflection symmetry of shapes based on
skeleton primitive chains. In International Conference
on Analysis of Images, Social Networks and Texts.
Springer.
Kushnir, O., Seredin, O., and Fedotova, S. (2019). Algo-
rithms for adjustment of symmetry axis found for 2d
shapes by the skeleton comparison method. Interna-
tional Archives of the Photogrammetry, Remote Sens-
ing and Spatial Information Sciences, 42(2/W12).
Lesot, M.-J., Rifqi, M., and Benhadda, H. (2009). Similar-
ity measures for binary and numerical data: a survey.
International Journal of Knowledge Engineering and
Soft Data Paradigms, 1(1):63.
Li, Z., Xu, Y., Qu, W., Qi, H., and Cao, J. (2014). Robust
symmetry detection for 2d shapes based on electrical
charge distribution. Journal of Information and Com-
putational Science, 11(9):2887–2894.
Mestetskiy, L. and Zhuravskaya, A. (2019). Method for
assessing the symmetry of objects on digital binary
images based on fourier descriptor. International
Archives of the Photogrammetry, Remote Sensing and
Spatial Information Sciences, 42(2/W12).
Mottl, V., Krasotkina, O., Seredin, O., and Muchnik, I.
(2005). Principles of multi-kernel data mining. In In-
ternational Workshop on Machine Learning and Data
Mining in Pattern Recognition, pages 52–61. Springer.
Niu, D., Zhang, C., Li, W., and Zhou, Y. (2015). A novel ap-
proach for detecting symmetries in two-dimensional
shapes. Journal of Information and Computational
Science, 12(10):3915–3925.
Sheynin, S., Tuzikov, A., and Volgin, D. (1999). Com-
putation of symmetry measures for polygonal shapes.
In International Conference on Computer Analysis of
Images and Patterns, pages 183–190. Springer.
Sun, C. and Si, D. (1999). Fast reflectional symmetry detec-
tion using orientation histograms. Real-Time Imaging,
5(1):63–74.
Van Otterloo, P. J. (1988). A contour-oriented approach to
digital shape analysis.
Voevodin, V. V., Antonov, A. S., Nikitenko, D. A., Shvets,
P. A., Sobolev, S. I., Sidorov, I. Y., Stefanov, K. S.,
Voevodin, V. V., and Zhumatiy, S. A. (2019). Super-
computer lomonosov-2: large scale, deep monitoring
and fine analytics for the user community. Supercom-
puting Frontiers and Innovations, 6(2):4–11.
Yang, X., Adluru, N., Latecki, L. J., Bai, X., and Pizlo, Z.
(2008). Symmetry of shapes via self-similarity. In
International Symposium on Visual Computing, pages
561–570. Springer.
