
Exploring the Dependencies between Behavioral and Neuro-physiological
Time-series Extracted from Conversations between Humans and
Artificial Agents
Hmamouche Youssef
1,2
, Ochs Magalie
1
, Prévot Laurent
2,3
and Chaminade Thierry
4
1
Aix Marseille Université, Université de Toulon, CNRS, LIS, UMR7020, Marseille, France
2
Aix Marseille Université, CNRS, LPL, UMR7309, Aix-en-Provence, France
3
Institut Universitaire de France, Paris, France
4
Aix Marseille Université, CNRS, INT, UMR7289, Marseille, France
Keywords:
Multimodal Signals Processing, Conversation, Machine Learning, Human-human and Human-machine
Interactions, Functional MRI.
Abstract:
Whole-brain neuroimaging using functional Magnetic Resonance Imaging (fMRI) provides valuable data to
localize brain activity in space and time. Here, we use a unique corpus including fMRI and behavior recorded
when participants discussed with a human or a conversational robot. Temporal dynamic is crucial when study-
ing conversation, yet identifying relationship between the participants’ behavior and their brain activity is
technically challenging given the time resolution of fMRI. We propose here an approach developed to extract
neurophysiological and behavioral time-series from the corpus and analyse their causal relationships. Pre-
processing entails the construction of discrete neurophysiological time-series from functionally well defined
brain areas, as well as behavioral time-series describing higher-order behaviors extracted from synchronized
raw audio, video and eyetracking recordings. The second step consists in applying machine learning models
to predict brain activity on the basis of various aspects of behavior given knowledge about the functional role
of the areas under scrutiny. Results demonstrate the specificity of the behaviors allowing the predictions of the
activity in functional brain areas.
1 INTRODUCTION
In neuroimaging, signal processing and machine
learning techniques have become very useful, espe-
cially in explaining or predicting the brain activity
based on external signals related to behavior. Mean-
while, analysis of temporal relationships between be-
havior and brain activity is an important step towards
the investigation of the brain bases of natural social
behaviors. This requires datasets comprising synchro-
nized neurophysiological and behavioral time series
recorded during unconstrained social interactions. In
this paper, we propose to develop an approach to in-
vestigate a fMRI dataset acquired when participants
were having a bidirectional natural conversation with
a fellow human or a conversational robot (Rauchbauer
Birgit et al., 2019). This dataset is unique in that
participants’ behaviour is unconstrained and therefore
different for each individual recording. Thus, the clas-
sical approach of contrasting two or more well con-
trolled experimental conditions can’t be used. The
proposed approach consists instead in using behav-
ioral recordings to predict fMRI responses in local-
ized brain areas.
Existing works (cf. Section 2) have a major draw-
back in the sense that they use one or a small num-
ber of behavioral signals that are derived from very
controlled tasks. Our contribution therefore consists
in handling complex multimodal behavioral signals
acquired during the unconstrained conversation and
derive from them features that are relevant to predict
brain activity in well-defined functional regions of in-
terest. This contribution is divided in two parts. First,
we propose a way of extracting representative time
series(the behavioral features) from multimodal be-
havioral data acquired when participants discuss with
a fellow human or a robot. These recordings in-
clude speech produced by the two interlocutors, as
well as eyetracking signals of the participant while
viewing videos of the human or artificial interlocu-
tor. Then, we propose an approach to predict the
discretized BOLD (Blood-Oxygen-Level-Dependent)
signal, that measures the hemodynamic changes asso-
ciated with brain activity, in well-defined functional
areas from the behavioral features, using supervised
machine learning algorithms. Our hypothesis is that
Youssef, H., Magalie, O., Laurent, P. and Thierry, C.
Exploring the Dependencies between Behavioral and Neuro-physiological Time-series Extracted from Conversations between Humans and Artificial Agents.
DOI: 10.5220/0008989503530360
In Proceedings of the 9th International Conference on Pattern Recognition Applications and Methods (ICPRAM 2020), pages 353-360
ISBN: 978-989-758-397-1; ISSN: 2184-4313
Copyright
c
2022 by SCITEPRESS – Science and Technology Publications, Lda. All rights reserved
353

only relevant behavioral features will be efficient in
predicting the activity in a given brain area given do-
main knowledge about the function of this area.
The rest of the paper is organized as follows, after
presenting existing related work (Section 2), we de-
scribe the fMRI experiment and recorded behavioral
data in Section 3. Then, we formulate the problem in
Section 4. We then present and discuss our results in
Section 5, and summarize our approach and results in
Section 6.
2 RELATED WORK
In the literature, many approaches based on multi-
ple linear regression have been proposed to address
the problem of fMRI signals prediction. In (Mitchell
et al., 2008), the fMRI neural activation associated to
meanings is predicted based on a large text data. The
brain regions studied are in the sensory-motor cortex.
The model used consists of transforming the meaning
of text into semantic features, then building a regres-
sion model that expresses the fMRI brain activity as
a linear combination of input semantic features. The
authors show a prediction accuracy of 0.62 or higher,
but on each participant independently. This issue has
also been addressed with multi-subject approach, that
is, by concatenating data from multiple subjects. For
example, in (Huth et al., 2016), the goal was to predict
voxels activity measured via the BOLD signal based
on the speech meaning. The used data are collected
from an fMRI experiment performed on 7 subjects.
The brain areas predicted are from the cerebral cor-
tex (the lateral and ventral temporal cortex, lateral and
medial parietal cortex, and superior and inferior pre-
frontal cortex). The methodology adopted is based
first on constructing predictive variables using seman-
tic features extracted from natural language. Sec-
ond, dimension reduction using Principal Component
Analysis (PCA) is applied to reduce the number of
the predictive variables. Then, a prediction model is
learned based on multiple linear regression with regu-
larization to predict the BOLD signal. The prediction
results and the principal components of the predictive
variables are both combined to classify brain areas ac-
cording to the semantic features categories.
In addition to the semantic features, other behav-
ioral signals have been analyzed by studying the ef-
fect of a single predictive variable on the brain ac-
tivity. For example, the reaction time is used to pre-
dict activity in specific brain regions (Yarkoni et al.,
2009). In (Chen et al., 2016), the acoustically-derived
vocal arousal score ((Bone et al., 2014)) is used to
predict the BOLD signal using the Gaussian mixture
regression model. In (Knops et al., 2009), the authors
predict the BOLD signal in the posterior parietal cor-
tex based on eye movement data using a multivariate
regression model.
More general approaches try to predict the brain
activity of various areas using different types of sig-
nals at the same time. For example, in (DeSouza
et al., 2012), correlations are analyzed using linear
regression between the BOLD signal and behavioral
features computed from observed facial expressions,
reaction time and eyetracking data.
3 DATASETS ACQUISITION AND
PROCESSING
In this section, we describe the experimental
paradigm, the data recorded in this experiment, and
describe our analysis. The data is collected from
an fMRI experiment described in (Rauchbauer Birgit
et al., 2019).
The experiment involves twenty five participants,
and consists of four sessions, each containing six con-
versations of 60 seconds each, three with a human and
three with a conversational robot alternatively. A "ad-
vertising campaign" provides a cover story: partici-
pants are informed that they should guess what is the
message brought by images in which the fruits appear
either as ’superheroes’ or ’rotten fruits’. The conver-
sations between the participant and either a confeder-
ate of the experimenter or a FURHAT conversational
robot (Al Moubayed et al., 2012) (controlled by the
confederate in a Wizard-of-Oz mode, unbeknown to
the participant), are about single images of the pur-
ported "advertising campaign". The experiment de-
sign is illustrated in Figure 1 and two conversational
sequences are illustrated in examples (1) (Subject-
Confederate) and (2) (Subject-Furhat).
(1) C: Elle est vraiment pourrie cette framboise.
S : Oui, je trouve aussi
C : Tu penses ce c’est pour nous faire penser à
quoi?
S : Je sais pas, contre le gaspillage alimen-
taire?
C : Ouais bonne idée. [...]
(2) F: Elle est vraiment pourrie cette framboise.
S : Oui, je trouve aussi
F : Tu penses ce c’est pour nous faire penser à
quoi?
S : Je sais pas, contre le gaspillage alimen-
taire?
F : Ouais bonne idée. [...]
ICPRAM 2020 - 9th International Conference on Pattern Recognition Applications and Methods
354
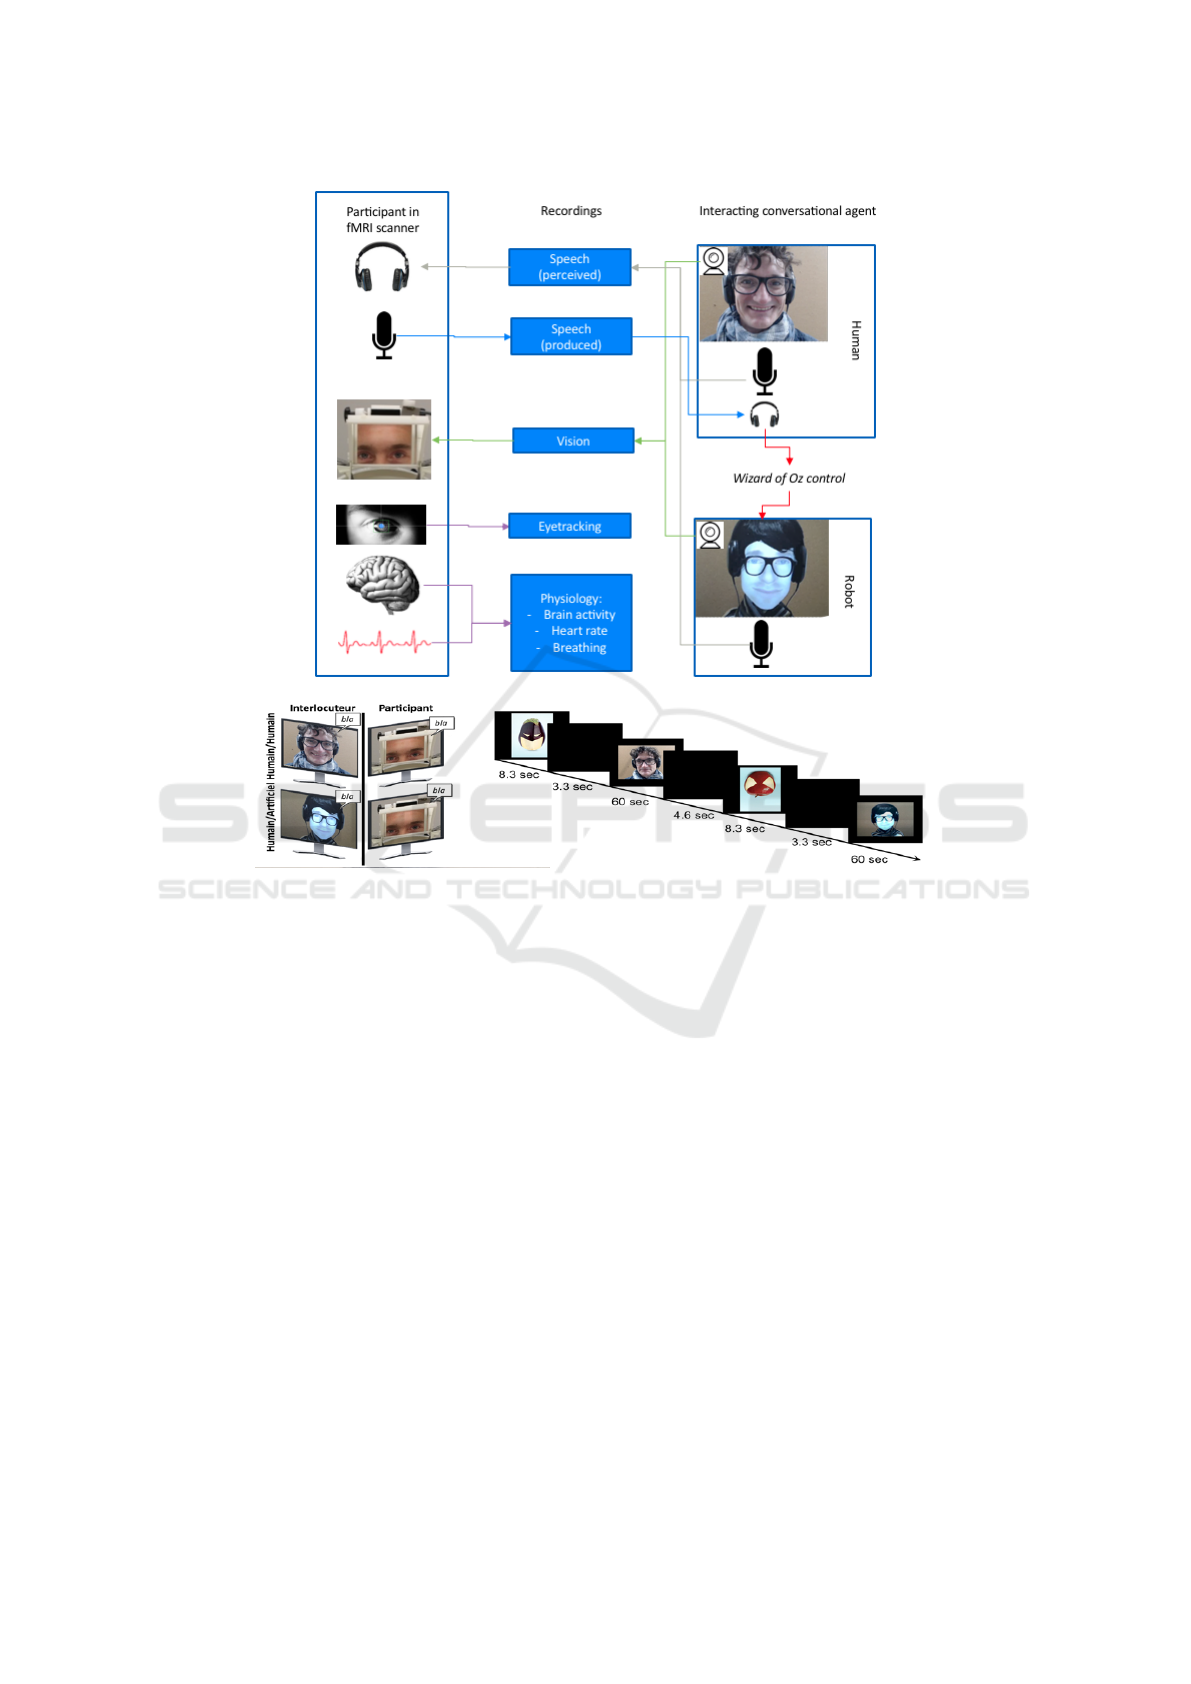
Figure 1: The experiment procedure.
3.1 Time Series Extraction
We process the recorded behavioral and neurophysi-
ological signals in order to extract representative fea-
tures, then we construct structured time series for each
subject that can be used for machine learning models.
This processing is illustrated in Figure 3.
3.1.1 Processing fMRI Signals
Standard functional MRI acquisition procedures were
used, described in details in (Rauchbauer Birgit et al.,
2019). BOLD signal 3-dimensional images are
recorded in the whole brain every 1.205 seconds.
Standard SPM12 preprocessing procedures are used
(Penny et al., 2011), including correction for time
delays in slice acquisition (“slice timing”), image
realignment, magnetic field inhomogeneities correc-
tion, normalization to the standard MNI space using
the DARTEL (Ashburner, 2007) procedure for coreg-
istration of individual participants’ anatomy, and fi-
nally spatial smoothing with a 5-mm full-width half-
maximum 3-dimensional Gaussian kernel. Extraction
of the BOLD signal in regions of interest is performed
using the conn toolbox (Whitfield-Gabrieli and Nieto-
Castanon, 2012), and includes several denoising pro-
cedures, firstly a linear detrending using a high-pass
filter with a threshold of 128 seconds, secondly using
realignment parameters to calculate nuisance regres-
sors related to participants’ movement during scan-
ning, thirdly taking heartbeat and breathing record-
ings to remove physiological artifacts with the PhysIO
toolbox (Kasper et al., 2017), and finally extracting
BOLD signal in the white matter and cerebrospinal
fluid and using the 5 first eigen variate of the time-
series as nuisance representing signal fluctuations in
non-cortical brain tissues. A 275-area parcellation
based on functional and anatomical connectivity pat-
terns (Fan et al., 2016) defines regions of interest
(ROI) for the whole brain, and specific regions are
chosen based on their anatomical location. Contin-
uous time-series (385 time points) are extracted for
each ROI and each session and participant represent-
ing the mean activity after denoising.
For the current demonstration, we focus on 5 ROIs
chosen in order to validate our approach using well-
Exploring the Dependencies between Behavioral and Neuro-physiological Time-series Extracted from Conversations between Humans and
Artificial Agents
355
defined functional areas: the Fusiform Gyrus ROI
corresponds to the Fusiform Face Area involved in
face perception, the left and right Motor Cortex ROIs
support speech production, and the left and right Su-
perior Temporal Sulcus ROIs are involved in speech
perception.
3.1.2 Processing Multimodal Behavioral Signals
During conversations, different types of behavioral
data are recorded for both the participant and his in-
terlocutor: video of the interlocutor, gaze movements
of the participant using an eyetracking system, and
the speech of both of them. For each of these modali-
ties, several time series are computed to represent the
evolution over time of different variables for both the
participant and his interlocutor.
First, speech to text transformation is performed
manually, then automatic annotation and segmenta-
tion are applied using SPPAS (Bigi, 2015). From the
obtained transcriptions, we have extracted many lin-
guistic time series such as the Speech activity (the
presence the speech), Overlap (presence of speech of
both interlocutors), Laughters, Filled-breaks and the
Reaction time. The reaction time in our case repre-
sents the amount of time taken by an interlocutor to
speak after the other interlocutor finishes his turn. We
consider this amount positive if there is a delay be-
tween the speaking turns and negative in case of over-
lap.
We also consider specific features like interper-
sonal Particles items, i.e., words that may express the
mood of the speaker (e.g., but, well, maybe), Dis-
courses markers, which are expressions used to make
the discourse organized (e.g., I mean, so, therefore,
okay) (Schiffrin, 1987), and Feedback lexical items,
which represent words used for reaction, perception
and understanding (e.g., yes, no, okay, right) (Gra-
vano et al., 2011).
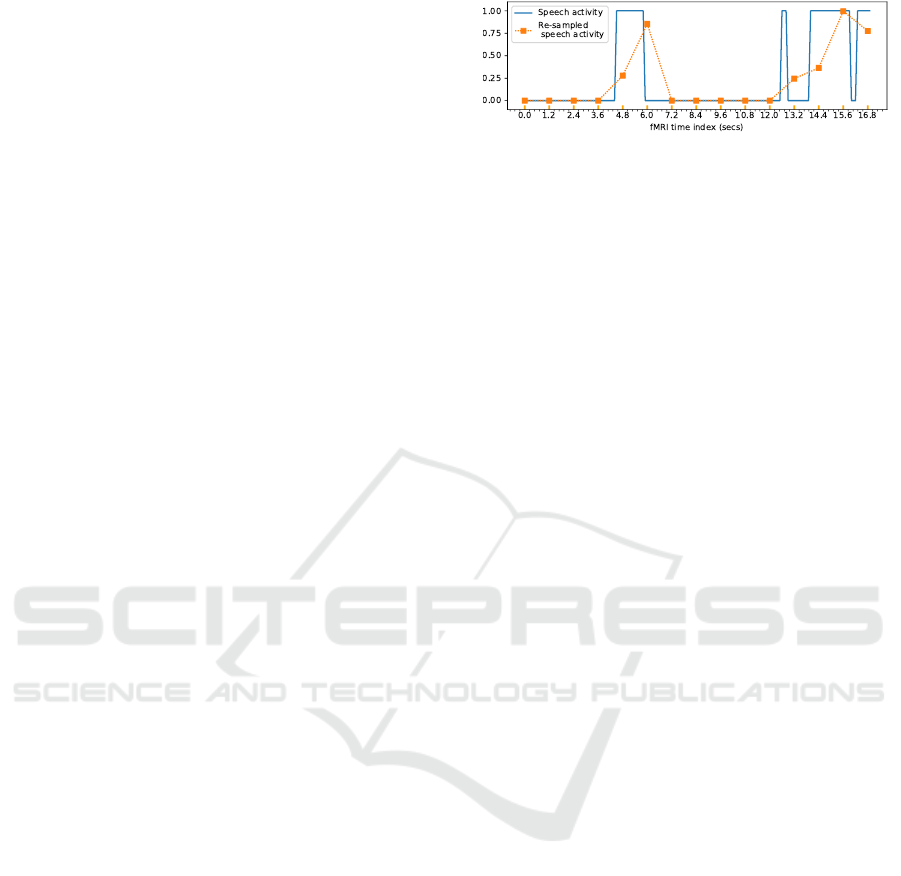
The time series categorizing these features are re-
sampled according to the fMRI acquisition frequency
by considering the percentage of their existence in
each time bin. Figure 2 illustrates an example of re-
sampling the speech activity. Note that if we make
direct projection on the expected axis, we may lose
information between two consecutive fMRI acquisi-
tions concerning the quantity of speech or silence that
have occurred. That is why at each point we consider
the percentage to have a sort of summary of what hap-
pens after the previous point.
The speeches are also analyzed via lexical rich-
ness based on two metrics from (Ochs et al., 2018),
that consider the number of the different words (type-
token ratio) and the number of adjectives plus the
number of adverbs resp., divided by the number of to-
Figure 2: Example of resampling speech features (the
speech activity).
tal words in the text of each speaking turn. Sentiment
analysis is also considered by calculating the polarity
and the subjectivity using the Pattern library (Smedt
and Daelemans, 2012). The polarity score fluctuates
between −1 (negative behavior) and 1 (positive be-
havior), while the subjectivity is between 0 (objective)
and 1 (personal). The method of their calculations is
based first on manual association of the polarity and
the subjectivity scores to a set of adjectives among the
most used. Second, another set is extracted with the
most frequent nouns and the predecessor adjectives as
features. Finally, a kNN classifier is learned to deter-
mine the scores of neighbor adjectives of those man-
ually annotated (Smedt and Daelemans, 2012).
From videos, we used pre-trained models from
Openface (Baltrusaitis et al., 2018) to extract 68 fa-
cial landmarks and 17 facial action units, which cat-
egorize facial movements (Bartlett et al., 1996). The
3D coordinates of gaze movements (3 features) and
head pose translations and rotations (6 features) are
also extracted. The time series associated with these
features are constructed by analyzing each image of
the videos. In this case, the resampling task is less
difficult compared to speech features, because all the
variables have the same frequency and the same num-
ber of observations. From raw eyetracking data, we
compute the speed of the gaze movements. Then, we
project the gaze coordinates on visual stimulation us-
ing the extracted landmarks to localize where the sub-
ject is looking in at each time step (face, eyes, mouth).
The saccades are also detected by the used eyetrack-
ing system, and added to the extracted features.
Table 1 summarizes all the extracted predictive
features. After gathering and resampling them in ad-
dition to the BOLD signal, we build multivariate time
series for each subject with the same number of ob-
servations.
4 ANALYTICAL APPROACH
One hypothesis of this work is that the activity in
functional brain areas is mainly determined by what
participant experiences, described here by behavioral
signals. Therefore, we try to predict the processed
ICPRAM 2020 - 9th International Conference on Pattern Recognition Applications and Methods
356
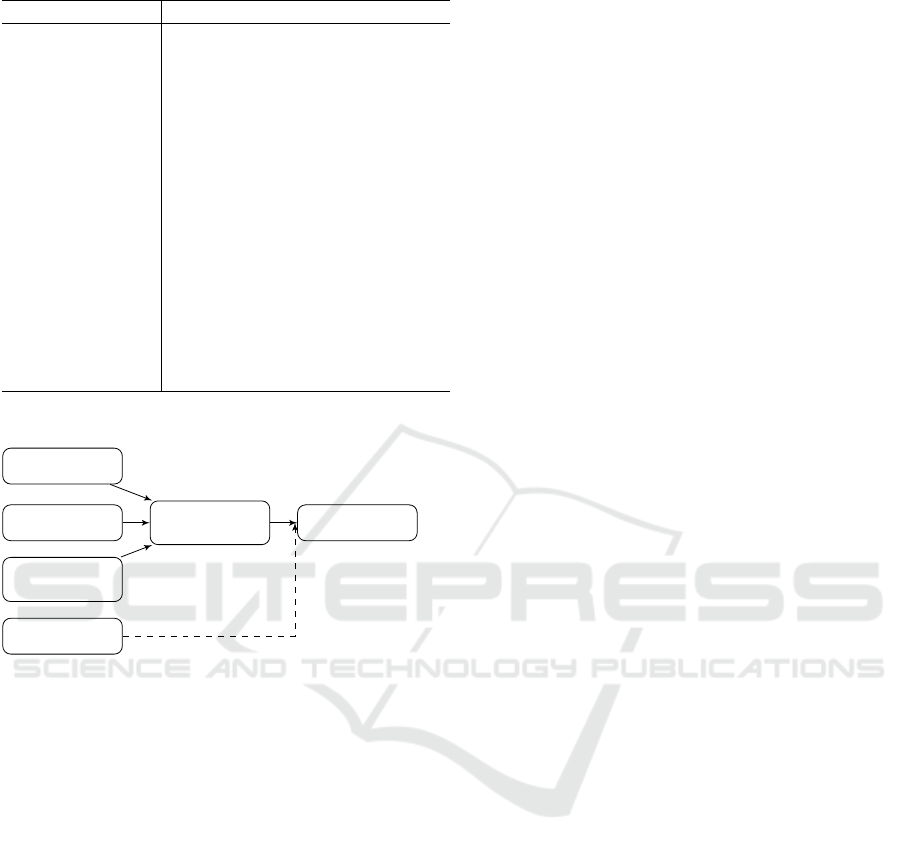
Table 1: The extracted behavioral features.
Modality Features
Speech Speech activity, Particles items,
Discourse Markers, Overlap, Re-
action Time, Filled-breaks, Feed-
backs, Laughters, Lexical Rich-
ness, Polarity, Subjectivity.
Video Facial Action Units (17 vari-
ables), Head pose coordinates (6
variables), Gaze coordinates (3
variables).
Eyetracking data Gaze movement of the partici-
pant (2 variables), and 4 binary
variables categorizing resp. the
presence of saccades, and if the
participant is looking at the face,
the eyes of the mouth of the inter-
locutor.
Speech
Video
Eyetracking
data
fMRI signals
Raw Signals
Time Series Representation
Features
extraction
Resampling
Synchronization
Figure 3: Extracting structured time series from raw multi-
modal signals.
BOLD signal based only on the history of behavioral
features. Note that it is possible to predict the activ-
ity of a brain area based on its previous observations
and the previous observations of other related areas.
Accordingly, auto-regressive models can be used in
this situation, such as the ARIMA (Auto-Regressive
Integrated Moving Average) (Box et al., 2015) model
to predict a single time series, or the co-intregrated
vector auto-regressive models for multivariate predic-
tion of non-stationary time series (Johansen, 1991).
In our research work, our goal is to better understand
the behavioral features related to the brain activity by
comparing human-human and human-machine inter-
action. Consequently, we focus on the behavioral fea-
tures to predict the BOLD signal.
4.1 Feature Selection
Domain knowledge allows us to determine the set of
possible behavioral signals responsible for the acti-
vation of each brain area. For example, to predict
the BOLD signal of the Fusiform Gyrus area, which
is involved in face perception (Kanwisher and Yovel,
2006), we can use features derived from video and
eyetracking signals, in order to take into account the
visual simulation and the gaze movement of the par-
ticipant to evaluate where he is looking. For some
complex brain areas, this is not sufficient, especially
when multiple modalities are involved, because the
set of generated predictive features may be large. In
this case, we use automatic feature selection to refine
the input features before applying prediction models.
4.2 Prediction
The BOLD signal results from a function called the
Hemodynamic Response Function (HRF), which de-
termines the activation delay after receiving a trig-
ger event, which peaks close to 5 seconds after the
event (Gössl et al., 2001). This delay is a key pa-
rameter in our approach to model the dynamic be-
tween the BOLD signal and the behavioral features.
Let Y (t) be a variable representing the discretized
BOLD signal of a given brain area of one subject, and
X(t) = {X
1
(t), X
2
(t), . . . , X
k
(t)}, is a k-dimensional
time series representing the behavioral variables. The
first formulation that comes to mind is to expresses
each value of the BOLD signal at time t as a function
of the predictive features at time t − 5s. This process
can be written as follows:
Y (t) = f (X
1
(t −5s), X
2
(t −5s), . . . , X
k
(t −5s))+U(t),
(1)
where U(t) is the vector of errors of the model,
and f is the function that we want to find.
Considering the fact that the 5s delay is not fix for
all subjects and brain areas, but varies around 5s, it
can be more relevant to include more than one values
around the 5s. Consequently, as an improvement of
equation 1, our formulation can be expressed as fol-
lows:
Y (t) = f (X
1
(t − 4s), X
1
(t − 5s), X
1
(t − 6s), (2)
. . . ,
X
k
(t − 4s), X
k
(t − 5s), X
k
(t − 6s) +U(t),
As mentioned in Section 1, our approach is based
on discretizing the variable describing local brain ac-
tivity into binary variable (activation or not). The mo-
tivation behind the discretization is that instead of pre-
dicting the exact value of the BOLD signal, we start
by predicting if a brain area is active or not. In our
case, classification models can be used to approxi-
mate the function f . The other possibility is to keep
the BOLD signals continuous and use multiple regres-
sion to predict them, which is the classical approach
Exploring the Dependencies between Behavioral and Neuro-physiological Time-series Extracted from Conversations between Humans and
Artificial Agents
357
in the literature (Mitchell et al., 2008; Huth et al.,
2016; Knops et al., 2009; DeSouza et al., 2012). In
our case, we evaluate both approaches by using mul-
tiple regression, then discretizing the predictions in
order to compare all models with same prediction ac-
curacy measures.
5 RESULTS
In this section, we present the prediction procedure
used, the obtained prediction scores, and discuss the
results.
5.1 Prediction Procedure
The pre-processed time series of each subject are re-
structured in such a way to have a target variable and
the lagged behavioral variables as predictive features
according to Equation 2. The data of all subjects are
concatenated, and randomly shuffled to train and test
the models on all observations. The prediction proce-
dure is based on a 10-fold-cross validation to find the
parameters of the prediction models on the training
set (80% of the data). Second, feature selection and
dimension reduction methods are applied with differ-
ent reduction sizes to find the most relevant lagged
variables. Her we evaluate two methods, the Recur-
sive Feature Elimination (Guyon et al., 2002) and the
Principal Component Analysis (Tipping and Bishop,
1999). Afterwards, prediction models are tested on
20% of the data. This procedure is repeated 5 times
to test the models on all data. Finally, we select the
model and the predictive features leading to the best
prediction scores for each brain area.
The experiments are conducted on human-human
and human-robot conversations separately in order to
compare the differences between the two conditions
in terms of the selected behavioral features activating
specific brain areas. In both cases, the data (training
and test sets) consists of 9180 observations. In this
paper, we concentrate on five brain areas: Fusiform
Gyrus Area involved in face perception, left and right
Motor Cortex for speech production, and left and right
Superior Temporal Sulcus for speech perception and
social cognition. These areas are chosen in order to
validate our approach before investigating all brain ar-
eas in future works.
We evaluated classical classifiers using the Sickit-
learn machine learning library (Pedregosa et al.,
2011): SVM, Random Forest (RF), and Gradient
Boosting (GB). The RIDGE model (regression with
regularization) is also evaluated with the idea of pre-
dicting the continuous BOLD signal, then discretiz-
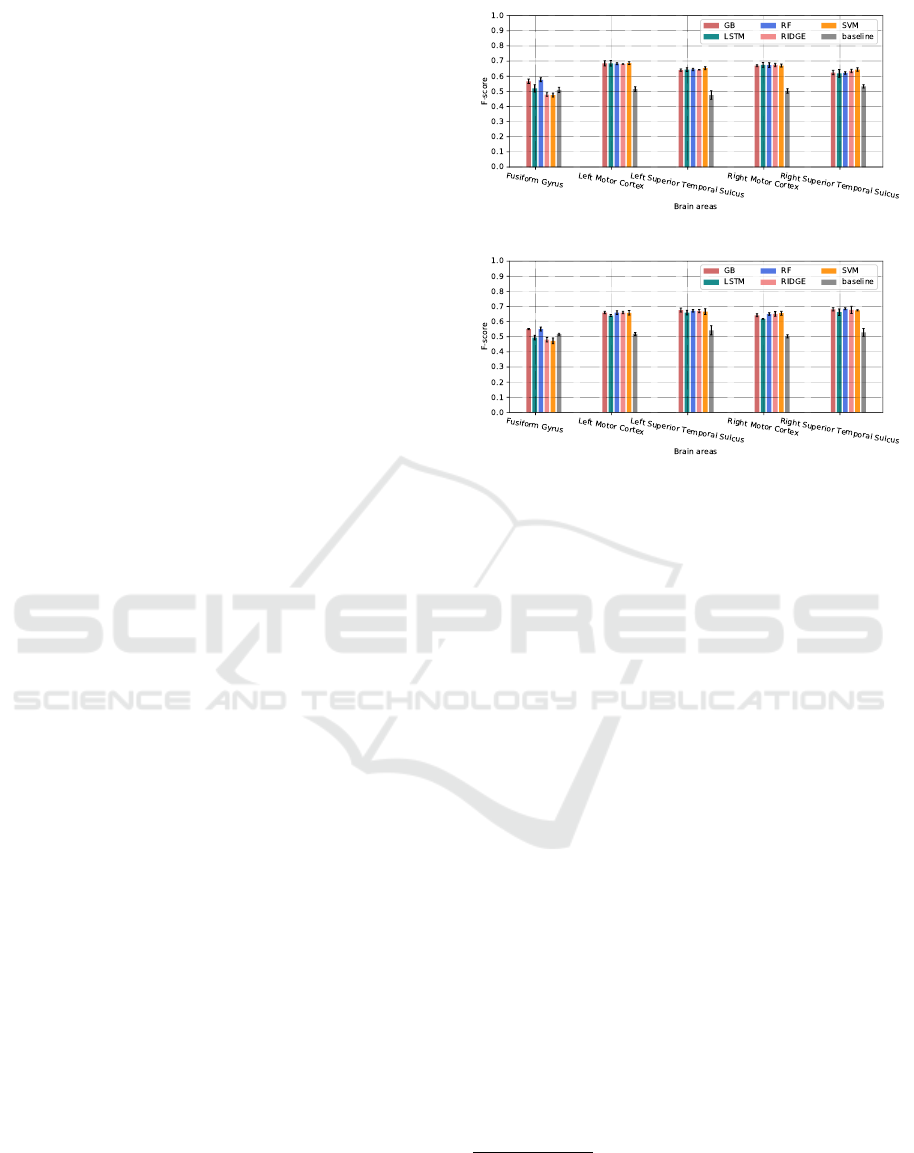
(a)
(b)
Figure 4: Prediction accuracy for human-human (a) and
human-robot (b) interactions, based of the F-score mea-
sures. The values represent the mean of the F-scores over
5 prediction experiments, while the error bars represent the
standard deviations.
ing the predictions. We use also the Long Short
Term Memory (LSTM) network from the Tensor-
flow library (Abadi et al., 2016). Finally, a baseline
classifier is evaluated with random predictions using
3 strategies: stratified, most frequent, and uniform,
where the appropriate strategy of each target variable
is chosen in the training step.
5.2 Prediction Scores
Figure 4 shows a comparison between the evaluated
classifiers in terms of the mean and the standard devi-
ation of the weighted F-score over the 5 prediction
tests.
1
The results show that globally almost all
models outperform the baseline, and they are close
for brain areas involved in speech perception and pro-
duction. Overall, the best f-scores are between 0.65
and 0.7, except for the Fusiform Gyrus area that we
found the most difficult to predict, where only the
Random Forest Gradient Boosting classifier that are
slightly better than the baseline.
1
We only showed the results based on f-score as it re-
sumes the precision and the recall. These measures are also
calculated, more details about their results in addition to the
scores of each subset of behavioral features can be found in
https://github.com/Hmamouche/NeuroTSConvers.
ICPRAM 2020 - 9th International Conference on Pattern Recognition Applications and Methods
358

5.3 Discussion
The proposed prediction process allows to identify the
features that elicit the local activation of the brain ar-
eas, and to compare the difference between the sit-
uations where a participant is talking with a human
or a robot. For the Fusiform Gyrus area (face per-
ception), the selected features for human-human con-
versations are head movements and facial action units
with the random forest classifier, while from human-
machine conversations, eyetracking features (i.e., the
speed of gaze coordinates, saccades and whether the
participant is looking at the face of the robot) are also
needed. This can be explained by the fact that our
scenario for the talking head does not express signif-
icant facial movements compared to the human. For
left and right Motor cortex areas, which are involved
in speech production, the obtained results confirm the
hypothesis that the best predictions are obtained using
only the speech activity of the participant. For these
areas, we found no difference between human-human
and human-machine conversations. For left and right
Motor cortex areas, the obtained results confirm the
hypothesis that the best predictions are obtained using
only the speech activity of the participant. For these
areas, we found no difference between human-human
and human-machine conversations.
For left and right Superior Temporal Sulcus, only
the Speech activity of the interlocutor is needed for
human-robot interactions. For human-human interac-
tions, different linguistics features are selected for the
right {Speech activity, Filled-breaks, Feedbacks, and
Discourses markers}, compared to the left area, for
which just the Speech activity is required. These brain
areas are an interesting example to compare human-
human and human-machine, as we see the absence of
social cognition features where the interlocutor is a
robot.
Let us note that each prediction model selects its
own best predictors for each brain area. Nevertheless,
there is some sort of stability in this selection over all
models. For example, all the models select the speech
activity of the participant to predict left and right Mo-
tor Cortex areas. They differs a little for left and right
Superior Temporal Sulcus. For instance, the Random
Forest model selects linguistics features involved in
perception, while the SVM includes some facial ac-
tion units. One explanation might be that different
behavioral features may provide the same predictive
information. In our case, we select the final best pre-
dictors based on the best model for each brain area.
We can conclude that the local activation of the
studied brain areas involved in speech production and
perception can be predicted, allowing us to identify
causal dependencies between behavioral and neuro-
physiological time series, and compare human-human
and human-machine interactions. Importantly, the
relevant features are in complete agreement with the
social cognitive neuroscience literature. One limit
that we face concerns the prediction of the Fusiform
Gyrus area activity. Although the features selected to
predict the activity of this area are logical, improving
the prediction performances requires further investi-
gation, and particularly to compare prediction for the
human and robot agent given the differences in their
head movements and facial expression.
6 CONCLUSION
In this paper, we propose an approach to predict
the activity in specific brain areas based on the
multi-modal behavioral signals of human-human and
human-machine conversations. This is a worthwhile
alternative to the classical approach that consists
in predicting continuous fMRI signals directly us-
ing multiple regression. The results show that the
discretized BOLD signals of brain areas involved
in speech perception and production are predictable
based only on linguistics time series. In future
works, we plan to explore all brain regions and to de-
fine higher-order behavioral features. The approach
proposed here confirms the links between behav-
ioral variables and the functional brain areas under
scrutiny, but more importantly paves the way to dis-
cover new dependencies between behaviour and local
activity across the whole brain in a natural social in-
teraction.
REFERENCES
Abadi, M., Barham, P., Chen, J., Chen, Z., Davis, A.,
Dean, J., Devin, M., Ghemawat, S., Irving, G., Isard,
M., et al. (2016). Tensorflow: A system for large-
scale machine learning. In 12th {USENIX} Sympo-
sium on Operating Systems Design and Implementa-
tion ({OSDI} 16), pages 265–283.
Al Moubayed, S., Beskow, J., Skantze, G., and Granström,
B. (2012). Furhat: A back-projected human-like robot
head for multiparty human-machine interaction. In
Esposito, A. e. a., editor, Cognitive Behavioural Sys-
tems, Lecture Notes in Computer Science, pages 114–
130. Springer Berlin Heidelberg.
Ashburner, J. (2007). A fast diffeomorphic image registra-
tion algorithm. NeuroImage, 38(1):95–113.
Baltrusaitis, T., Zadeh, A., Lim, Y. C., and Morency, L.
(2018). OpenFace 2.0: Facial Behavior Analysis
Toolkit. In 2018 13th IEEE International Conference
on Automatic Face Gesture Recognition (FG 2018),
pages 59–66.
Exploring the Dependencies between Behavioral and Neuro-physiological Time-series Extracted from Conversations between Humans and
Artificial Agents
359

Bartlett, M. S., Viola, P. A., Sejnowski, T. J., Golomb, B. A.,
Larsen, J., Hager, J. C., and Ekman, P. (1996). Classi-
fying facial action. In Advances in neural information
processing systems, pages 823–829.
Bigi, B. (2015). SPPAS - multi-lingual approaches to the
automatic annotation of speech. The Phonetician,
111-112(ISSN:0741-6164):54–69.
Bone, D., Lee, C.-C., and Narayanan, S. (2014). Robust
Unsupervised Arousal Rating: A Rule-Based Frame-
work with Knowledge-Inspired Vocal Features. IEEE
transactions on affective computing, 5(2):201–213.
Box, G. E., Jenkins, G. M., Reinsel, G. C., and Ljung, G. M.
(2015). Time series analysis: forecasting and control.
John Wiley & Sons.
Chen, H., Liao, Y., Jan, H., Kuo, L., and Lee, C. (2016).
A Gaussian mixture regression approach toward mod-
eling the affective dynamics between acoustically-
derived vocal arousal score (VC-AS) and internal
brain fMRI bold signal response. In 2016 IEEE Inter-
national Conference on Acoustics, Speech and Signal
Processing (ICASSP), pages 5775–5779.
DeSouza, J. F., Ovaysikia, S., and Pynn, L. K. (2012). Cor-
relating Behavioral Responses to fMRI Signals from
Human Prefrontal Cortex: Examining Cognitive Pro-
cesses Using Task Analysis. Journal of Visualized Ex-
periments : JoVE, (64).
Fan, L., Li, H., Zhuo, J., Zhang, Y., Wang, J., Chen,
L., Yang, Z., Chu, C., Xie, S., Laird, A. R., Fox,
P. T., Eickhoff, S. B., Yu, C., and Jiang, T. (2016).
The Human Brainnetome Atlas: A New Brain Atlas
Based on Connectional Architecture. Cereb Cortex,
26(8):3508–3526.
Gössl, C., Fahrmeir, L., and Auer, D. (2001). Bayesian
modeling of the hemodynamic response function in
bold fmri. NeuroImage, 14(1):140–148.
Gravano, A., Hirschberg, J., and Be
ˇ
nuš, Š. (2011). Affir-
mative cue words in task-oriented dialogue. Compu-
tational Linguistics, 38(1):1–39.
Guyon, I., Weston, J., Barnhill, S., and Vapnik, V. (2002).
Gene selection for cancer classification using support
vector machines. Machine learning, 46(1-3):389–422.
Huth, A. G., de Heer, W. A., Griffiths, T. L., Theunissen,
F. E., and Gallant, J. L. (2016). Natural speech reveals
the semantic maps that tile human cerebral cortex. Na-
ture, 532(7600):453–458.
Johansen, S. (1991). Estimation and hypothesis testing of
cointegration vectors in gaussian vector autoregres-
sive models. Econometrica: journal of the Econo-
metric Society, pages 1551–1580.
Kanwisher, N. and Yovel, G. (2006). The fusiform face
area: a cortical region specialized for the perception of
faces. Philosophical Transactions of the Royal Society
B: Biological Sciences, 361(1476):2109–2128.
Kasper, L., Bollmann, S., Diaconescu, A. O., Hutton, C.,
Heinzle, J., Iglesias, S., Hauser, T. U., Sebold, M.,
Manjaly, Z.-M., Pruessmann, K. P., and Stephan, K. E.
(2017). The PhysIO Toolbox for Modeling Physio-
logical Noise in fMRI Data. Journal of Neuroscience
Methods, 276:56–72.
Knops, A., Thirion, B., Hubbard, E. M., Michel, V., and De-
haene, S. (2009). Recruitment of an Area Involved in
Eye Movements During Mental Arithmetic. Science,
324(5934):1583–1585.
Mitchell, T. M., Shinkareva, S. V., Carlson, A., Chang,
K.-M., Malave, V. L., Mason, R. A., and Just,
M. A. (2008). Predicting Human Brain Activity
Associated with the Meanings of Nouns. Science,
320(5880):1191–1195.
Ochs, M., Jain, S., and Blache, P. (2018). Toward an auto-
matic prediction of the sense of presence in virtual re-
ality environment. In Proceedings of the 6th Interna-
tional Conference on Human-Agent Interaction, pages
161–166. ACM.
Pedregosa, F., Varoquaux, G., Gramfort, A., Michel, V.,
Thirion, B., Grisel, O., Blondel, M., Prettenhofer,
P., Weiss, R., Dubourg, V., et al. (2011). Scikit-
learn: Machine learning in python. Journal of ma-
chine learning research, 12(Oct):2825–2830.
Penny, W. D., Friston, K. J., Ashburner, J. T., Kiebel, S. J.,
and Nichols, T. E. (2011). Statistical Parametric Map-
ping: The Analysis of Functional Brain Images. Else-
vier.
Rauchbauer Birgit, Nazarian Bruno, Bourhis Morgane,
Ochs Magalie, Prévot Laurent, and Chaminade
Thierry (2019). Brain activity during reciprocal
social interaction investigated using conversational
robots as control condition. Philosophical Trans-
actions of the Royal Society B: Biological Sciences,
374(1771):20180033.
Schiffrin, D. (1987). Discourse markers. Number 5. Cam-
bridge University Press.
Smedt, T. D. and Daelemans, W. (2012). Pattern for
python. Journal of Machine Learning Research,
13(Jun):2063–2067.
Tipping, M. E. and Bishop, C. M. (1999). Probabilistic prin-
cipal component analysis. Journal of the Royal Sta-
tistical Society: Series B (Statistical Methodology),
61(3):611–622.
Whitfield-Gabrieli, S. and Nieto-Castanon, A. (2012).
Conn: A Functional Connectivity Toolbox for Corre-
lated and Anticorrelated Brain Networks. Brain Con-
nectivity, 2(3):125–141.
Yarkoni, T., Barch, D. M., Gray, J. R., Conturo, T. E., and
Braver, T. S. (2009). BOLD Correlates of Trial-by-
Trial Reaction Time Variability in Gray and White
Matter: A Multi-Study fMRI Analysis. PLOS ONE,
4(1):e4257.
ICPRAM 2020 - 9th International Conference on Pattern Recognition Applications and Methods
360
