BADRESC: Brain Anomaly Detection based on Registration Errors and
Supervoxel Classification
Samuel B. Martins
1,2,3 a
, Alexandre X. Falc
˜
ao
1 b
and Alexandru C. Telea
4 c
1
Laboratory of Image Data Science (LIDS), Institute of Computing, University of Campinas, Brazil
2
Bernoulli Institute, University of Groningen, The Netherlands
3
Federal Institute of S
˜
ao Paulo, Campinas, Brazil
4
Department of Information and Computing Sciences, Utrecht University, The Netherlands
Keywords:
Brain Anomaly Detection, Supervoxel Segmentation, One-class Classification, Registration Errors, MRI.
Abstract:
Automatic detection of brain anomalies in MR images is very challenging and complex due to intensity sim-
ilarity between lesions and normal tissues as well as the large variability in shape, size, and location among
different anomalies. Inspired by groupwise shape analysis, we adapt a recent fully unsupervised supervoxel-
based approach (SAAD) — designed for abnormal asymmetry detection of the hemispheres — to detect brain
anomalies from registration errors. Our method, called BADRESC, extracts supervoxels inside the right and
left hemispheres, cerebellum, and brainstem, models registration errors for each supervoxel, and treats outliers
as anomalies. Experimental results on MR-T1 brain images of stroke patients show that BADRESC attains
similar detection rate for hemispheric lesions in comparison to SAAD with substantially less false positives.
It also presents promising detection scores for lesions in the cerebellum and brainstem.
1 INTRODUCTION
The visual slice-by-slice inspection of abnormal tis-
sues in magnetic resonance (MR) 3D brain images by
a clinician is the most commonly procedure for early
diagnosis and follow-up of brain disorders. This pro-
cess is very laborious, time-consuming, easily prone
to errors, and impracticable to be performed at a large
scale. Several automatic methods address these diffi-
culties by delineating brain anomalies as accurate as
clinicians. However, this goal is very challenging and
complex due to the large variability in shape, size, and
location among different anomalies (see e.g., Fig. 1).
Most automatic brain lesion detec-
tion/segmentation methods train a discriminative
model from training images — which must be previ-
ously annotated (e.g., lesion segmentation masks) by
specialists — to delineate anomalies by classifying
voxels or regions of the target image (Goetz and
et al., 2014; Pinto et al., 2015; Soltaninejad and
et al., 2017). Traditional image features (e.g., edge
detectors and texture features) and deep feature
a
https://orcid.org/0000-0002-2894-3911
b
https://orcid.org/0000-0002-2914-5380
c
https://orcid.org/0000-0003-0750-0502
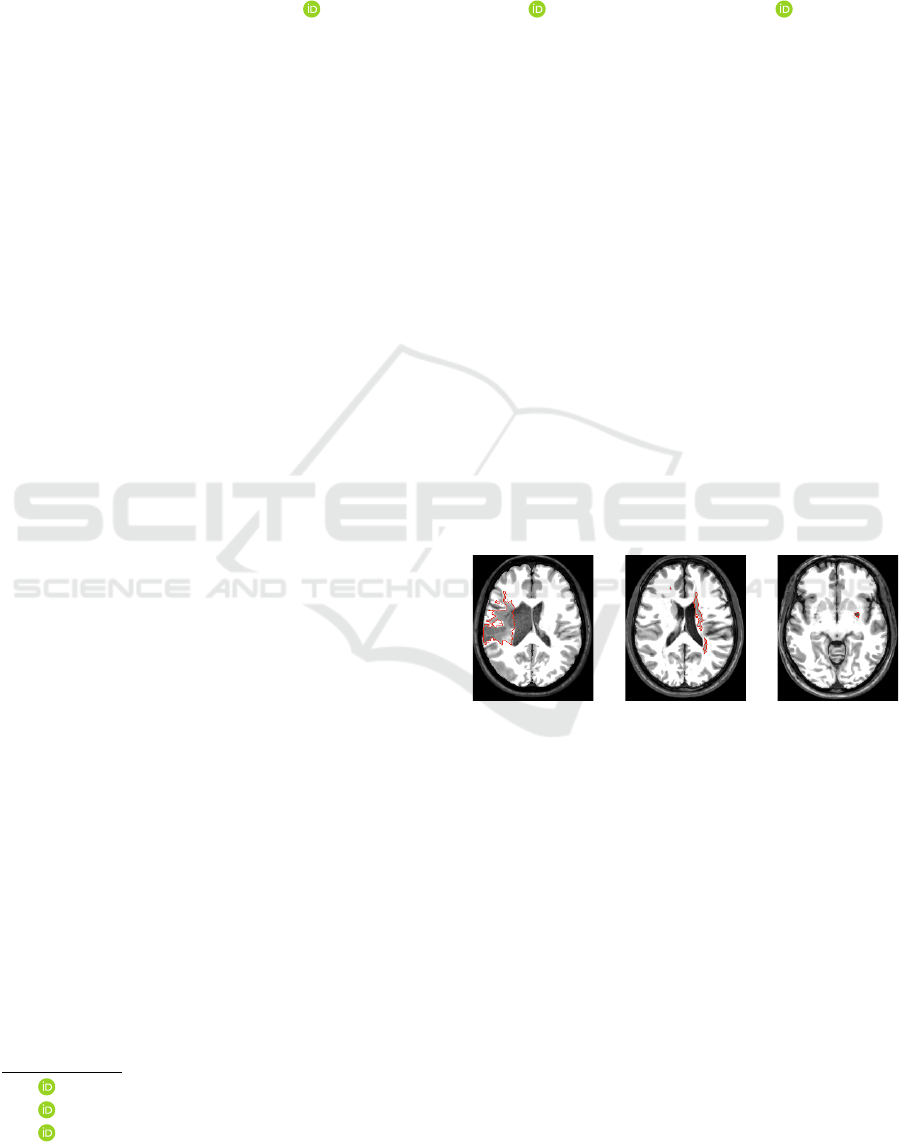
Figure 1: Axial slices of three stroke patients from the AT-
LAS dataset (Liew and et al., 2018) with lesions (ground-
truth borders in red) that significantly differ in location,
shape, and size.
representations (e.g., convolutional features) are
commonly used (Goetz and et al., 2014; Soltaninejad
and et al., 2017; Kooi et al., 2017; Aslani et al.,
2018). Some works propose a groupwise shape
analysis based on estimating the deformation field
between a target image and a template (reference
image) after image registration (Gao et al., 2014;
Shakeri and et al., 2016).
However, these methods commonly have three
main limitations. First, they require a large num-
ber of high-quality annotated training images, which
is not easily found for most medical image analysis
problems (Akkus and et al., 2017; Thyreau and et al.,
2018). Second, they are only designed for the lesions
found in the training set. Third, some methods still
74
Martins, S., Falcão, A. and Telea, A.
BADRESC: Brain Anomaly Detection based on Registration Errors and Supervoxel Classification.
DOI: 10.5220/0008987800740081
In Proceedings of the 13th International Joint Conference on Biomedical Engineering Systems and Technologies (BIOSTEC 2020) - Volume 2: BIOIMAGING, pages 74-81
ISBN: 978-989-758-398-8; ISSN: 2184-4305
Copyright
c
2022 by SCITEPRESS – Science and Technology Publications, Lda. All rights reserved

require weight fine-tuning (retraining) when used for
a new set of images due to image variability across
scanners and acquisition protocols, limiting its appli-
cation to clinical routine.
Unsupervised anomaly detection approaches aim
to circumvent the above limitations by encoding gen-
eral knowledge or assumptions (priors) from healthy
tissues from control images of healthy subjects only.
Any outlier who breaks such general priors is then
considered as an anomaly (Guo et al., 2015).
Since many neurological diseases are asso-
ciated with abnormal brain asymmetries (Wang
and et al., 2001), an unsupervised method called
Supervoxel-based Abnormal Asymmetry Detection
(SAAD) (Martins et al., 2019b) was recently pro-
posed to detect abnormal asymmetries in MR brain
images. SAAD presents a mechanism for asymmetry
detection that consists of three steps: (i) it registers
all images to the same symmetric template and then
computes asymmetries between the two hemispheres
by using their mid-sagittal plane (MSP) as reference;
(ii) a supervoxel segmentation method, named Sym-
mISF, is used to extract pairs of symmetric supervox-
els from the left and right hemispheres for each test
image, guided by their asymmetries. Supervoxels de-
fine more meaningful volumes of interest for analysis
than regular 3D patches; and (iii) each pair generates
a local one-class classifier trained on control images
to find supervoxels with abnormal asymmetries on the
test image. SAAD was further extended to detect ab-
normal asymmetries in the own native image space of
each test image (Martins et al., 2019c).
Although SAAD claims to obtain higher detec-
tion accuracy even for very small lesions compared
to state-of-the-art detection methods, its analysis is
limited to asymmetric anomalies in the brain hemi-
spheres, ignoring lesions in the cerebellum and brain-
stem. Moreover, if the same lesion is localized in both
hemispheres roughly in the same position (e.g., some
cases of multiple sclerosis), it is not detected due to
the lack of asymmetries.
Inspired by groupwise shape analysis, in this work
we present BADRESC, an unsupervised method for
Brain Anomaly Detection based on Registration Er-
rors and Supervoxel Classification in 3T MR-T1 im-
ages of the brain. After registering a target image to
a common template with only healthy tissues by de-
formable registration, BADRESC assumes that regis-
tration errors for anomalies are considerably different
of the registration errors for healthy tissues. Thus,
BADRESC adapts the SAAD framework as follows.
First, it replaces the asymmetry maps with registra-
tion errors. A robust preprocessing is considered to
improve the quality of image registration. Second, it
expands the anomaly analysis to four objects of in-
terest — right and left hemispheres, cerebellum, and
brainstem — by extracting supervoxels for each one
separately. Finally, each supervoxel generates a local
one-class classifier for healthy tissues to detect out-
liers as anomalies.
We compare BADRESC with SAAD for the de-
tection of hemispheric lesions on 3D MR-T1 brain
images of stroke patients. Experimental results shows
that BADRESC attains similar detection rates to
SAAD with considerably less false positives. Addi-
tionally, BADRESC presents promising results for the
detection of lesions in the cerebellum and brainstem.
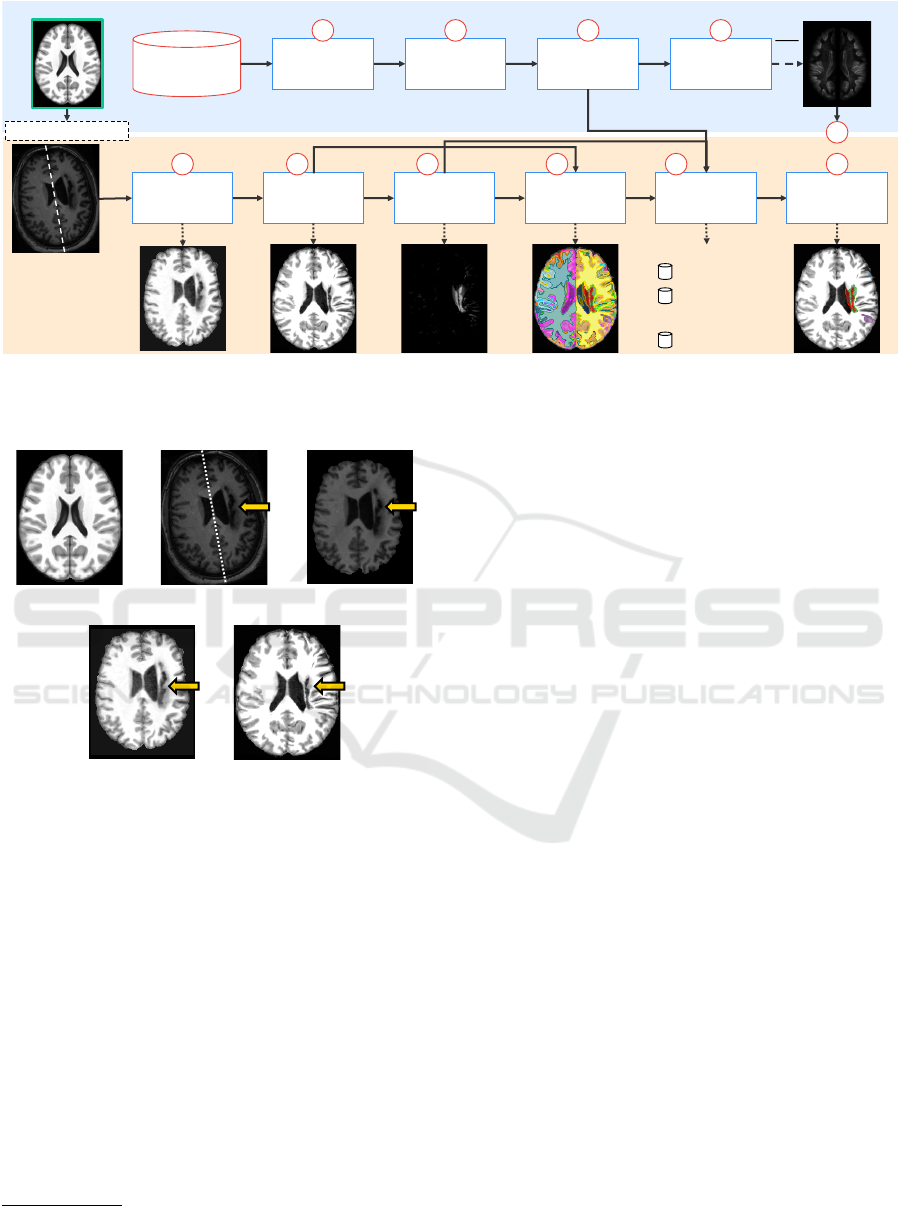
2 DESCRIPTION OF BADRESC
We next describe the BADRESC method (see also
Fig. 2). The method consists of five steps: 3D im-
age preprocessing, image registration, registration er-
ror computation, supervoxel segmentation, and clas-
sification, described next. The brain regions/objects
of interest in this work are the right hemisphere, left
hemisphere, cerebellum, and brainstem.
2.1 3D Image Preprocessing and
Registration
MR images are altered by image acquisition prob-
lems such as noise and intensity heterogeneity. This
makes the automated analysis very challenging since
the intensities of the same tissues vary across the
image (Pereira et al., 2016). To alleviate these and
make images more similar to each other, we use typi-
cal preprocessing steps known in the literature (Juan-
Albarrac
´
ın et al., 2015; Pereira et al., 2016; Manj
´
on
and Coup
´
e, 2016; Martins et al., 2019b), as shown in
Fig. 3.
Initially, we perform the same preprocessing steps
of SAAD by applying bias field correction with
N4 (Tustison et al., 2010), followed by median fil-
tering for noise reduction, and linear intensity nor-
malization within [0, 4095]. Since voxels from irrel-
evant tissues/organs for the addressed problem (e.g.,
neck and bones) can negatively impact the image reg-
istration and intensity normalization, we use the prob-
abilistic atlas-based method AdaPro (Martins et al.,
2019a) to segment the regions of interest (see Fig. 3a-
c).
To attenuate differences in brightness and con-
trast among images, we apply a histogram match-
ing between the segmented images and the template.
This operation only considers the voxels inside the re-
gions of interest (see Fig. 3d). We then perform de-
BADRESC: Brain Anomaly Detection based on Registration Errors and Supervoxel Classification
75
steps 1, 2, 3, 5, 6, 7, 8
Template
Train. Control
Images
Registration
Pre-
Processing
Compute
Reg. Errors
Average
Reg. Errors
Registration
Pre-
Processing
1 2 3
5 6
Compute
Reg. Errors
7
4
Supervoxel
Segmentation
8
Feature
Extraction
9
Classification
10
X AR
X
AR
X
LI AR
I
Test Image
Datasets
Supervoxel 1
:
:
Supervoxel N
Supervoxel 2
7
T
Figure 2: Pipeline of BADRESC. The upper blue part is computed previously (offline). The bottom orange part is computed
for each test image. The template (reference image) is used in both parts (Steps 1, 2, 3, 5, 6, 7, and 8). Figure based on (Martins
et al., 2019b; Martins et al., 2019c).
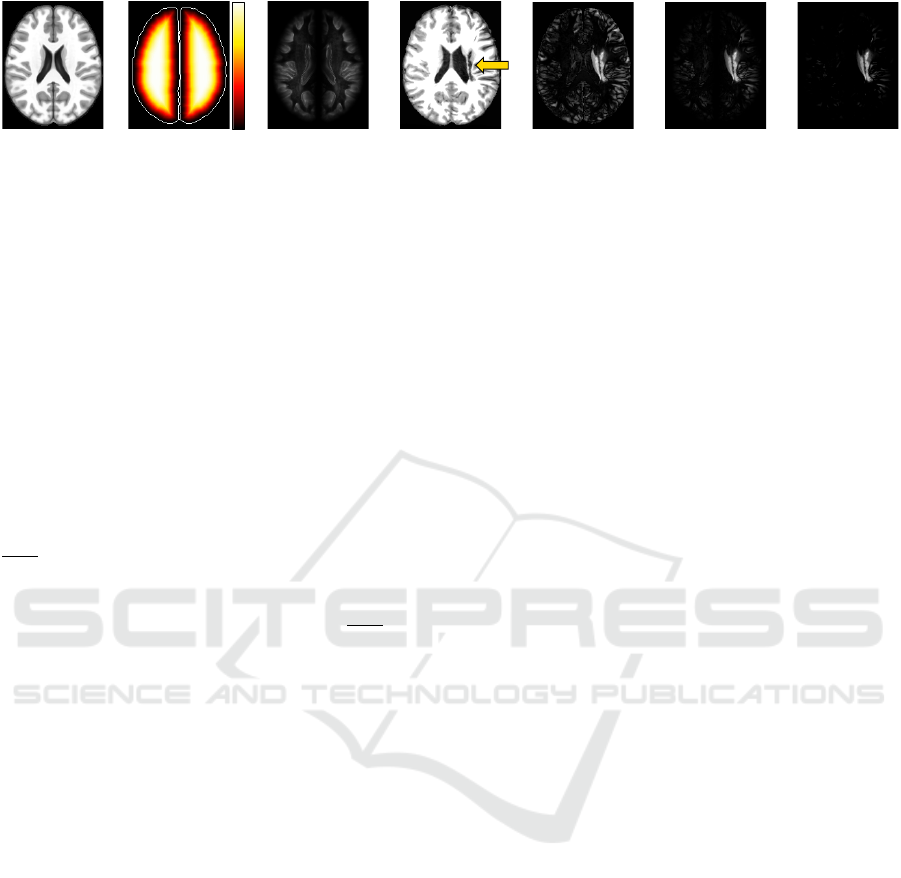
(a) (b) (c)
(e)(d)
Figure 3: Preprocessing and registration steps. (a) Axial
slice of the brain template (reference image). (b) Axial slice
of a raw test image. The dashed line shows its mid-sagittal
plane (MSP) and the arrow indicates a stroke lesion. (c)
Test image after bias field correction, noise filtering, MSP
alignment, and brain segmentation. (d) Histogram matching
between (c) and the template. (e) Final preprocessed image
after deformable registration and histogram matching with
the template.
formable registration to place all images in the coor-
dinate space of the ICBM 2009c Nonlinear Symmet-
ric template (Fonov and et al., 2009). Since the im-
age registration technique has a critical impact on the
analysis, we use Elastix (Klein et al., 2010), a popu-
lar and accurate image registration method.
1
Finally,
we perform another histogram matching between the
registered images and the template (see Fig. 3e).
1
We used the par0000 files available at http://elastix.
bigr.nl/wiki/index.php
2.2 Registration Error Computation
When registering images to a common template with
only healthy tissues, we expect that registration errors
(REs) — voxel-wise absolute differences between the
registered image and the template — are lower and
present a different pattern compared to anomalies (see
Fig. 4e). However, some healthy structures in the
cortex, such as gyri and sulci, present high REs due
to their complex shapes and immense variability be-
tween subjects — observe the cortex of the template
and the registered image in Figs. 4a and 4d; note its
resulting REs in Fig. 4e. To avoid detecting false pos-
itives in this region, some attenuation process is re-
quired.
Let T be the template (Fig. 4a) and M
T
its pre-
defined brain segmentation mask for the right hemi-
sphere, left hemisphere, cerebellum, and brainstem
(background voxels have label 0 and each object has
a different label). Let X = {X
1
, ··· , X
k
} be the set of k
registered training images (output of Step 2 in Fig. 2)
and I the test image after preprocessing and registra-
tion (output of Step 6 in Fig. 2; see also Fig. 4d).
Firstly, we compute the euclidean distance trans-
form (EDT) for each object of M
T
and normalize the
distances within [0, 1] to build the map E (Fig. 4b).
Next, we obtain the set of registration errors R
X
for all
X by computing the voxel-wise absolute differences
between X and T (Step 3 in Fig. 2; see also Fig. 4e).
For each training image X
i
∈ X, we attenuate REs in
its cortex such that for each voxel v ∈ X
i
,
f (v) = 1 − (E(v) − 1)
4
AR
X
i
(v) = R
X
i
(v) · f (v)
(1)
BIOIMAGING 2020 - 7th International Conference on Bioimaging
76
(a) (b) (c) (d) (e) (f) (g)
1.0
0.0
Figure 4: Registration error computation. (a) Axial slice of the brain template. (b) Euclidean Distance Transform (EDT)
normalized within [0, 1] computed for the brain segmentation mask defined for the template. Brain borders are shown only
for illustration purposes. (c) Common registration errors for control images. (d) Axial slice of a test stroke image after
preprocessing and registration in (a). The arrow indicates the stroke lesion. (e) Registration errors. (f) Attenuation of (e) for
the cortex based on the EDT. (g) Final registration errors for the test image: positive values of the subtraction between (f) and
(c).
where E(v) is the euclidean distance for the voxel v,
f (v) is its attenuation factor within [0, 1], and AR
X
i
is
the map with the attenuated REs for X
i
. Thus, REs of
voxels close to the brain borders are extremely atten-
uated whereas those from voxels far from the borders
are slightly impacted (see Fig. 4f). A downside of this
approach is that subtle lesions in the cortex tend to be
missed.
In order to even ignore REs caused by noises or
small intensity differences in regions/tissues far from
the cortex, we create a common registration error map
AR
X
by averaging the attenuated REs from AR
X
(out-
put of Step 4 in Fig. 2; see also Fig. 4c). Finally,
we repeat the same steps to compute the attenuated
REs for the test image I and then subtract AR
X
from
them. Resulting positive values form a final attenu-
ated registration error map AR
I
for I (output of Step 7
in Fig. 2; see also Fig. 4g).
2.3 Supervoxel Segmentation
The direct comparison between the registered image
and its template, or even between large 3D regular
patches, is not useful as it will not tell us where
small-scale REs occur — a similar parallel is done for
asymmetries in (Martins et al., 2019c). Conversely,
a voxel-wise comparison is risky, since individual
voxels contain too little information to capture REs.
These difficulties motivate the use of supervoxels as
the unit of comparison (Step 8 in Fig. 2).
Inspired by the SymmISF method (Martins et al.,
2019b) used in SAAD for symmetrical supervoxel
segmentation, we propose a new technique that ex-
tracts supervoxels in the brain guided by registration
errors, as shown in Fig. 5. Our supervoxel segmen-
tation is also based on the recent Iterative Spanning
Forest framework (Vargas-Mu
˜
noz et al., 2019) for su-
perpixel segmentation and has three steps: (i) seed es-
timation; (ii) connected supervoxel delineation (mul-
tiple iterations); and (iii) seed recomputation to im-
prove delineation, as follows.
Recall a template T , a preprocessed and registered
test image I, and its attenuated registration error map
AR
I
. We find the initial seeds by selecting one seed
per local maximum in AR
I
(see the seeds in Fig. 5).
We compute the local maxima of the foreground of
a binarized AR
I
at γ × τ, where τ is Otsu’s thresh-
old (Otsu, 1979). The higher the factor γ is, the lower
is the number of components in the binarized AR
I
. We
extend the seed-set with a fixed number (100) of seeds
by uniform grid sampling the regions with low REs of
the binarized image.
By stacking I and T as the input 2-band volume
(see Fig. 5), we apply ISF inside each object of inter-
est separately from the initial seeds. ISF relies on a
cost function controlled by two parameters: α and β.
The results are label maps in which each supervoxel
is assigned to a distinct number/color. All labels are
then combined and relabeled to build the final super-
voxel map L (output of Step 8 in Fig. 2).
2.4 Feature Extraction and
Classification
The feature extraction and classification steps are very
similar to those of SAAD (Martins et al., 2019b). For
each test image I, each supervoxels in L is used to cre-
ate a one-class classifier using as feature vector the
normalized histogram of the attenuated REs in AR
I
(Step 9 in Fig. 2). This implicitly considers the po-
sition of the supervoxels in the brain during classifi-
cation. BADRESC uses the one-class linear Support
Vector Machine (oc-SVM) for this task (Manevitz
and Yousef, 2001). The classifiers are trained from
healthy control images only and used to identify out-
lier supervoxels with abnormal REs in I (Step 10 in
Fig. 2).
BADRESC: Brain Anomaly Detection based on Registration Errors and Supervoxel Classification
77

seed
estimation
ISF
concatenate
volumes
template
(reference image)
registration errors
seeds
supervoxels
preprocessed
test volume
(3D image)
2 -band
stacked volume
Figure 5: Pipeline of the proposed supervoxel segmentation. The method stacks the input preprocessed test 3D image (seg-
mented objects are colored) with the template to build a 2-band volume. An initial seed set is obtained from the registration
errors of the test image. For each object of the segmentation brain mask, the ISF framework (Vargas-Mu
˜
noz et al., 2019)
estimates supervoxels inside the object from the initial seeds. Resulting supervoxels are combined and relabeled to form the
final label map.
3 EXPERIMENTS
To evaluate the proposed method, we need datasets
with volumetric MR-T1 brain images (i) from healthy
subjects for training, and (ii) with lesions of different
appearance (especially small ones) containing their
segmentation masks. First, we considered the Cam-
Can dataset (Taylor et al., 2017) which has 653 MR-
T1 images of 3T from healthy men and women be-
tween 18 and 88 years. As far as we know, CamCan
is the largest public dataset with 3D images of healthy
subjects acquired from different scanners. In order
to avoid noisy data in the training set, we removed
some images with artifacts or bad acquisition after a
visual inspection in all MR-T1 images, yielding 524
images.
2
For testing, we chose the Anatomical Tracings of
Lesions After Stroke (ATLAS) public dataset release
1.2 (Liew and et al., 2018) in our experiments. AT-
LAS is a very challenging dataset with a large vari-
ety of manually annotated lesions and images of 1.5T
and 3T acquired from different scanners. It contains
heterogeneous lesions that differ in size, shape, and
location (see Fig. 1). All images only have a mask
with a stroke region ignoring other possible anoma-
lies caused by those lesions. Current state-of-the-art
segmentation results for ATLAS from a supervised
method based on U-Net are inaccurate yet (Qi and
et al., 2019).
2
A link with the considered images can be found
at https://github.com/lidsunicamp/BIOIMAGING20
BADRESC
Since the considered training images have a 3T
field strength, we selected all 3T images from AT-
LAS for analysis (total of 269 images). All im-
ages were registered into the coordinate space of
ICBM 2009c Nonlinear Symmetric template (Fonov
and et al., 2009) and preprocessed as outlined in Sec-
tion 2.1.
We compared BADRESC against the SAAD
method proposed in (Martins et al., 2019b), which in
turn was also evaluated with the ATLAS dataset as
reported in (Martins et al., 2019b). For a fair compar-
ison, we compared both methods for all 3T images
which only contain lesions in the hemispheres. Addi-
tionally, we evaluated BADRESC for the 3T images
with stroke lesions in the cerebellum and brainstem.
We used the following parameters for BADRESC,
empirically obtained from the observation on a few
training control images: α = 0.06, β = 5.0, γ = 3,
histogram of 128 bins, and ν = 0.01 for the linear oc-
SVM.
We proposed a set of metrics to evaluate the de-
tection quality, as follows. We start computing the
detection rate based on at least 15% overlap between
supervoxels detected by the methods and lesions la-
beled in ATLAS (Table 1, row 1). We then provided
false positive (FP) scores in terms of both voxels and
supervoxels with respect to the ground-truth stroke le-
sions of ATLAS. We first computed the mean rate of
FP voxels, i.e., incorrectly classified as abnormal (Ta-
ble 1, row 2), with respect to all classified voxels from
the analyzed object(s) — i.e., the total number of vox-
els inside the right hemisphere for SAAD and all vox-
BIOIMAGING 2020 - 7th International Conference on Bioimaging
78
Table 1: Quantitative results for images from the ATLAS dataset with stroke lesions in the hemispheres, cerebellum, and
brainstem. Higher detection rate means better accuracy. Lower false positive rate means better accuracy.
Hemispheres
Cerebellum and
Brainstem
SAAD BADRESC BADRESC
#1
Detection Rate
0.8324 0.8298 0.6829
#2
False Positive
Voxel Rate
0.050 ± 0.027 0.005 ± 0.006 0.005 ± 0.004
#3
Number of False
Positive Supervoxels
53.84 ± 19.64 21.48 ± 13.82 25.63 ± 15.64
#4
False Positive
Supervoxel Rate
0.14 ± 0.05 0.104 ± 0.069 0.097 ± 0.049
SAAD
GT
image 1 image 2 image 3 image 4 image 5 image 6
BADRESC
no analysis of the
cerebellum and brainstem
Figure 6: Results on ATLAS dataset. Each column is a test image: Images 1-3 have lesions in the hemispheres, Image
4 contains a lesion in the brainstem whereas Images 5-6 have lesions in the cerebellum. First row: Ground-truth lesion
segmentations. Second row: Results of BADRESC. Third row: Results of SAAD. Arrows indicate undetected lesions. Since
SAAD only detects lesions in the hemispheres, there are no results for Images 4-6.
els from the hemispheres, cerebellum, and brainstem
for BADRESC.
At the next level, we estimated FP supervoxels
as those whose voxels overlap less than 15% with
ground-truth lesion voxels. We computed the mean
number of FP supervoxels and its proportion with re-
spect to the total number of supervoxels from the an-
alyzed object(s) (Table 1, rows 3 and 4). The first
metric gives us an estimation of the visual-inspection
user effort. The second metric checks how imprecise
is the detection regarding the total number of regions
that the user has to visually analyze.
4 RESULTS AND DISCUSSION
Table 1 summarizes all quantitative results whereas
Fig. 6 presents some visual results. Although SAAD
presents a slightly better detection rate for hemi-
spheric lesions (0.8324) compared to BADRESC
(0.8298), it consistently presents worse FP rates (see
its FP in Fig. 6). SAAD incorrectly classifies 14% of
supervoxels on average — which consists of 5% of
the analyzed voxels in the hemisphere. Conversely,
as Table 1 shows, BADRESC presents considerably
less FP supervoxels than SAAD (average of 21.48 su-
pervoxels against 53.84). This corresponds to 10.4%
of analyzed supervoxels and less than 1% of voxels in
the entire brain (see Fig. 6).
SAAD is not able to detect lesions with low asym-
metries, even if they are well-contrasted with their
surrounding tissues. BADRESC does not have this
limitation (compare the results for Image 2 in Fig. 6).
However, both methods are not robust to detect very
small-scale anomalies (Fig. 6, Image 3).
BADRESC is less accurate to detect lesions in the
BADRESC: Brain Anomaly Detection based on Registration Errors and Supervoxel Classification
79

cerebellum and brainstem (detection rate of 0.6829).
Indeed, some lesions seems to be more challenging,
specially in the cerebellum, whose appearances are
similar to their surrounding tissues (Fig. 6, Image
6). However, its FP scores are similar to those of
hemispheric lesions which confirms the stability of
the method (compare rows 2-4 for BADRESC in Ta-
ble 1).
5 CONCLUSIONS
We presented a new unsupervised method for brain
anomaly detection that combines registration errors
and supervoxel classification. Our approach, named
BADRESC, adapts a recent supervoxel-based ap-
proach (SAAD) to detect outliers as anomalies from
registration errors in the hemispheres, cerebellum,
and brainstem. BADRESC was validated on 3T MR-
T1 images of stroke patients with annotated lesions,
attaining similar detection accuracy to SAAD for le-
sions in the hemispheres and substantially less false
positives. BADRESC also detects lesions in the cere-
bellum and brainstem with promising results.
For future work, we intend to improve BADRESC
by optimizing its parameters and using additional vi-
sual analytics techniques to improve seeding and fur-
ther investigate other anomaly features and classifiers
to yield better detection rates, specially for the cere-
bellum and brainstem.
ACKNOWLEDGEMENTS
The authors thank CNPq (303808/2018-7), and
FAPESP (2014/12236-1) for the financial support.
REFERENCES
Akkus, Z. and et al. (2017). Deep learning for brain MRI
segmentation: state of the art and future directions. J
Digit Imaging, 30(4):449–459.
Aslani, S., Dayan, M., Murino, V., and Sona, D.
(2018). Deep 2D encoder-decoder convolutional neu-
ral network for multiple sclerosis lesion segmenta-
tion in brain MRI. In Medical Image Computing
and Computer-Assisted Intervention (MICCAI), pages
132–141.
Fonov, V. S. and et al. (2009). Unbiased nonlinear average
age-appropriate brain templates from birth to adult-
hood. Neuroimage, 47:S102.
Gao, Y., Riklin-Raviv, T., and Bouix, S. (2014). Shape
analysis, a field in need of careful validation. Human
Brain Mapping, 35(10):4965–4978.
Goetz, M. and et al. (2014). Extremely randomized trees
based brain tumor segmentation. Proc. of BRATS
challenge-MICCAI, pages 006–011.
Guo, D. et al. (2015). Automated lesion detection on MRI
scans using combined unsupervised and supervised
methods. BMC Medical Imaging, 15(1):50.
Juan-Albarrac
´
ın, J., Fuster-Garcia, E., Manj
´
on, J. V., Rob-
les, M., Aparici, F., Mart
´
ı-Bonmat
´
ı, L., and Garc
´
ıa-
G
´
omez, J. M. (2015). Automated glioblastoma seg-
mentation based on a multiparametric structured un-
supervised classification. PLoS One, 10(5):e0125143.
Klein, S., Staring, M., Murphy, K., Viergever, M., and
Pluim, J. (2010). elastix: A toolbox for intensity-
based medical image registration. IEEE T Med Imag,
29(1):196–205.
Kooi, T., Litjens, G., Van Ginneken, B., Gubern-M
´
erida, A.,
S
´
anchez, C. I., Mann, R., den Heeten, A., and Karsse-
meijer, N. (2017). Large scale deep learning for com-
puter aided detection of mammographic lesions. Med
Image Anal, 35:303–312.
Liew, S.-L. and et al. (2018). A large, open source dataset
of stroke anatomical brain images and manual lesion
segmentations. Scientific Data, 5:180011.
Manevitz, L. M. and Yousef, M. (2001). One-class SVMs
for document classification. J Mach Learn Res,
2:139–154.
Manj
´
on, J. V. and Coup
´
e, P. (2016). volBrain: An online
MRI brain volumetry system. Front Neuroinform, 10.
Martins, S. B., Bragantini, J., Yasuda, C. L., and Falc
˜
ao,
A. X. (2019a). An adaptive probabilistic atlas for
anomalous brain segmentation in MR images. Med
Phys, 46(11):4940–4950.
Martins, S. B., Ruppert, G., Reis, F., Yasuda, C. L., and
Falc
˜
ao, A. X. (2019b). A supervoxel-based approach
for unsupervised abnormal asymmetry detection in
MR images of the brain. In Proc. IEEE ISBI, pages
882–885.
Martins, S. B., Telea, A. C., and Falc
˜
ao, A. X. (2019c). Ex-
tending supervoxel-based abnormal brain asymmetry
detection to the native image space. In IEEE Eng in
Med Bio Society (EMBC), pages 450–453.
Otsu, N. (1979). A threshold selection method from gray-
level histograms. IEEE Trans. on systems, man, and
cybernetics, 9(1):62–66.
Pereira, S., Pinto, A., Alves, V., and Silva, C. A. (2016).
Brain tumor segmentation using convolutional neu-
ral networks in MRI images. IEEE T Med Imag,
35(5):1240–1251.
Pinto, A., Pereira, S., Correia, H., Oliveira, J., Rasteiro,
D. M., and Silva, C. A. (2015). Brain tumour seg-
mentation based on extremely randomized forest with
high-level features. In IEEE Eng in Med Bio Society
(EMBC), pages 3037–3040.
Qi, K. and et al. (2019). X-Net: Brain stroke lesion
segmentation based on depthwise separable convolu-
tion and long-range dependencies. In Medical Im-
age Computing and Computer-Assisted Intervention
(MICCAI). to appear. Currently available on arXiv
preprint arXiv:1907.07000.
BIOIMAGING 2020 - 7th International Conference on Bioimaging
80

Shakeri, M. and et al. (2016). Statistical shape analysis of
subcortical structures using spectral matching. Com-
puterized Medical Imaging and Graphics, 52:58–71.
Soltaninejad, M. and et al. (2017). Automated brain tu-
mour detection and segmentation using superpixel-
based extremely randomized trees in FLAIR MRI. Int
J Comput Ass Rad, 12(2):183–203.
Taylor, J. R., Williams, N., Cusack, R., Auer, T., Shafto,
M. A., Dixon, M., Tyler, L. K., Henson, R. N.,
et al. (2017). The cambridge centre for ageing and
neuroscience (cam-can) data repository: structural
and functional mri, meg, and cognitive data from a
cross-sectional adult lifespan sample. Neuroimage,
144:262–269.
Thyreau, B. and et al. (2018). Segmentation of the hip-
pocampus by transferring algorithmic knowledge for
large cohort processing. Med Image Anal, 43:214–
228.
Tustison, N. J. et al. (2010). N4ITK: improved N3 bias
correction. IEEE T Med Imag, 29(6):1310–1320.
Vargas-Mu
˜
noz, J. E., Chowdhury, A. S., Alexandre, E. B.,
Galv
˜
ao, F. L., Miranda, P. A. V., and Falc
˜
ao, A. X.
(2019). An iterative spanning forest framework for
superpixel segmentation. IEEE T Image Process.
Wang, L. and et al. (2001). Statistical analysis of hip-
pocampal asymmetry in schizophrenia. Neuroimage,
14(3):531–545.
BADRESC: Brain Anomaly Detection based on Registration Errors and Supervoxel Classification
81
