
Regression Analysis of Historical Blood Donors to Improve Clinic
Scheduling
Geoffrey Pond
a
and Isabelle Turner
Department of Management, Royal Military College of Canada, Kingston, Ontario, Canada
Keywords:
Healthcare, Scheduling, Overbooking, Regression.
Abstract:
The Canadian Blood Services (CBS) is responsible for the collection, storage and distribution of blood prod-
ucts throughout the country. Like all civilian hospitals and medical facilities, the Canadian Armed Forces
(CAF) Health Services System relies on CBS to provide it with required blood products through the Cana-
dian Armed Forces Blood Distribution System. Under normal circumstances, CBS collects all blood products
through organized events including mobile and permanent clinics, where prospective donors attend via ei-
ther pre-booked appointments or unscheduled walk-ins. Of those who make appointments, only a portion
show-up for their appointment and of these only some yield a successful donation. As donation clinics are
capacity-constrained by both the labour-force and infrastructure, CBS is motivated to maximize the utilisa-
tion of existing resources through implementation of an overbooking policy. Leveraging historical data, a
statistical analysis was conducted to identify factors influencing conversion rates to aid in developing an im-
proved scheduling policy. The location of the centre, the day of the week as well as demographic groups were
included as candidate independent variables in a regression model to forecast the proportion of pre-booked
appointments that are attended and yield a collection.
1 INTRODUCTION
CBS is responsible for the collection, storage and dis-
tribution of blood products throughout the country,
except in the province of Qu
´
ebec. Its storage and dis-
tribution extends to the CAF domestically and during
expeditionary engagements. CBS currently has forty
permanent sites across the country and holds up to
20,000 donor clinics annually (Smith et al., 2011).
Even after extensive recruiting campaigns, the
number of donors consistently remains low and re-
flects roughly three to four percent of the Canadian
population (Smith et al., 2011). Although one in
two Canadians is eligible to donate, only one in sixty
makes a donation. While some individuals are un-
able to make donations for medical reasons ranging
from fresh tattoos or recent travel to specific coun-
tries, others simply choose not to donate because of
religious beliefs or a fear of needles. An aging pop-
ulation and supplying transfusions of a wide range of
critical medial conditions including surgeries, cancer
treatments and organ transplants are prime examples
of why there is an increased requirement for blood
a
https://orcid.org/0000-0001-5069-0845
products. It is anticipated that the demand for blood
will continue to increase and potentially surpass the
amount collected. In addition to efforts to grow the
donor pool, all members involved in the provision
and transfusion of blood components are attempting
to limit their waste and improve their utilization.
The physical limits within the clinic itself are the
number of beds available and the number of staff. The
staff required to operate the clinic is a combination of
reception staff, DCAs, RNs and volunteers. Ideally,
to optimize the operating costs of the clinic to the
donation ratio, all available collection capacity slots
should be filled. As previously mentioned, even if the
number of pre-booked appointments reaches the col-
lection capacity of a specific clinic, not all pre-booked
donors attend their appointments. These no-shows
can potentially lead to wasted resources if they are not
filled with walk-in donors. In addition, it is not as sim-
ple as identifying how many pre-booked donors at-
tend their scheduled appointment because not all pre-
booked donors who attend their scheduled appoint-
ments yield a successful donation. The prospective
donors may not meet all eligibility criteria or they
may not successfully donate the required 450 millil-
itres required which result in a deferral. The total
344
Pond, G. and Turner, I.
Regression Analysis of Historical Blood Donors to Improve Clinic Scheduling.
DOI: 10.5220/0008987003440349
In Proceedings of the 9th International Conference on Operations Research and Enterprise Systems (ICORES 2020), pages 344-349
ISBN: 978-989-758-396-4; ISSN: 2184-4372
Copyright
c
2022 by SCITEPRESS – Science and Technology Publications, Lda. All rights reserved

number of deferrals for each clinic varies widely. The
number of estimated deferrals will not be considered
in the developed regression model.
1.1 Literature Review
In (Muthuraman and Lawley, 2008), a stochastic op-
timization model is developed where patient service
times are exponentially distributed and individual pa-
tients categorized by similar attributes share a com-
mon no-show probability. The work is theoretical in
nature and, as such, the authors do not posit on what
attributes might be used to cluster patients and how a
no-show probability might be developed for that clus-
ter. The objective function of the optimization model
is to maximize profit and consequently, the model is
applicable only to environments having a profit mo-
tive. In (Li et al., 2019), the optimization model of
(Muthuraman and Lawley, 2008) is leveraged with a
no-show probability unique to each individual patient
based on a variety of socio-demographic and con-
textual parameters. Most notably, a patient’s histor-
ical propensity to not show up for an appointment is
a strong indicator of future no-shows. Monte Carlo
simulation of empirical patient records suggest the
combination of these models is effective in maximiz-
ing clinic profit. The motivations of Canadians in do-
nating blood is specifically explored by Smith et al.
((Smith et al., 2011)). Through extensive donor inter-
views, their research suggests that none of the above
socio-demographic variables are influential to an indi-
vidual’s propensity to donate blood. Nor do Canadian
blood donors subscribe to individual altruism. Rather,
they are motivated by aspirations to fit within norma-
tive behaviour defined by social or workplace groups.
It’s common for sports teams, clubs, or workplaces to
organize and commit to blood donation events. In this
context, it is neither altruism nor socio-demographic
variables that are the most valuable of predictors but
what social groups the individual belongs to.
A utility function first proposed in (LaGanga and
Lawrence, 2007) was later applied to the overbooking
policy of a medical clinic in (LaGanga and Lawrence,
2012). This utility function consider the time patients
spend waiting, overtime of medical staff, and conse-
quently represents a tradeoff between the costs asso-
ciated with overbooking (wait and overtime) versus
no-shows (resource idleness). In this case, a common
no-show probability was applied uniformly across all
patients. As in (Muthuraman and Lawley, 2008), ap-
pointment slots are also of consistent length. These
same costs are included in the model presented in
(Chen et al., 2018) but, here, the authors adopt flexible
appointment start times in lieu of fixed appointment
slots. Zacharias and Pinedo (2014) present a similar
model but includes weights for patients representing
differing costs by patient. In (Kros et al., 2009), an
additional cost is included in the utility function - that
is the cost of burnout among service providers result-
ing from sustained overbooking. Liu et al. (N. and
Ziya, 2014) consider policies meant to encourage pa-
tient attendance (e.g., reminder phone calls) and their
associated costs as part of the objective function.
A game theoretic approach is adopted in (Zeng
et al., 2009) and (Zeng et al., 2013) where the prob-
ability of the patient not showing up for the appoint-
ment is a function of the overbooking strategy itself.
As the clinic overbooks more aggressively, the in-
creased patient waiting time dissuades patients from
showing up to the appointment. Zeng et al. (2010)
also demonstrate that when the traditional problem
formulation includes homogeneous patients having a
common no-show probability, the objective function
(to minimize costs - or maximize profit) is convex.
For heterogenous patients, the authors propose a local
neighbourhood search solution strategy.
In both (Huang and Zuniga, 2012) and (Huang
and Hanauer, 2014) the no-show probability is con-
sidered dynamic. Various scenarios are simulated and
ANOVA (in conjunction with the Tukey post-hoc test)
to identify strategies having significantly better re-
sults. It also considers patients to be homogeneous
in this regard. The focus of (Huang and Hanauer,
2014) was to predict the patient’s probability of no-
show as a function of a variety of socio-demographic
and contextual parameters, as in (Li et al., 2019). Un-
like in (Li et al., 2019), the authors of (Huang and
Hanauer, 2014) translated this probability to a binary
show/no-show variable by minimizing the error rate
(rather than the system’s total cost).
Other notable works include a discrete event sim-
ulation is leveraged by (Fan et al., 2016) to establish
the optimal length of schedule slots and the optimal
number of patients to schedule in those slots. Both
booked appointments and walk-in patients are consid-
ered in (Kim and Giachetti, 2006) where the paper’s
aim is to develop the stochastic functions leading to a
mean patient no-show probability. Despite the prolific
use of overbooking strategies within the tourism in-
dustry, (Riasi et al., 2019) noted that few hotels have
adopted the theoretically superior risk-based models
similar to those described above. Instead, a determin-
istic approach is chosen based on the ratio of hotel
capacity to historical show rates.
Notwithstanding the prevalence of these prob-
lems throughout the extent literature, most authors
have focused on largely theoretical applications hav-
ing untested utility or objective functions. The long-
Regression Analysis of Historical Blood Donors to Improve Clinic Scheduling
345

lasting negative bias among consumers resulting from
overbooking strategies detailed in (v. Wagenheim and
Bayon, 2007) casts doubt on these utility functions.
The above works also limited by the assumption that
no patients balk - assuming the patient shows up to
the appointment, he or she is committed to system.
The current problem diverges from the above in
the following two ways:
i. Canadian donors are not financially compen-
sated. The problem is therefore not one that can
be optimized by maximizing cash flows. Fur-
ther, the organization is a not-for-profit. Conse-
quently, donors have no financial motivation to
give blood.
ii. Canada is geographically and culturally diverse.
Patient behaviour in one region cannot be as-
sumed to be identical to that of another. In many
of the previous works, one model was developed
on an aggregate level assuming all clinics behave
in a similar fashion.
iii. An appointment isn’t necessary. Walk-ins ac-
count for a substantial portion of available slots.
With the exception of (Kim and Giachetti, 2006),
the above works consider only booked appoint-
ments.
In summation, the models used throughout the ex-
tent literature cannot be applied to the current prob-
lem for one or more of the aforementioned challenges.
Notwithstanding, many of the same themes will be
applied in the development of a model unique to the
current problem.
2 BLOOD DONATION IN
CANADA
CBS divides into 13 separate regional centres across
the country except for H
´
ema-Qu
´
ebec, which provides
blood products to the province of Qu
´
ebec. The re-
gional centres are the following:
1. British Columbia - Yukon (BCY)
2. Calgary
3. Edmonton
4. Halifax
5. Hamilton
6. London
7. New Brunswick
8. Newfoundland
9. Ottawa
10. Sudbury
11. Saskatchewan
12. Toronto
13. Winnipeg
All thirteen centres offer a combination of both
permanent and mobile sites for blood product collec-
tion. These centres have a variety of different active
donor bases. The term active donors represent those
who have made a successful donation within the last
eighteen months.
Blood donors are volunteers and they do not re-
ceive any financial or negative repercussions if they
do not show up for their scheduled appointments. A
predetermined number of slots are available per day
which depends on the number of clinic staff, the hours
available and the size of the clinic. While many med-
ical facilities can easily increase capacity by provid-
ing overtime pay to staff members, as a non-for-profit
organisation that depends substantially on volunteer
staff, this alternative is simply not an attractive op-
tion for CBS. Therefore, it is critical that CBS make
best use of the available time to manage productivity.
An additional point to highlight is that blood prod-
ucts have a specific shelf-life, which varies depending
on the component. CBS takes into consideration their
current inventory when conducting mobile clinics and
can try to target specific blood types in shortages.
We consider that the total number attending a
blood donation clinic (a) is equal to the total num-
ber of booked appointments (b) less those who are
no-shows (n) plus those who didn’t book an appoint-
ment but ‘walk-in’ to the clinic (w). The ultimate goal
is to maximize the utilization of clinic resources by
ensuring the total attendance (a) is as close to the
clinic’s capacity as possible. Among the variables
b, n, and w, the only controllable factor is the num-
ber of booked appointments (b). By extension, the
question becomes one of how many appointments to
book for a clinic in order to accommodate an expected
number of walk-in donors but also make up the differ-
ence for any booked appointments that are no-shows.
This paper lays the foundation for an overbooking
policy by developing models to forecast the number
of no-shows and walk-ins.
a = b − n + w (1)
In order to account for no-shows and deferred
prospective donors, an overbooking strategy support-
ing clinic attendance will be explored. Blood clinics,
both fixed and mobile sites, also offer the possibility
of walk-ins, therefore the ratio of the walk-ins filling
the collection capacity will be considered.
ICORES 2020 - 9th International Conference on Operations Research and Enterprise Systems
346
2.1 Walk-ins
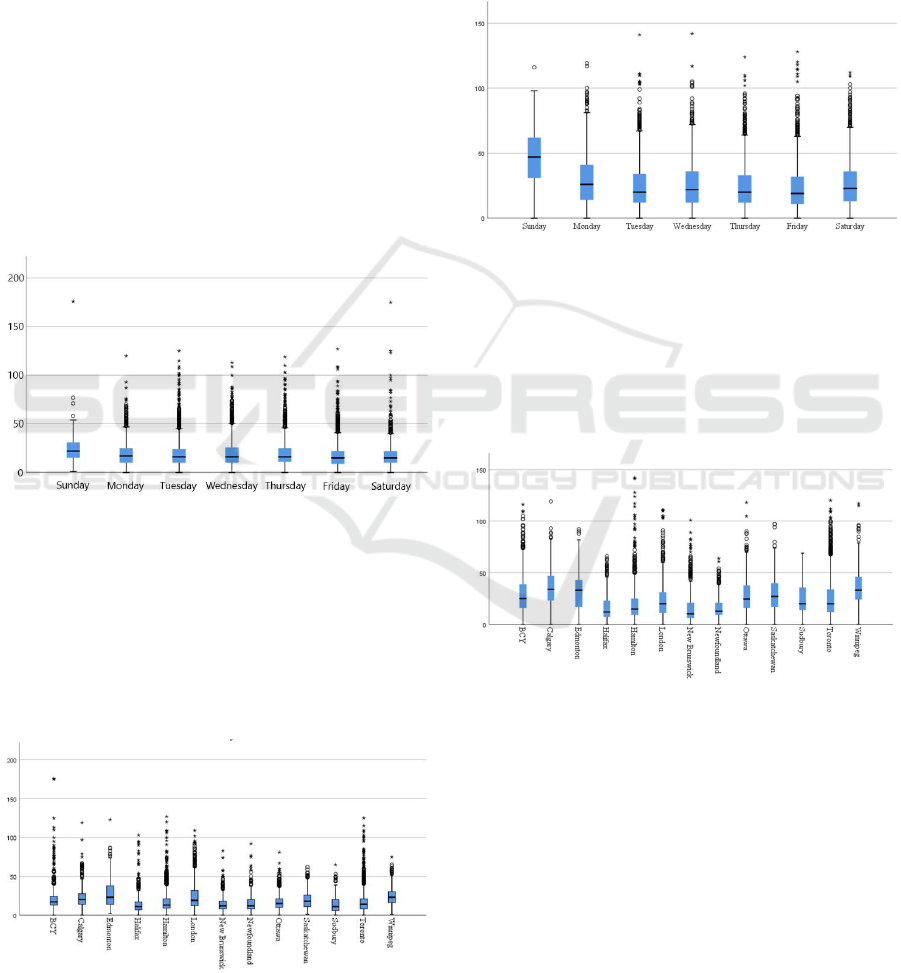
By days of the week, the number of walk-ins at clin-
ics throughout the country are illustrated in Figure 1.
In these boxplots, the whisker length is one-and-a-
half times the interquartile range. Points beyond the
inner fence are either mild or extreme outliers. Ex-
treme outliers are those more than three times the in-
terquartile range beyond the third quartile or below
the first quartile. Walk-in donors present in higher
volumes on Sundays. This is largely due to the mo-
bile events run on weekends (e.g., “blood drives”)
that are attended primarily by donors not having ap-
pointments. Conversely, fixed permanent clinics are
primarily attended by donors having booked appoint-
ments. Also clear from Figure 1 is a skewed dataset.
Some large mobile clinics attract a large number or
walk-in donors, albeit this is uncommon. As these
variables are also non-negative, the result is substan-
tial skewness.
Figure 1: The number of walkins attending CBS clinics
throughout 2018, by day of the week.
Figure 2 illustrated the distribution of walk-in vol-
umes by region within the country. Interestingly,
differences by region suggest that donor behaviour
varies by region of the country. The prairie region
(Edmonton, Calgary, and Winnipeg) tends to attract
more walk-in donors than any other area of the coun-
try.
Figure 2: The number of walkins attending CBS clinics
throughout 2018, by region.
2.2 No-shows
While Sundays are appealing to a large donor base,
it appears, from Figure 3 that appointments booked
on this day are the least often actually attended. Nat-
urally, part of this high number of skipped appoint-
ments is due simply to the higher number of booked
appointments on the same day - and as a consequence,
the two variables are not independent.
Figure 3: The number of no-shows attending CBS clinics
throughout 2018, by day of the week.
In the same way, skipped appointments are more
prevalent in the prairie regions - as depicted in Fig-
ure 4. This was the same region of the country that
enjoyed a large donor base attending clinics without a
booked appointment (see Figure 2). Again, there ap-
pears to be a high correlation between the two figures.
Figure 4: The number of no-shows attending CBS clinics
throughout 2018, by region.
3 REGRESSION MODELS
The descriptive statistics (boxplots) presented in the
previous section suggest that another factor underlies
the strong correlation between the number of walk-
ins or no-shows (as functions of either region or day
of the week). We posit that to be the size of the sur-
rounding donor base. Each of these regions consists
of numerous permanent clinics and hundreds of mo-
bile clinics having various sizes to accommodate the
local donor base. Unfortunately, the size of the local
Regression Analysis of Historical Blood Donors to Improve Clinic Scheduling
347

donor base to a specific clinic is not available and so
the clinic’s capacity was used in our regression mod-
els as a proxy measure.
Two regression models were developed: one to
forecast the number of walk-in donors and the other to
forecast the number of no-shows. Given that a clinic
would know with certainty the number of booked
appointments in advance of donation date, little is
gained by attempting to develop a forecast model
for that variable. The regression model for walk-in
donors ( ˆy
w
) is as follows:
ˆy
w
= α + β
1
x
1
+ β
2
x
2
+ β
3
x
3
+ β
4
x
4
+ β
5
x
5
+ β
6
x
6
+ β
7
x
7
+ β
8
x
8
β
9
x
9
+ β
10
x
10
+ β
11
x
11
+ β
12
x
12
+ β
13
x
13
+ γ
1
x
14
+ γ
2
x
15
+ γ
3
x
16
+ γ
4
x
17
+ γ
5
x
18
+ γ
6
x
19
+ γ
7
x
20
+ δx
21
(2)
where:
α is the vertical axis intercept
β
i
is the coefficient for regressor x
i
representing the region i
γ
j
is the coefficient for regressor x
j−13
representing
day of the week j − 13
δ is the clinic’s nominal capacity (in daily
availability of donor slots)
The ordering of days starts with Monday, j = 14,
and proceeds sequentially through Sunday, j = 20.
The ordering of regions follows Figure 4 where re-
gion i = 1 is British Columbia - Yukon (BCY).
The regression model for the number of no-shows
is quite similar:
ˆy
n
= α + β
1
x
1
+ β
2
x
2
+ β
3
x
3
+ β
4
x
4
+ β
5
x
5
+ β
6
x
6
+ β
7
x
7
+ β
8
x
8
β
9
x
9
+ β
10
x
10
+ β
11
x
11
+ β
12
x
12
+ β
13
x
13
+ γ
1
x
14
+ γ
2
x
15
+ γ
3
x
16
+ γ
4
x
17
+ γ
5
x
18
+ γ
6
x
19
+ γ
7
x
20
+ δ
1
x
21
+ δ
2
x
22
(3)
but includes the additional variable x
22
representing
the number of pre-booked appointments having corre-
sponding coefficient δ
2
. Integrating with Equation 1
the number of extended attendees ( ˆy
a
) is:
ˆy
a
= b − ˆy
n
+ ˆy
w
(4)
4 RESULTS
Pearson’s correlation coefficient (commonly known
as r) is .855 suggesting a reasonably good model
for predicting the number of no-shows by using the
model described in the previous section. Variables
having a statistically significant influence on ˆy
n
and
the corresponding coefficient values are provided in
Table 1. Unfortunately, for the walk-in model, a value
of 0.335 was obtained for r suggesting the model has
relatively little value. This is a somewhat curious re-
sult, suggesting that the independent variables found
to be useful in forecasting the number of no-shows are
of limited value in predicting the number of walk-ins.
The current model is limited in that it doesn’t con-
sider donor demographics. The age and sex of a
donor is known to influence the propensity of a donor
to balk. Further, it is not known whether walk-in
donors were successful in making a donation (many
are screened out for a variety of risk factors - re-
cent international travel, illness, recent tattoos, sexual
practices, etc.). The model also considers all clinics
within a specific region equally while it is known that
urban donors behave differently from rural donors and
by extension, results for clinic utilization is different.
Rather than using the clinic capacity as a proxy for
the size of the surrounding population, the model may
be improved by representing each clinic individually
rather than treating all clinics within a region equally.
Finally, whether the clinic is a mobile or permanent
clinic should also be considered.
5 CONCLUSIONS
Simple multiple linear regression yields a satisfactory
model forecasting the number of donors who have
booked appointments to donate blood but fail to show
up for the appointment. Influential factors are demon-
strated to include the day of the week, the clinic’s
region throughout the country, the total number of
booked appointments for that event, and the clinic’s
capacity. A similar model developed to forecast the
number of walk-in donors failed to yield useful re-
sults. Other potential factors influencing the number
of walk-ins are posited and should be considered in
future development of this model.
Given the highly skewed boxplots presented for
attendance by day or region, it is likely that the resid-
uals are not distributed normally. Other models (beta-
regression or log-linear regression) will also be at-
tempted to improve the model performance.
REFERENCES
Chen, Y., Kuo, Y.-H., Fan, P., and Balasubramanian, H.
(2018). Appointment overbooking with different time
slot structures. Computers & Industrial Engineering,
124:237–248.
ICORES 2020 - 9th International Conference on Operations Research and Enterprise Systems
348

Fan, P., Fan, D., Kuo, Y., and Chen, Y. (2016). Modeling
and evaluation of overbooking rules for primary health
care clinic with different patient behavior. In Proceed-
ings of the 2016 IEEE International Conference on In-
dustrial Engineering and Engineering Management.
Huang, Y. and Hanauer, D. (2014). Patient no-show predic-
tive model development using multiple data sources
for an effective overbooking approach. Applied Clini-
cal Informatics, 5(3):836–860.
Huang, Y. and Zuniga, P. (2012). Dynamic overbooking
scheduling system to improve patient access. Journal
of the Operational Research Society, 63(6):810–820.
Kim, S. and Giachetti, R. (2006). A stochastic mathemat-
ical appointment overbooking model for healthcare
providers to improve profits. IEEE Transactions on
systems, man, and cybernetics - Part A: Systems and
humans, 36(6):1211–1219.
Kros, J., Dellana, S., and West, D. (2009). Overbooking in-
creases patient access at east carolina university’s stu-
dent health services clinic. Interfaces, 39(3):271–287.
LaGanga, L. and Lawrence, S. (2007). Clinic overbooking
to improve patient access and increase provider pro-
ductivity. Decision Sciences, 38(2):251–276.
LaGanga, L. and Lawrence, S. (2012). Appointment over-
booking in health care clinics to improve patient ser-
vice and clinic performance. Production and Opera-
tions Management, 21(5):874–888.
Li, Y., Tang, S., Johnson, J., and Lubarsky, D. (2019). Indi-
vidualized no-show predictions effect on clinic over-
booking and appointment reminders. Production and
Operations Management, 28(8):2068–2086.
Muthuraman, K. and Lawley, M. (2008). A stochastic over-
booking model for outpatient clinical scheduling with
no-shows. IIE Transactions, 40(9):820–837.
N., L. and Ziya, S. (2014). Panel size and overbooking de-
cisions for appointment-based services under patient
no-shows. Production and Operations Management,
23(12):2209–2223.
Riasi, A., Schwartz, Z., and Beldona, S. (2019). Hotel over-
booking strategy: who and how? International Jour-
nal of Hospitality Management, 82:1–4.
Smith, A., Matthews, R., and Fiddler, J. (2011). Blood do-
nation and community: Exploring the influence of so-
cial capital. International Journal of Social Inquiry,
4(1):45–63.
v. Wagenheim, F. and Bayon, T. (2007). Behavioural con-
sequences of overbooking service capacity. Journal of
Marketing, 17(4):36–47.
Zeng, B., Zhao, H., and Lawley, M. (2009). Clinic over-
booking and patient responses a game theoretical ap-
proach. In Proceedings of the 2009 industrial engi-
neering research conference.
Zeng, B., Zhao, H., and Lawley, M. (2013). The im-
pact of overbooking on primary care patient no-show.
IIE Transactions on Healthcare Systems Engineering,
3(3):147–170.
APPENDIX
Table 1: Regressors having statistical significance in the
model predicting the number of no-shows.
Descriptor Variable Value Significance
Constant α .832 .000
Calgary β
2
-1.588 .000
Edmonton β
3
-2.086 .000
Halifax β
4
-1.349 .000
Hamilton β
5
.696 .003
London β
6
2.329 .000
NFLD β
8
2.847 .000
Sudbury β
11
5.080 .000
Toronto β
12
2.786 .000
Winnipeg β
13
2.824 .000
Tuesday γ
15
-.880 .000
Friday γ
18
.764 .000
Saturday γ
19
1.083 .000
Sunday γ
20
7.847 .000
Num Prebooked δ
1
.380 .000
Clinic Capacity δ
2
-.057 .000
Regression Analysis of Historical Blood Donors to Improve Clinic Scheduling
349
