
RaDE: A Rank-based Graph Embedding Approach
Filipe Alves de Fernando, Daniel Carlos Guimar
˜
aes Pedronette, Gustavo Jos
´
e de Sousa,
Lucas Pascotti Valem and Ivan Rizzo Guilherme
Institute of Geosciences and Exact Sciences, UNESP - S
˜
ao Paulo State University, Rio Claro, SP, Brazil
Keywords:
RaDE, Graph Embedding, Network Representation Learning, Ranking.
Abstract:
Due to possibility of capturing complex relationships existing between nodes, many application benefit of
being modeled with graphs. However, performance issues can be observed on large scale networks, making
it computationally unfeasible to process information in various scenarios. Graph Embedding methods are
usually used for finding low-dimensional vector representations for graphs, preserving its original properties
such as topological characteristics, affinity and shared neighborhood between nodes. In this way, retrieval
and machine learning techniques can be exploited to execute tasks such as classification, clustering, and link
prediction. In this work, we propose RaDE (Rank Diffusion Embedding), an efficient and effective approach
that considers rank-based graphs for learning a low-dimensional vector. The proposed approach was evaluated
on 7 network datasets such as a social, co-reference, textual and image networks, with different properties.
Vector representations generated with RaDE achieved effective results in visualization and retrieval tasks when
compared to vector representations generated by other recent related methods.
1 INTRODUCTION
In many real-world scenarios, the representation of
connections among elements is of crucial relevance.
In fact, it can be said that every entity in the universe
is connected with another in some aspect. Therefore,
with the prevalence of network data collected nowa-
days, from social media to communication or bio-
logical networks, learning and effectively represent-
ing such connections has become an essential task in
many applications (Huang et al., 2019).
Graphs are a natural way for representing entities
and connections. In such scenario, graphs assumed a
central role as an effective and powerful data repre-
sentation tool. Additionally, effective graph analysis
allow a deeper understanding of useful information
hidden behind the data. As a result, several important
applications can benefit from such analyses and have
their effectiveness improved, such as node classifica-
tion/retrieval, node recommendation, link prediction,
among others (Cai et al., 2018). Such wide range of
applications justifies the significant attention received
by graph-based approaches in the last decades (Huang
et al., 2019; Cai et al., 2018; Goyal and Ferrara,
2017).
Although graph analysis has emerged as an essen-
tial task, most of related methods requires high com-
putational costs (Cai et al., 2018). A promising solu-
tion consists in graph embedding approaches, which
have been increasingly exploited due to its capacity
of creating vector representations for nodes, edges or
even an entire network. Once graph structures can
be well represented into a vector space, many math-
ematical and machine learning tools can be utilized
for tasks such as classification, information retrieval,
clustering and so forth. Besides that, vector repre-
sentations generated by graph embedding methods
are able to compress huge networks into a significant
smaller amount of data while preserving most of orig-
inal information.
Graph embedding methods usually takes into ac-
count some of the structural aspects of the original
network for creating the embedding representation.
According to (Cai et al., 2018), the main goal of
graph embedding approaches is to represent a graph
as low dimensional vectors, while its structures are
preserved. As a result, high-effective graph embed-
ding methods are capable of keeping the accuracy of
retrieval and machine learning tasks, even when orig-
inal network had been significantly compressed. Ac-
tually, in some situations, the generated embedding
can even improve the accuracy in comparison to the
original graph representation.
In such scenario of crescent interest, various graph
embedding methods have been proposed in the last
years (Tang et al., 2015; Grover and Leskovec, 2016;
142
Alves de Fernando, F., Pedronette, D., José de Sousa, G., Valem, L. and Guilherme, I.
RaDE: A Rank-based Graph Embedding Approach.
DOI: 10.5220/0008985901420152
In Proceedings of the 15th International Joint Conference on Computer Vision, Imaging and Computer Graphics Theory and Applications (VISIGRAPP 2020) - Volume 5: VISAPP, pages
142-152
ISBN: 978-989-758-402-2; ISSN: 2184-4321
Copyright
c
2022 by SCITEPRESS – Science and Technology Publications, Lda. All rights reserved
Wang et al., 2016; Ou et al., 2016). Most of them con-
sider node embedding tasks, which also constitutes
the main objective of this work. Also references in the
literature (Cui et al., 2019) as Network Embedding or
Network Representation Learning (NRL), such meth-
ods are usually used for finding low-dimensional vec-
tor representation for nodes, preserving its original
properties such as topological characteristics, affinity
and shared neighborhood between nodes. Different
approaches focus on distinct aspects of embedding.
The central idea of (Grover and Leskovec, 2016) con-
sists in its flexible notion of a node’s network neigh-
borhood. On the other hand, the goal of preserv-
ing asymmetric transitivity is addressed by (Ou et al.,
2016). First-order and second-order proximity are
considered by (Wang et al., 2016) to preserve the net-
work structure, while (Tang et al., 2015) focuses on
large-scale datasets. Figure 1 illustrates a general sce-
nario that different NRL methods can be applicable.
In this paper we present RaDE, a novel graph
embedding algorithm for generating low-dimensional
representations for nodes in networks. The proposed
algorithm is completely unsupervised and defined
through a ranked-based model. The central idea of
our work consists in identifying high-effective repre-
sentative nodes. In this way, each network node is
represented according to its similarity to such repre-
sentatives. Therefore, nodes with high-similarity to
each other are expected to be also similar to same rep-
resentatives. The representatives are selected based
on the density of reciprocal similarity to its neighbors,
which operates as an effectiveness estimation of rep-
resentative rankings.
The main contributions and novelties of our pro-
posed method are three-fold: (i) the ranked-based
model used provides efficient structures for represent-
ing similarity information among nodes, which is in-
novative in graph embedding approaches; (ii) the pro-
posed method requires no labeled data, based only on
unsupervised estimations; (iii) the low computational
costs, since the method is based only on ranking in-
formation and dispense costly optimization steps of-
ten involved in training steps.
A wide and comprehensive experimental evalua-
tion was conducted to assess the effectiveness of gen-
erated embedding in retrieval tasks. The evaluation
was conducted on 7 diverse datasets considering dif-
ferent data modalities: images, text, social networks,
and a traditional pattern recognition dataset. Differ-
ent networks, both dense and sparse, were also con-
sidered. The experimental results are compared with
4 recently proposed node embedding approaches. In
various scenarios, the proposed method achieved best
results in most of datasets, demonstrating the ability
Retrieval
Classification
Clustering
Embedded
Representation
Analytic
tasks
Input
Collection
Similarity-Dissimilarity
Visualization
RaDE
SDNE
HOPE
Node2vec
NRL
Methods
Figure 1: General scenario of application of NRL ap-
proaches.
in generating high-effective representations.
The remaining of this paper is organized as fol-
lows. Section 2 presents the formal definitions used
along the paper. The proposed RaDE Node Embed-
ding method is presented in Section 3. Section 4
discusses the experimental evaluation conducted. Fi-
nally, Section 5 discusses the conclusions and possi-
ble future work.
2 FORMAL PROBLEM
DEFINITION
This section discusses a formal definition of the main
task addressed in Section 2.1 and the rank model used
in Section 2.2.
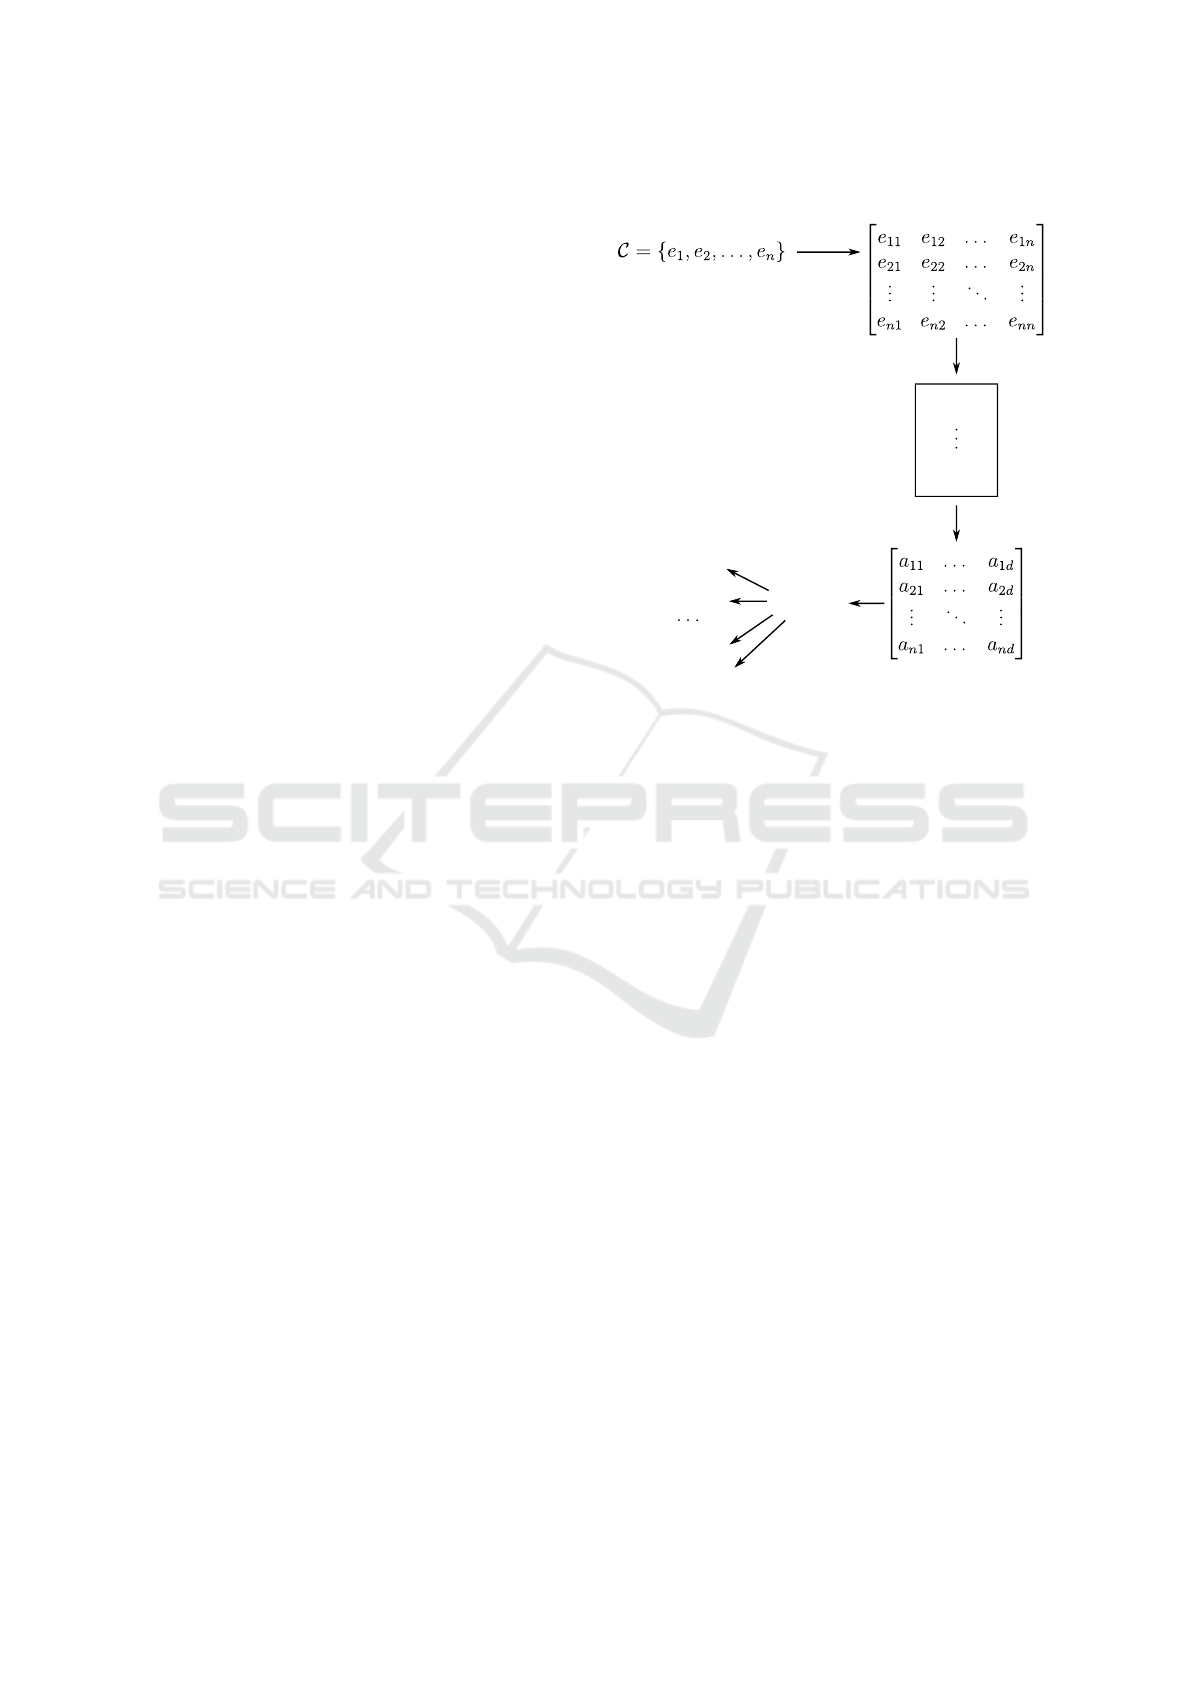
2.1 Graph Embedding
Let C ={e
1
, e
2
, . .. , e
n
} be a collection of data ele-
ments, where n = |C | denotes the size of C . Along
the paper, we relax the notation in such a way that an
element e ∈ C can be used either as the element itself
or its index, depending on context.
The collection C can be represented by a graph
G(V, E), where V is a set of vertices, such that V = C ,
and E ⊆ V
2
is a set of edges. If (e
i
, e
j
) ∈ E, we say
that vertices which represents elements e
i
and e
j
are
connected in the graph. Weights can be assigned to
RaDE: A Rank-based Graph Embedding Approach
143

edges, commonly represented by an adjacency matrix
S such that the value assigned to the edge (e
i
, e
j
) is
given by s
i, j
.
We define a graph embedding task (more specif-
ically, node embedding) similarly to (Goyal and Fer-
rara, 2017). Given a graph G(V, E), graph embedding
can be seen as a mapping function f : e
i
→ v
i
∈ R
d
∀i ∈ [n], such that the number of dimensions is much
smaller than the collection size, i.e., d |V |, and the
function f preserves some structural information of
the graph G. More specifically, it is expected that the
similarity information encoded in the graph G is pre-
served, such that similar nodes in the graph are pro-
jected close in the R
d
space.
2.2 Rank Model
As the proposed method is defined in terms of ranking
information, this section presents a formal definition
of the ranking model considered along the paper.
Let e
q
be a query element. A ranked list τ
q
can
be computed in response to e
q
, in which the top posi-
tions of τ
q
are expected to contain the elements most
similar to e
q
. The ranking tasks are often defined
through a pairwise dissimilarity measures, where the
dissimilarity between two elements e
q
and e
i
is de-
noted by ρ(q, i). As such, τ
q
is sorted by the distances
in ascending order, which means the full ranked list
might be expensive to compute, specially when n is
high. Therefore, the computed ranked lists can con-
sider only a sub-set of the top-L elements.
Let τ
q
be a ranked list that contains only the L
elements most similar to e
q
, where L n. For-
mally, let C
L
be a sub-set of C , such that |C
L
| = L
and ∀e ∈ C
L
, e
0
∈ C \ C
L
, ρ(e
q
, e) ≤ ρ(e
q
, e
0
). The
ranked list τ
q
can then be defined as a bijection from
the set C
L
onto the set [L] = {1, 2, . . . ,L}, such that
∀e
i
, e
j
∈ C , τ
q
(e
i
) < τ
q
(e
j
) ⇐⇒ ρ(e
q
, e
i
) < ρ(e
q
, e
j
).
Every element e
i
∈ C can be taken as a query
element e
q
. As a result, a set of ranked lists T =
{τ
1
, τ
2
, . . . , τ
n
} can be obtained, with a ranked list
for each element in the collection C . The set T con-
stitutes a rich source of similarity information about
the dataset. Such information is exploited to compute
the embedding.
3 RaDE NODE EMBEDDING
Rank-based approaches have been successfully used
in diverse retrieval and machine learning tasks re-
cently (Zhong et al., 2017; Pedronette et al., 2019),
mainly due to its capacity of encoding relevant sim-
ilarity information defined in relationships among
dataset elements. Such capacity is exploited in this
paper in order to embed the nodes from a similarity
graph into a vector space, while maintaining similar-
ity and neighborhood relationships. The used rank-
based model allows an efficient similarity representa-
tion, since the most relevant information are located at
top rank positions. In addition, the proposed method
is completely unsupervised and data-independent.
Given a graph with edge weights assigned by sim-
ilarity/dissimilarity measures, we derive an interme-
diary graph representation based only on ranking in-
formation. Next, our method exploits this graph to
learn a novel vector representation based on two con-
jectures: (i) high-effective representative nodes can be
identified by analysing the rank-based graph; (ii) each
node can be represented according to its similarity to
a set of representative nodes. In this way, the method
can be computed through three main steps:
• A. Rank-based Similarity Graph:
• B. High-Effective Representative Nodes:
• C. Node Embedding:
Such steps are illustrated in Figure 2. Each step is
detailed and formally defined in next sub-sections.
3.1 Rank-based Similarity Graph
Various retrieval and machine learning approaches
define a similarity matrix W that represents a graph
based on a dissimilarity measure ρ. A Gaussian ker-
nel is often considered, such that w
i j
= exp(
−ρ
2
(i, j)
2σ
2
),
where σ is a parameter to be defined.
Inspired by (Pedronette et al., 2019; Pedronette
and da S. Torres, 2017), we define a rank similarity
matrix W based only on rank information. The simi-
larity score w
i j
varies according to the position of e
j
in the ranked list τ
i
. Additionally, the score considers
only a neighborhood set, which is limited by the size
L of the ranked lists. Thus, the element w
i j
of W is
defined as:
w
i j
=
(
1 − log
L
τ
i
(e
j
), if τ
i
(e
j
) is defined
0 otherwise.
(1)
L can assume different values depending on the
desired analysis. In the proposed method, the matrix
W is defined assuming L n and, since it has dimen-
sion of n × n, W is very sparse.
3.2 High-effective Representative Nodes
The proposed approach relies on determining the
most representative nodes in a graph for generating an
VISAPP 2020 - 15th International Conference on Computer Vision Theory and Applications
144
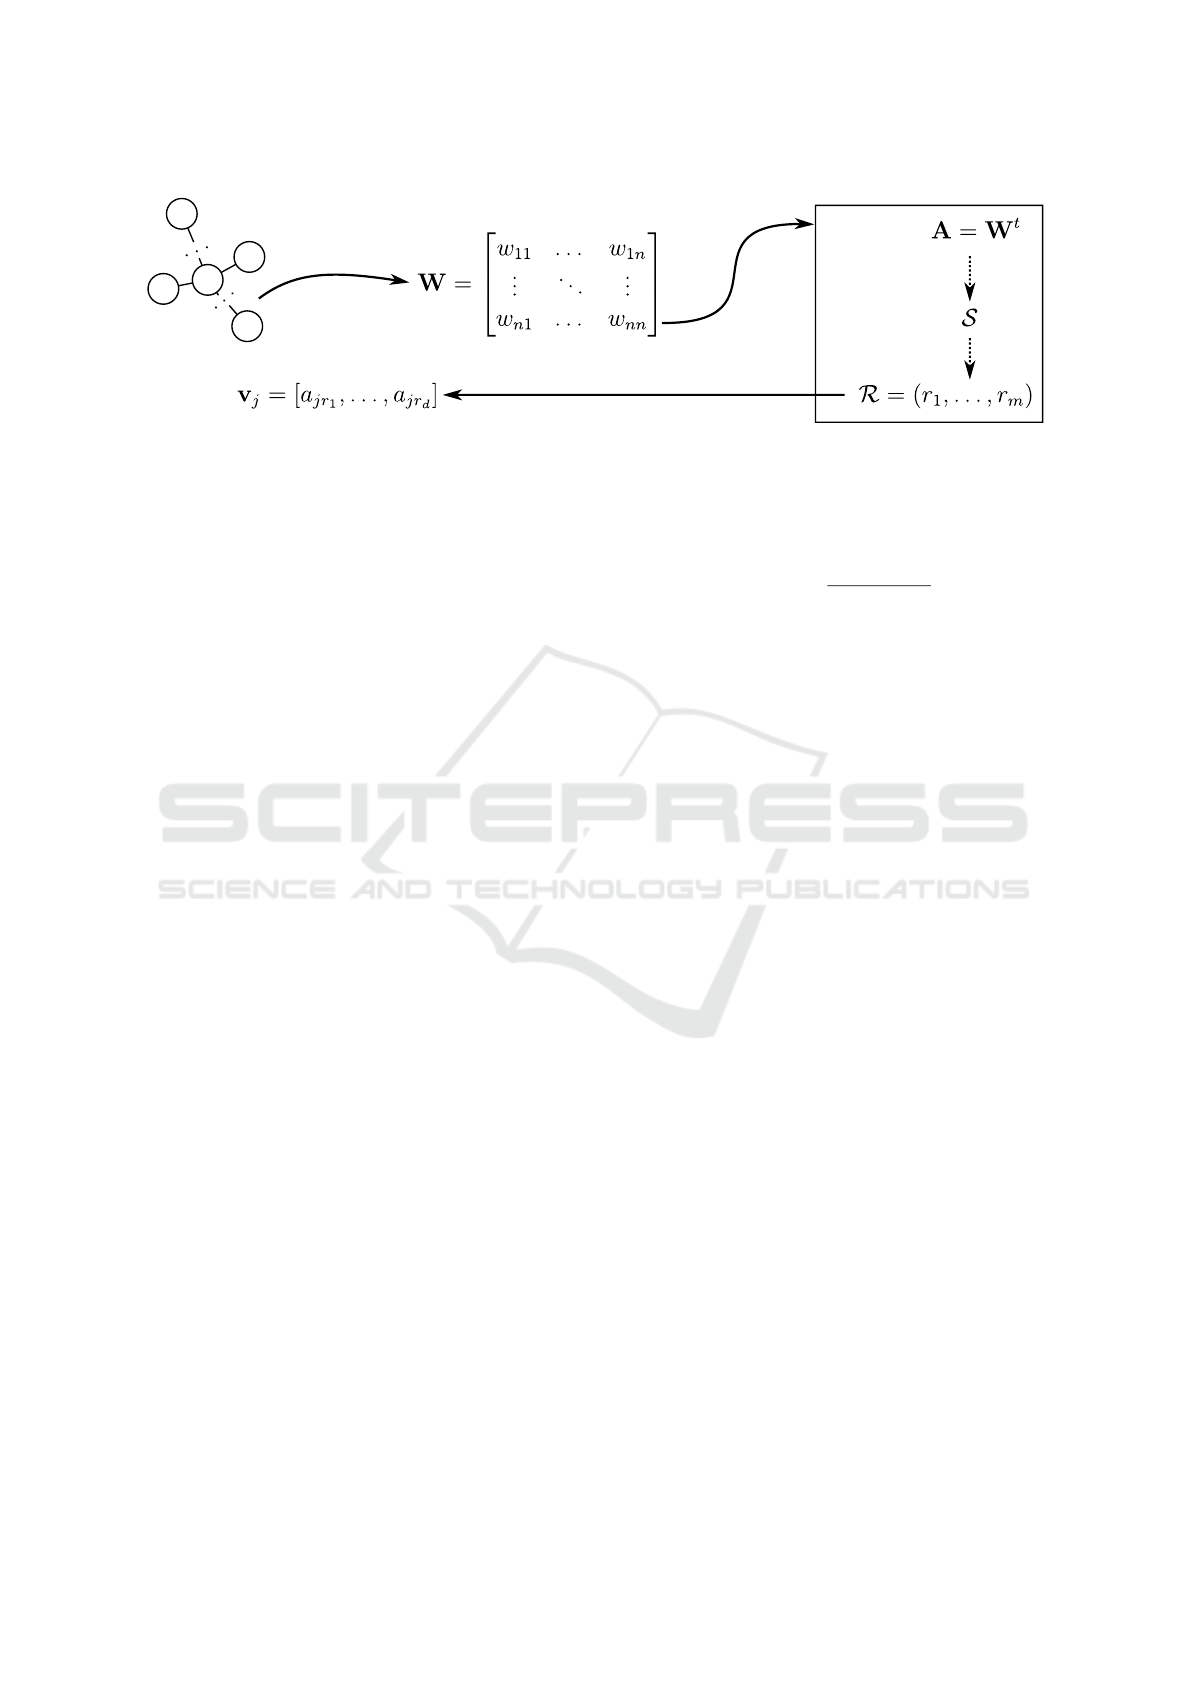
Selection
A. Rank-based
Similarity Matrix
Affinities
propagation
B. High-Effective
Representatives
Highest
reciprocal
affinities
C. Node
Embedding
Figure 2: Main steps of the RaDE algorithm.
embedding representation. Our guiding hypothesis is
that a good representative node has high affinity with
nearest nodes and low affinity with distant nodes.
First, we compute contextual affinities, which
take into account the structure of dataset manifold.
The key idea is based on diffusion process meth-
ods (Donoser and Bischof, 2013; Bai et al., 2019),
which propagate affinities encoded in W. The more
global similarity measures can be obtained by powers
of W, as shown in Equation 2:
A = W
t
, (2)
where t is a constant that defines the number of itera-
tions. A small value of t = 2 was used in all experi-
ments.
Note that A’s diagonal values represent reciprocal
affinities. For example, for t = 2, a
ii
=
∑
n
j=1
w
i j
w
ji
,
which means that d
ii
aggregates direct reciprocal
affinities between e
i
and all the other elements. For
t > 2, the diagonal still encodes reciprocal affinity, but
indirectly.
We use the diagonal to find a set of k high-
effective representative candidates, namely S . The
items in this set are supposed to satisfy the first re-
quirement of our guiding hypothesis, thus this set is
composed by the k elements with the highest recipro-
cal affinities. Elements with high reciprocal similar-
ities are expected to have high-effective ranked lists,
and therefore be good candidates.
Formally, the candidates set S must hold the fol-
lowing properties:
S ⊆ C (3)
|S| = k (4)
∀e ∈ S , e
0
∈ C \ S , a
ee
≥ a
e
0
e
0
(5)
Finally, a resulting ordered list of d representa-
tive nodes is obtained from the set of candidates S .
The objective is to select high-effective candidates
with the maximum of diversity among them. In this
way, both the diagonal affinity scores and the affini-
ties to already selected nodes are considered. Let
R = (r
1
, r
2
, . . . , r
d
) be an ordered list with the d most
effective representative nodes, each element r
i
is de-
fined as:
r
i
= argmax
e∈S\R
i−1
a
ee
1 +
∑
i−1
j=1
a
er
j
, (6)
where R
i−1
= {r
1
, . . . , r
i−1
} is the set of the elements
selected for previous indexes.
The main objective of Equation 6 is to complete
our guiding hypothesis, by favoring elements with
high reciprocal affinity, but, at the same time, penal-
izing them for being similar to the ones already se-
lected.
3.3 Node Embedding
Once the representative nodes have been chosen, the
embedding can be generated for any desired data ele-
ment. The embedding is computed based on the con-
jecture that nodes similar to each other are also similar
to the same set of representative nodes. Formally, the
embedded vector v
j
for an element e
j
∈ C is defined
as follows:
v
j
= [a
jr
1
, . . . , a
jr
d
], (7)
where a
jr
i
denotes the affinity between the the ele-
ment e
j
and the representative node r
i
.
4 EXPERIMENTAL EVALUATION
A broad experimental analysis was conducted to eval-
uate the proposed method. An overview about experi-
ments is discussed in Section 4.1. Section 4.2 presents
the datasets, while Section 4.3 describes the baselines.
Section 4.4 and 4.5 discusses the evaluation measures
and parameters settings, respectively. The results on
diverse information retrieval tasks are discussed in
Section 4.6. A visual analysis is presented in Sec-
tion 4.7.
RaDE: A Rank-based Graph Embedding Approach
145

4.1 Overview of Experiments
The vector representations generated with RaDE were
evaluated on information retrieval and visualization
tasks on 7 datasets of multiple domains (e.g. images,
texts and social networks) and each of these datasets
have different characteristics (e.g. dense or sparse
graphs, weighted or not weighted graphs, large or low
scale graphs).
The datasets of images and texts are not networks
by itself. In order to be able to apply Network Rep-
resentation Learning methods on these datasets, it
is necessary to generate a graph from the original
dataset. For this task, two main steps are necessary: i)
extracting the feature vectors of samples in dataset; ii)
calculating distances between the extracted features
for generating a graph weighted by these distances. In
this work the graphs generated for this kind of dataset
were complete
1
and the Euclidean distance was used
to calculate the weights.
Other category of datasets used to evaluate the
proposed approach was datasets that are networks by
itself. The selected network datasets are not origi-
nally weighted and for being able to apply RaDE, the
datasets must be weighted. For doing that we used
an approach based on shared neighborhood between
nodes.
The vector representations generated by RaDE
were compared with the vector representations gen-
erated by 4 other Network Representation Learning
methods which have characteristics different from
each other. The implementation provided by OpenNE
library
2
was used for executing the experiments and
they were executed on a machine with a Intel Xeon
E5-2660 @ 2.0Ghz processor, 64GB of RAM and
Arch Linux x86 64, kernel version 5.0.7 OS.
4.2 Datasets
We evaluated the effectiveness of RaDE on 7 datasets
of multiple domains. MPEG-7 (Latecki et al., 2000),
Oxford17Flowers (Nilsback and Zisserman, 2006)
and Corel5k (Liu et al., 2010) are image datasets
where each sample is described in function of its
extracted features. The features for Oxford17Flowers
(Nilsback and Zisserman, 2006) and Corel5k (Liu
et al., 2010) were extracted using the descriptors that
presented the highest MAP according to experimental
results presented on (Valem and Pedronette, 2019).
For MPEG-7 (Latecki et al., 2000), the features were
1
Note, however, that the proposed method does not re-
quire the graph to be complete.
2
https://github.com/thunlp/OpenNE
extracted using a contour descriptor (Pedronette
and da Silva Torres, 2010).
The weighted graphs, for MPEG-7 (Latecki et al.,
2000), Oxford17Flowers (Nilsback and Zisserman,
2006), Corel5k (Liu et al., 2010), 20NewsGroup
(Lang, 1995) and Iris (Dua and Graff, 2017), were
generated using the Euclidean distances between fea-
tures vector of each sample. For datasets that orig-
inally are networks, such as BlogCatalog (Zafarani
and Liu, 2009) and Wiki
3
, it was necessary an strat-
egy for assigning the weights, since they are not orig-
inally weighted. We assumed that the more neighbors
are shared between a pair of nodes, the more similar
they are to each other. The approach used for assign-
ing the weights is described in Equation 8,
w
i, j
=
1
1 + N (i, m) ∩ N ( j, m)
, (8)
where N (i, m) is the m nearest neighbors of a node
N
i
.
The details about each dataset evaluated on this
work are exposed bellow:
• MPEG-7 (Latecki et al., 2000): 1,400 images, di-
vided into 70 balanced classes, each one contain-
ing 20 samples. The features of the images were
extracted by CFD (Pedronette and da Silva Torres,
2010) which is a contour based descriptor.
• Oxford17Flowers (Nilsback and Zisserman,
2006): 1,360 images of 17 different species of
flowers, each one containing 80 different images.
Each image is described in function of 2,048
features, which were extracted using ResNet152
4
which is a residual neural network pre-trained
on ImageNet Dataset (Deng et al., 2009).
• Corel5k (Liu et al., 2010): 5,000 miscellaneous
images (e.g. fireworks, trees, boats, tiles, etc).
This dataset is divided into 50 categories, with
100 images each. Each image is described in
function of 1,000 features, which were extracted
using a DualPathNetwork92
5
.
• Iris (Dua and Graff, 2017): A dataset widely used
in pattern recognition task. It contains 150 sam-
ples of flowers, divided into 3 balanced classes.
Each sample is described in function of the petal
and sepal width and petal and sepal length.
• BlogCatalog3 (Zafarani and Liu, 2009): A social
network that contains 10,312 nodes and 333,983
edges. Each node represents a blogger and each
3
https://github.com/thunlp/OpenNE
4
https://github.com/Cadene/pretrained-models.pytorch
5
https://github.com/Cadene/pretrained-models.pytorch
VISAPP 2020 - 15th International Conference on Computer Vision Theory and Applications
146

edge represents the friendships between two blog-
gers. The nodes are separated into 39 groups and
each blogger may belong to more than one group.
• Wiki
6
: A reference network between Wikipedia
documents. It contains 2,405 documents divided
into 19 classes. This network is composed by
17,981 edges, it is not originally weighted and it
is directed.
• 20NewsGroup (Lang, 1995): Originally, it con-
tains 18,846 news texts, sorted by date and
separated into 20 categories. In this work,
we choose only 3 categories (comp.graphics,
rec.sport.baseball and talk.politics.gums) that
compose a subset with 1,729 texts, similarly to
what was done in (Wang et al., 2016). The fea-
tures of each document were extracted based on
its respective TF-IDF (Salton and Buckley, 1988)
vector.
4.3 Baseline Algorithms
The vector representations generated by RaDE were
compared with the following algorithms:
• Node2vec (Grover and Leskovec, 2016) aims to
learn low dimensional vector representation for
nodes in a network by generating random walks
starting from each of them. Node2vec is a gen-
eralization Deep Walk (Perozzi et al., 2014) that
introduces two parameters responsible for gener-
ating biased random walks, preserving properties
either of the local community or the global struc-
ture of the network.
• HOPE (Higher Order Proximity Embedding) (Ou
et al., 2016) is a scalable node embedding ap-
proach. HOPE aims to preserve asymmetric tran-
sitivity, which is a property existing on directed
graphs that depicts correlation between directed
edges and can help in capturing and recovering
the structure of a network from partially observed
graph.
• LINE (Large Scale Information Network Embed-
ding) (Tang et al., 2015) is a scalable approach
able to learn low dimensional vector representa-
tions of nodes from networks with millions of
nodes and billions of edges in a few hours. This
method defines an objective function that aims to
preserve two main properties of nodes: first order
proximity and second order proximity. First order
proximity is directly proportional to the connec-
tion power between a pair of nodes and second
6
https://github.com/thunlp/OpenNE
order proximity is direct proportional to the num-
ber of direct neighbors shared between a pair of
nodes.
• SDNE (Structural Deep Network Embedding)
(Wang et al., 2016) proposes a deep model capa-
ble of capturing highly non-linear network struc-
ture and extends the traditional autoencoder archi-
tecture to preserve both the first order and second
order proximity of networks.
4.4 Evaluation Measures
The results were reported considering two different
effectiveness measures commonly used for informa-
tion retrieval tasks: Precision and Mean Average Pre-
cision (MAP). Given a ranked list τ
q
as input, the
measures report a score in the interval [0, 1], where
higher values refer to better results. The results cor-
respond to the mean of these measures computed for
each of the ranked lists in the dataset.
4.4.1 Precision
The Precision measure corresponds to the number of
retrieved samples that belong to the class of the query
element in the top-k positions. This is formally de-
fined by Equation 9.
P(q, k) =
1
k
×
k
∑
i=1
f
c
(τ
−1
q
(i), q), (9)
where q is the index of the query element, k is the
size of the ranked list, τ
−1
q
(i) is the i-th element in the
ranked list and f
c
is a function that returns 1 if two
elements belong to the same class and 0 otherwise. In
this case, it is equivalent to the number of true posi-
tives against the sum of true positives and false posi-
tives. For readability purposes, to report the mean of
the Precision of all elements, we use P@k.
4.4.2 Mean Average Precision (MAP)
The Average Precision (A
p
) computes the sum of the
Precisions for different depths of a ranked list, which
is formally defined in Equation 10.
A
p
(q, k) =
1
f
s
(q)
×
k
∑
i=1
P(q, i) × f
c
(τ
−1
q
(i), q), (10)
where q is the index of the query element, k is the
depth of the ranked list, f
s
is a function that returns the
class size of an element, τ
−1
q
(i) is the i-th element in
the ranked list and f
c
is a function that returns 1 if two
elements belong to the same class and 0 otherwise.
RaDE: A Rank-based Graph Embedding Approach
147

The MAP (Mean Average Precision) is defined as
the mean of A
p
for all the Q queries. The formulation
is given by Equation 11.
MAP =
∑
Q
q=1
A
p
(q)
Q
(11)
4.5 Parameter Settings
For information retrieval task, the generated vector
representations were composed by 128 dimensions,
while for visualization task they were composed by
100 dimensions.
Table 1 shows the parameter settings for each
method. Most of methods was executed with the
default parameter configuration, provided by the
OpenNE library.
Table 1: Parameter settings for each evaluated method.
Method Parameters
Node2vec
Number of paths: 10
Path length: 80
Window size: 10
p: 0,25
q: 0,25
LINE
Negative ratio: 5
First and second order
SDNE
Autoencoder List: [1000, 128]
Learning rate: 0,01
First order loss: 10
−6
l1 loss : 10
−5
l2 loss: 10
−6
Batch size: 200
HOPE —
RaDE
t: 2
k: 200
L: 25
4.6 Information Retrieval Results
In this section we present the results of RaDE on in-
formation retrieval task. The results were divided
into two categories, according to the characteristics
of evaluated networks. These categories are: dense
networks and sparse networks.
4.6.1 Dense Networks
Dense networks are complete and directed. These net-
works were generated by extracting feature vectors
from samples of the original dataset and these vec-
tors were used to calculate the weights between each
node.
The column “Original” refers to the Precision and
MAP evaluation for the original weights, that is, be-
fore previous application of NRL methods. The num-
ber of dimensions of original vectors is equal to the
number of nodes on the network, while vectors gen-
erated with NRL methods have 128 dimensions.
Once Node2vec is very expensive, vector repre-
sentations with this method was generated only for
networks which have less than 1,500,000 edges, ex-
cept on 20NewsGroup dataset. Even being bigger
than the restriction imposed, we presented the quanti-
tative results for Node2vec on 20NewsGroup dataset
because this dataset was evaluated on visualization
task, and for the completeness sake, we had to calcu-
late vector representations for each method. However,
the embeddings of Node2vec presented on 20News-
Group are different than others because it has only
100 dimensions instead of 128 dimensions.
Table 2: 20NewsGroup evaluation.
Original RaDE HOPE LINE SDNE Node2vec
P@2 0.9690 0.9574 0.9253 0.6621 0.7292 0.6693
P@4 0.9337 0.9208 0.8824 0.4994 0.5791 0.4998
P@8 0.8841 0.8878 0.8523 0.4108 0.4932 0.4162
P@16 0.8318 0.8473 0.8256 0.3691 0.4551 0.3753
P@32 0.7713 0.7973 0.7937 0.3488 0.4352 0.3543
P@64 0.6965 0.7219 0.7479 0.3418 0.4242 0.3445
P@128 0.6076 0.6177 0.6765 0.3381 0.4166 0.3399
MAP 0.4924 0.4513 0.5132 0.3396 0.4051 0.3404
Table 3: Iris evaluation.
Original RaDE HOPE LINE SDNE Node2vec
P@2 0.9800 0.9933 0.9833 0.9366 0.99 0.9233
P@4 0.9633 0.9700 0.9650 0.8550 0.9616 0.8850
P@8 0.9500 0.9466 0.9533 0.8008 0.9233 0.8616
P@16 0.9337 0.9295 0.9362 0.7591 0.8791 0.8370
P@32 0.8947 0.8725 0.8937 0.7068 0.8410 0.8029
P@64 0.7002 0.6879 0.7043 0.5871 0.6720 0.6666
P@128 0.3904 0.3884 0.3906 0.3871 0.3875 0.3899
MAP 0.8858 0.8688 0.8905 0.6988 0.8400 0.8082
HOPE achieved the best MAP results on 20News-
Group and Iris as presented on Table 2 and Table
3, respectively. Meanwhile, RaDE achieved the sec-
ond best result for both precision and MAP on these
datasets besides achieving the best Precision results
on first positions, which is desirable for information
retrieval task.
Our approach was able to create vector representa-
tions 13.50 times smaller than the originals with only
8.34% of relative MAP loss on 20NewsGroup. Be-
sides that, RaDE improved the Precision of the orig-
inal vector representations for k ≥ 8 on this 20News-
Group.
For the three images datasets evaluated shown on
Table 4, Table 5 and Table 6, RaDE presented the
highest MAP compared with the baseline methods.
Our approach improved the relative MAP to the orig-
inal vector representations by 9.08% on the MPEG-7,
16.32% on Flowers and 1.68% on Corel5k. These
VISAPP 2020 - 15th International Conference on Computer Vision Theory and Applications
148

Table 4: MPEG-7 evaluation.
Original RaDE HOPE LINE SDNE
P@2 0.9921 0.9668 0.9871 0.8892 0.6146
P@4 0.9786 0.9239 0.9560 0.7889 0.4019
P@8 0.9320 0.8749 0.9023 0.6800 0.2716
P@16 0.8212 0.8192 0.8143 0.5735 0.1894
P@32 0.5125 0.5174 0.5144 0.3810 0.1369
P@64 0.2760 0.2717 0.2751 0.2226 0.0990
P@128 0.1448 0.1399 0.1442 0.1266 0.0720
MAP 0.8071 0.8804 0.8008 0.5565 0.1860
Table 5: Flowers evaluation.
Original RaDE HOPE LINE SDNE
P@2 0.9401 0.9276 0.9047 0.7772 0.6117
P@4 0.8906 0.8779 0.8292 0.6250 0.3641
P@8 0.8349 0.8385 0.7638 0.5245 0.2382
P@16 0.7707 0.8043 0.6926 0.4596 0.1652
P@32 0.6800 0.7484 0.6072 0.3976 0.1280
P@64 0.5488 0.6347 0.4856 0.3314 0.1060
P@128 0.3713 0.4057 0.3373 0.2555 0.0963
MAP 0.5183 0.6029 0.4466 0.2930 0.1115
Table 6: Corel5k evaluation.
Original RaDE HOPE LINE SDNE
P@2 0.9621 0.9430 0.7867 0.6144 0.5160
P@4 0.9290 0.9070 0.6622 0.4140 0.2742
P@8 0.8988 0.8795 0.5894 0.3026 0.1518
P@16 0.8595 0.8541 0.5377 0.2358 0.0894
P@32 0.8070 0.8176 0.4931 0.1930 0.0581
P@64 0.7206 0.7503 0.4372 0.1584 0.0422
P@128 0.5232 0.5402 0.3211 0.1253 0.0339
MAP 0.6517 0.6627 0.3100 0.1043 0.0375
improvements were achieved with vector representa-
tions 10.94, 10.63 and 39.06 times smaller respec-
tively.
For both, Flowers and Corel5k, RaDE outper-
formed the baselines on Precision evaluation for high-
est k. On these datasets, for lower k, the Original vec-
tor representation presented the best precision results.
However, as shown on Table 5 and on Table 6, when
k ≥ 8 and k ≥ 32, RaDE overcame the Original vector
representation for Flowers and Corel5k respectively.
Although RaDE did not have shown the best preci-
sion results for MPEG-7, our approach presented very
close results to Original vector representation, which
presented the best performance for this dataset.
4.6.2 Sparse Networks
These datasets are characterized by being networks
by itself and are sparse, undirected and unweighted.
Since RaDE is only applicable for weighted graphs,
we used an approach for assigning the weights be-
Table 7: BlogCatalog evaluation.
RaDE HOPE LINE SDNE Node2vec
P@2 0.5724 0.5950 0.6287 0.5565 0.6692
P@4 0.3553 0.3844 0.4358 0.3337 0.4831
P@8 0.2415 0.2741 0.3315 0.2200 0.3755
P@16 0.1807 0.2140 0.2731 0.1620 0.3065
P@32 0.1472 0.1801 0.2371 0.1309 0.2607
P@64 0.1272 0.1598 0.2109 0.1139 0.2278
P@128 0.1156 0.1461 0.1887 0.1043 0.2006
MAP 0.0918 0.1033 0.1227 0.0928 0.1300
Table 8: Wiki evaluation.
RaDE HOPE LINE SDNE Node2vec
P@2 0.7748 0.7848 0.8299 0.8008 0.8168
P@4 0.6419 0.6511 0.7059 0.6740 0.6936
P@8 0.5525 0.5634 0.6061 0.5696 0.6001
P@16 0.4882 0.4836 0.5108 0.4666 0.5175
P@32 0.4294 0.4027 0.4198 0.3649 0.4484
P@64 0.3677 0.3103 0.3317 0.2720 0.3756
P@128 0.2838 0.2233 0.2489 0.2021 0.2933
MAP 0.2438 0.1971 0.2317 0.1833 0.2554
tween nodes based on the shared neighborhood, as
described in Equation 8.
For the evaluated sparse networks, the best results
were achieved by Node2vec. Table 7 shows a relative
loss by 29.4% between Node2vec and RaDE on Blog-
Catalog and Table 8 shows a relative loss by 4.55%
on Wiki for these methods. Despite RaDE did not
performed well on BlogCatalog, our approach outper-
formed the results of MAP and Precision for k ≥ 16
on Wiki, of the baselines except Node2Vec.
A possible reason for RaDE did not have per-
formed well on BlogCatalog may be due to the
weighting strategy used. We plan in the future to eval-
uate other sparse networks already weighted as well
as to investigate different weighting strategies for the
unweighted ones.
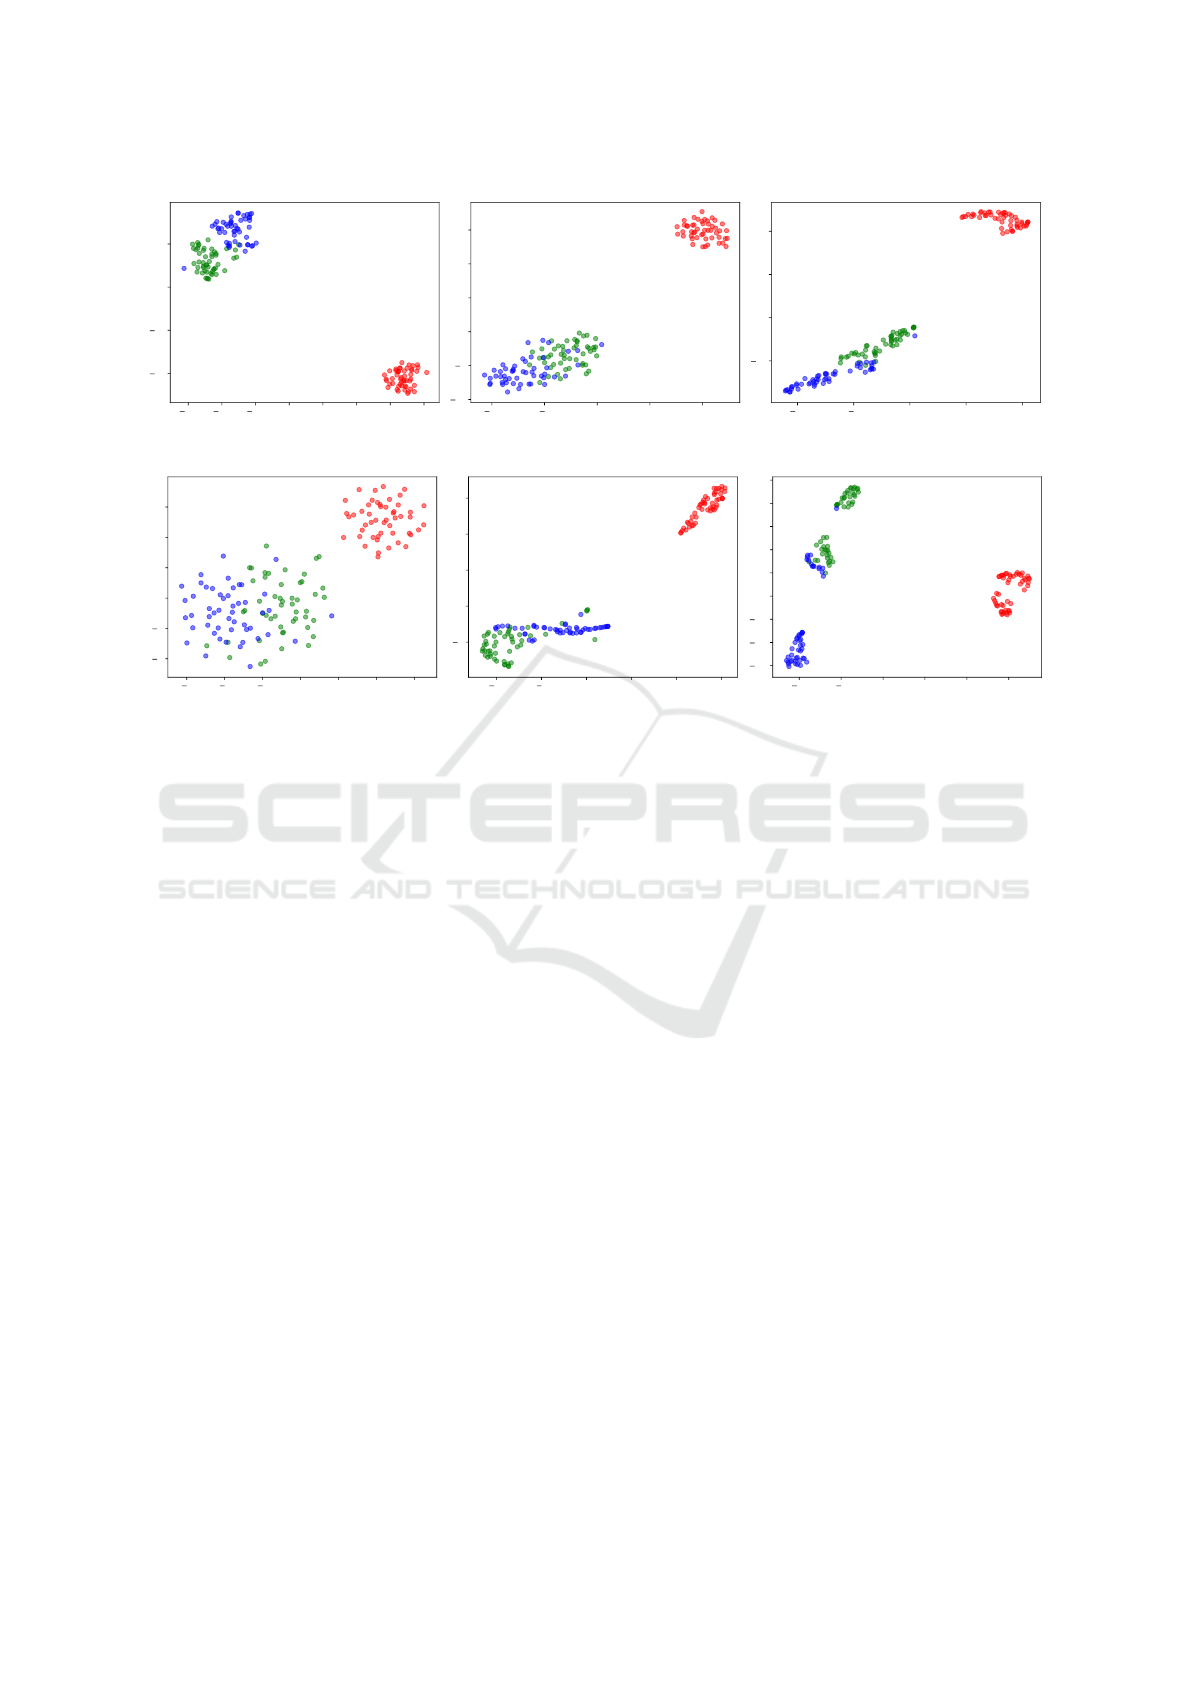
4.7 Visualization Tasks
Vector representations generated with RaDE were
also evaluated on visualization tasks. On this exper-
iment, we evaluated the effectiveness of vector rep-
resentations generated by the baselines presented on
Subsection 4.3 on two datasets: Iris and 20News-
Group. We used these datasets due to the fact that
they are composed by only 3 classes, therefore they
are good candidates for visualization tasks.
We generated new vector representations for
20NewsGroup and Iris with each NRL algorithm de-
scribed on Subsection 4.3. The vector representations
were generated with 100 dimensions, except to the
original vector representations, which have 150 and
RaDE: A Rank-based Graph Embedding Approach
149
7.5 5.0 2.5 0.0 2.5 5.0 7.5 10.0
20
10
0
10
(a) Original
10 5 0 5 10
10
5
0
5
10
15
(b) Node2vec
10 5 0 5 10
10
0
10
20
(c) HOPE
6 4 2 0 2 4 6
4
2
0
2
4
6
(d) LINE
10 5 0 5 10 15
5
0
5
10
15
(e) SDNE
10 5 0 5 10 15
7.5
5.0
2.5
0.0
2.5
5.0
7.5
10.0
12.5
(f) RaDE
Figure 3: Visual Evaluation on Iris.
1,729 dimensions for Iris and 20NewsGroup, respec-
tively. Then, we used these embeddings as input for
t-SNE (van der Maaten and Hinton, 2008) in order to
generate the visualization. It is common to perform
a dimensionality reduction of the data using methods
like (Jolliffe and Springer-Verlag, 2002) before gener-
ating the visualization with t-SNE. The step of gener-
ating the 100-dimensional embeddings with the NRL
algorithms is analogous to this pre-processing step of
t-SNE.
As shown on Figure 3, t-SNE separated well the
red class, which is linearly separable from the others.
The Original vector representation and vector repre-
sentations generated by HOPE and RaDE presented
the best visual results on Iris, being consistent with
the quantitative results presented on Table 3.
Another interesting result that can be observed on
Figure 3 is the fact that RaDE created well defined
clusters for samples that are known to belong to dif-
ferent classes. Note that blue samples are grouped on
the bottom and green samples are grouped on the top
of Figure 3 (f). Between these clusters, RaDE cre-
ated another cluster that contains samples which do
not have the same degree of assurance of belonging
to a class as the others well clustered. There are plans
to investigate the reason for this behaviour in future
works.
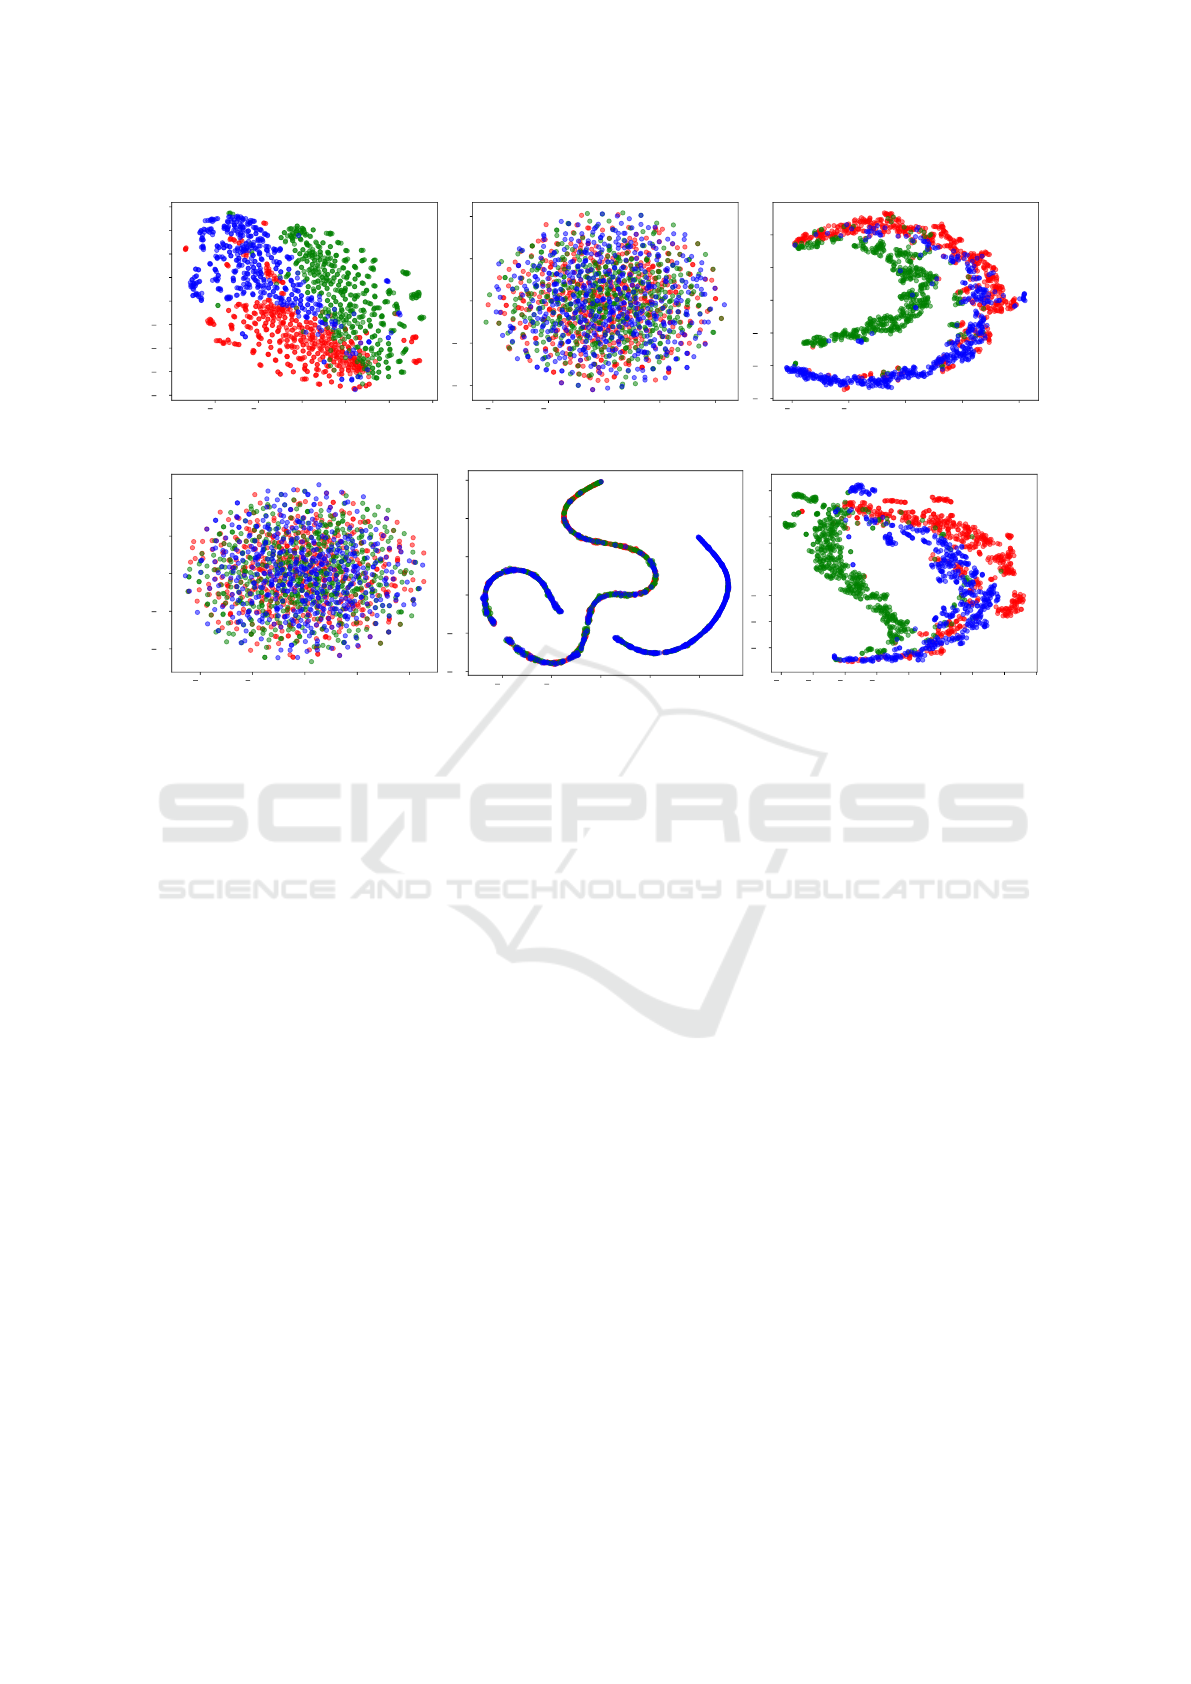
As well as results observed for the Iris dataset on
Figure 3, the best visual results from 20NewsGroup,
were given by the Original, HOPE and RaDE vec-
tor representations, as shown on Figure 4. Even re-
ducing the amount of information needed to repre-
sent the original data, vectors generated by HOPE and
RaDE resulted on more interesting visual represen-
tations than Node2vec, LINE and SDNE. Visual re-
sults presented on Figure 4 shown that red samples
was separated better with RaDE than HOPE.
5 CONCLUSION
In this work, we introduced RaDE, an unsupervised
method for generating low-dimensional vector rep-
resentations based on similarity between common
nodes and high-effective representative nodes in a net-
work. RaDE has achieved the best results in most
of the evaluated datasets, specially on the evaluated
image datasets, which are dense networks. Our ap-
proach was capable of creating high-effective low-
dimensional vector representations that can be useful
in many tasks such as information retrieval and visu-
alization. In the most cases, RaDE was not only ca-
pable of providing very dense and smaller representa-
tions, but has also improved the general effectiveness
by a significant margin. For the Corel5k dataset, for
example, the provided output is 39.06 times smaller
than the original vector and +1.68% more effective
when considering the relative gain of the MAP. Gains
VISAPP 2020 - 15th International Conference on Computer Vision Theory and Applications
150
40 20 0 20 40 60
80
60
40
20
0
20
40
60
80
(a) Original
20 10 0 10 20
20
10
0
10
20
(b) Node2vec
40 20 0 20 40
60
40
20
0
20
40
(c) HOPE
20 10 0 10 20
20
10
0
10
20
(d) LINE
40 20 0 20 40
40
20
0
20
40
60
(e) SDNE
40 30 20 10 0 10 20 30 40
60
40
20
0
20
40
60
(f) RaDE
Figure 4: Visual Evaluation on 20NewsGroup.
were also achieved for other datasets, including Flow-
ers, where the MAP improvement of features is up to
+16.32% even with a reduction of 10.63 times of the
original size. Therefore, RaDE demonstrated to be an
interesting approach to reduce the dimensionality of
dense networks preserving its original meaning.
For future works, we plan to investigate what
makes RaDE provide more effective clusters when
compared to baselines, as observed in the visualiza-
tion result on Iris dataset. We also intend to perform a
strict parameter analysis for both RaDE and baselines.
Besides that, we plan to optimise the implementation
of RaDE, in order to perform efficiency analyzes.
ACKNOWLEDGEMENTS
The authors are grateful to the S
˜
ao Paulo Re-
search Foundation - FAPESP (#2017/25908-6,
#2018/15597-6), the Brazilian National Council for
Scientific and Technological Development - CNPq
(#308194/2017-9), and Petrobras (#2014/00545-0,
#2017/00285-6).
REFERENCES
Bai, S., Bai, X., Tian, Q., and Latecki, L. J. (2019). Reg-
ularized diffusion process on bidirectional context for
object retrieval. IEEE Trans. Pattern Anal. Mach. In-
tell., 41(5):1213–1226.
Cai, H., Zheng, V. W., and Chang, K. C. (2018). A compre-
hensive survey of graph embedding: Problems, tech-
niques, and applications. IEEE Trans. Knowl. Data
Eng., 30(9):1616–1637.
Cui, P., Wang, X., Pei, J., and Zhu, W. (2019). A survey on
network embedding. IEEE Transactions on Knowl-
edge and Data Engineering, 31(5):833–852.
Deng, J., Dong, W., Socher, R., Li, L.-J., Li, K., and Fei-
Fei, L. (2009). Imagenet: A large-scale hierarchical
image database. In 2009 IEEE conference on com-
puter vision and pattern recognition, pages 248–255.
Ieee.
Donoser, M. and Bischof, H. (2013). Diffusion processes
for retrieval revisited. In IEEE Conference on Com-
puter Vision and Pattern Recognition, CVPR, pages
1320–1327.
Dua, D. and Graff, C. (2017). UCI machine learning repos-
itory.
Goyal, P. and Ferrara, E. (2017). Graph embedding tech-
niques, applications, and performance: A survey.
CoRR, abs/1705.02801.
Grover, A. and Leskovec, J. (2016). Node2vec: Scal-
able feature learning for networks. In Proceedings
of the 22Nd ACM SIGKDD International Conference
on Knowledge Discovery and Data Mining, KDD ’16,
pages 855–864, New York, NY, USA. ACM.
Huang, X., Cui, P., Dong, Y., Li, J., Liu, H., Pei, J., Song,
L., Tang, J., Wang, F., Yang, H., and Zhu, W. (2019).
Learning from networks: Algorithms, theory, and ap-
plications. In Proceedings of the 25th ACM SIGKDD
RaDE: A Rank-based Graph Embedding Approach
151

International Conference on Knowledge Discovery &
Data Mining, KDD ’19, pages 3221–3222.
Jolliffe, I. and Springer-Verlag (2002). Principal Compo-
nent Analysis. Springer Series in Statistics. Springer.
Lang, K. (1995). Newsweeder: Learning to filter netnews.
In Proceedings of the Twelfth International Confer-
ence on Machine Learning, pages 331–339.
Latecki, L. J., Lak
¨
amper, R., and Eckhardt, U. (2000).
Shape descriptors for non-rigid shapes with a single
closed contour. In Proc. IEEE Conf. Computer Vision
and Pattern Recognition, pages 424–429.
Liu, G.-H., Zhang, L., Hou, Y.-K., Li, Z.-Y., and Yang, J.-
Y. (2010). Image retrieval based on multi-texton his-
togram. Pattern Recogn., 43(7):2380–2389.
Nilsback, M.-E. and Zisserman, A. (2006). A visual vo-
cabulary for flower classification. In Proceedings
of the 2006 IEEE Computer Society Conference on
Computer Vision and Pattern Recognition - Volume 2,
CVPR ’06, pages 1447–1454, Washington, DC, USA.
IEEE Computer Society.
Ou, M., Cui, P., Pei, J., Zhang, Z., and Zhu, W. (2016).
Asymmetric transitivity preserving graph embedding.
In Proceedings of the 22Nd ACM SIGKDD Interna-
tional Conference on Knowledge Discovery and Data
Mining, KDD ’16, pages 1105–1114, New York, NY,
USA. ACM.
Pedronette, D. C. G. and da S. Torres, R. (2017). Unsuper-
vised rank diffusion for content-based image retrieval.
Neurocomputing, 260:478 – 489.
Pedronette, D. C. G. and da Silva Torres, R. (2010). Shape
retrieval using contour features and distance optimiza-
tion. In VISAPP (2), pages 197–202.
Pedronette, D. C. G., Valem, L. P., Almeida, J., and da S.
Torres, R. (2019). Multimedia retrieval through unsu-
pervised hypergraph-based manifold ranking. IEEE
Transactions on Image Processing, 28(12):5824–
5838.
Perozzi, B., Al-Rfou, R., and Skiena, S. (2014). Deep-
walk: Online learning of social representations. In
Proceedings of the 20th ACM SIGKDD International
Conference on Knowledge Discovery and Data Min-
ing, KDD ’14, pages 701–710, New York, NY, USA.
ACM.
Salton, G. and Buckley, C. (1988). Term-weighting ap-
proaches in automatic text retrieval. Inf. Process.
Manage., 24(5):513–523.
Tang, J., Qu, M., Wang, M., Zhang, M., Yan, J., and
Mei, Q. (2015). Line: Large-scale information net-
work embedding. In Proceedings of the 24th Inter-
national Conference on World Wide Web, WWW ’15,
pages 1067–1077, Republic and Canton of Geneva,
Switzerland. International World Wide Web Confer-
ences Steering Committee.
Valem, L. P. and Pedronette, D. C. G. a. (2019). An unsuper-
vised genetic algorithm framework for rank selection
and fusion on image retrieval. In Proceedings of the
2019 on International Conference on Multimedia Re-
trieval, ICMR ’19, pages 58–62, New York, NY, USA.
ACM.
van der Maaten, L. and Hinton, G. (2008). Visualizing data
using t-SNE. Journal of Machine Learning Research,
9:2579–2605.
Wang, D., Cui, P., and Zhu, W. (2016). Structural deep
network embedding. In Proceedings of the 22Nd
ACM SIGKDD International Conference on Knowl-
edge Discovery and Data Mining, KDD ’16, pages
1225–1234, New York, NY, USA. ACM.
Zafarani, R. and Liu, H. (2009). Social computing data
repository at ASU.
Zhong, Z., Zheng, L., Cao, D., and Li, S. (2017). Re-
ranking person re-identification with k-reciprocal en-
coding. In IEEE Conference on Computer Vision and
Pattern Recognition, CVPR, pages 3652–3661.
VISAPP 2020 - 15th International Conference on Computer Vision Theory and Applications
152
