
Receptivity of an AI Cognitive Assistant by the Radiology Community:
A Report on Data Collected at RSNA
Karina Kanjaria
1 a
, Anup Pillai
1 b
, Chaitanya Shivade
2 c
, Marina Bendersky
3
,
Vandana Mukherjee
1 d
and Tanveer Syeda-Mahmood
1
1
Almaden Research Center, IBM, Harry Rd, San Jose, U.S.A.
2
Amazon Web Services, Amazon, University Ave, Palo Alto, U.S.A.
3
Data Science, Nevro, Bridge Pkwy, Redwood City, U.S.A.
Keywords:
Radiology Survey, Decision Support, Question Answering, Deep Learning, Machine Learning, Artificial
Intelligence, Cognitive Computing.
Abstract:
Due to advances in machine learning and artificial intelligence (AI), a new role is emerging for machines as
intelligent assistants to radiologists in their clinical workflows. But what systematic clinical thought processes
are these machines using? Are they similar enough to those of radiologists to be trusted as assistants? A
live demonstration of such a technology was conducted at the 2016 Scientific Assembly and Annual Meeting
of the Radiological Society of North America (RSNA). The demonstration was presented in the form of a
question-answering system that took a radiology multiple choice question and a medical image as inputs. The
AI system then demonstrated a cognitive workflow, involving text analysis, image analysis, and reasoning, to
process the question and generate the most probable answer. A post demonstration survey was made available
to the participants who experienced the demo and tested the question answering system. Of the reported
54,037 meeting registrants, 2,927 visited the demonstration booth, 1,991 experienced the demo, and 1,025
completed a post-demonstration survey. In this paper, the methodology of the survey is shown and a summary
of its results are presented. The results of the survey show a very high level of receptiveness to cognitive
computing technology and artificial intelligence among radiologists.
1 INTRODUCTION
Radiologists and other clinicians who interpret or oth-
erwise employ medical imaging in their practices are
increasingly overwhelmed by the explosion of im-
ages and associated data. While picture archiving and
communication systems and other electronic health
record systems may help organize, store, and present
such data (Zeleznik et al., 1983), the burden of data
overload contributes to physician burnout and medi-
cal errors (Singh et al., 2013). Computing technol-
ogy, including the use of artificial intelligence and
deep learning, could provide a solution by providing
caregivers with cognitive assistance. Examples of po-
tential roles for this technology include: triaging im-
ages to exclude those that are certainly normal from
a
https://orcid.org/0000-0002-6964-6286
b
https://orcid.org/0000-0002-7130-2909
c
https://orcid.org/0000-0001-6604-1129
d
https://orcid.org/0000-0002-8189-328X
clinician review, finding abnormalities to draw atten-
tion to images or exams that are certainly or likely ab-
normal, intelligently selecting prior exams or images
for comparison, methodically registering comparison
images, systematically tracking index lesions, com-
piling and presenting clinical information based on
the indications of a particular exam, presenting differ-
ential diagnoses with associated probabilities based
on clinical and imaging findings, segmenting normal
and abnormal anatomy on medical images, protecting
reading physicians against known cognitive biases,
and helping generate the clinical report. When con-
sidering any of these roles for artificial intelligence,
some in the medical imaging community have raised
concerns regarding the future role of physicians and
the threat of their replacement by cognitive comput-
ing. Past studies have shown that although decision
support systems improve the workflow of a clinician,
healthcare decision makers took longer to acknowl-
edge their value and the resulting benefits (Pynoo
et al., 2012). To better understand these concerns, a
178
Kanjaria, K., Pillai, A., Shivade, C., Bendersky, M., Mukherjee, V. and Syeda-Mahmood, T.
Receptivity of an AI Cognitive Assistant by the Radiology Community: A Report on Data Collected at RSNA.
DOI: 10.5220/0008984901780186
In Proceedings of the 13th International Joint Conference on Biomedical Engineering Systems and Technologies (BIOSTEC 2020) - Volume 5: HEALTHINF, pages 178-186
ISBN: 978-989-758-398-8; ISSN: 2184-4305
Copyright
c
2022 by SCITEPRESS – Science and Technology Publications, Lda. All rights reserved
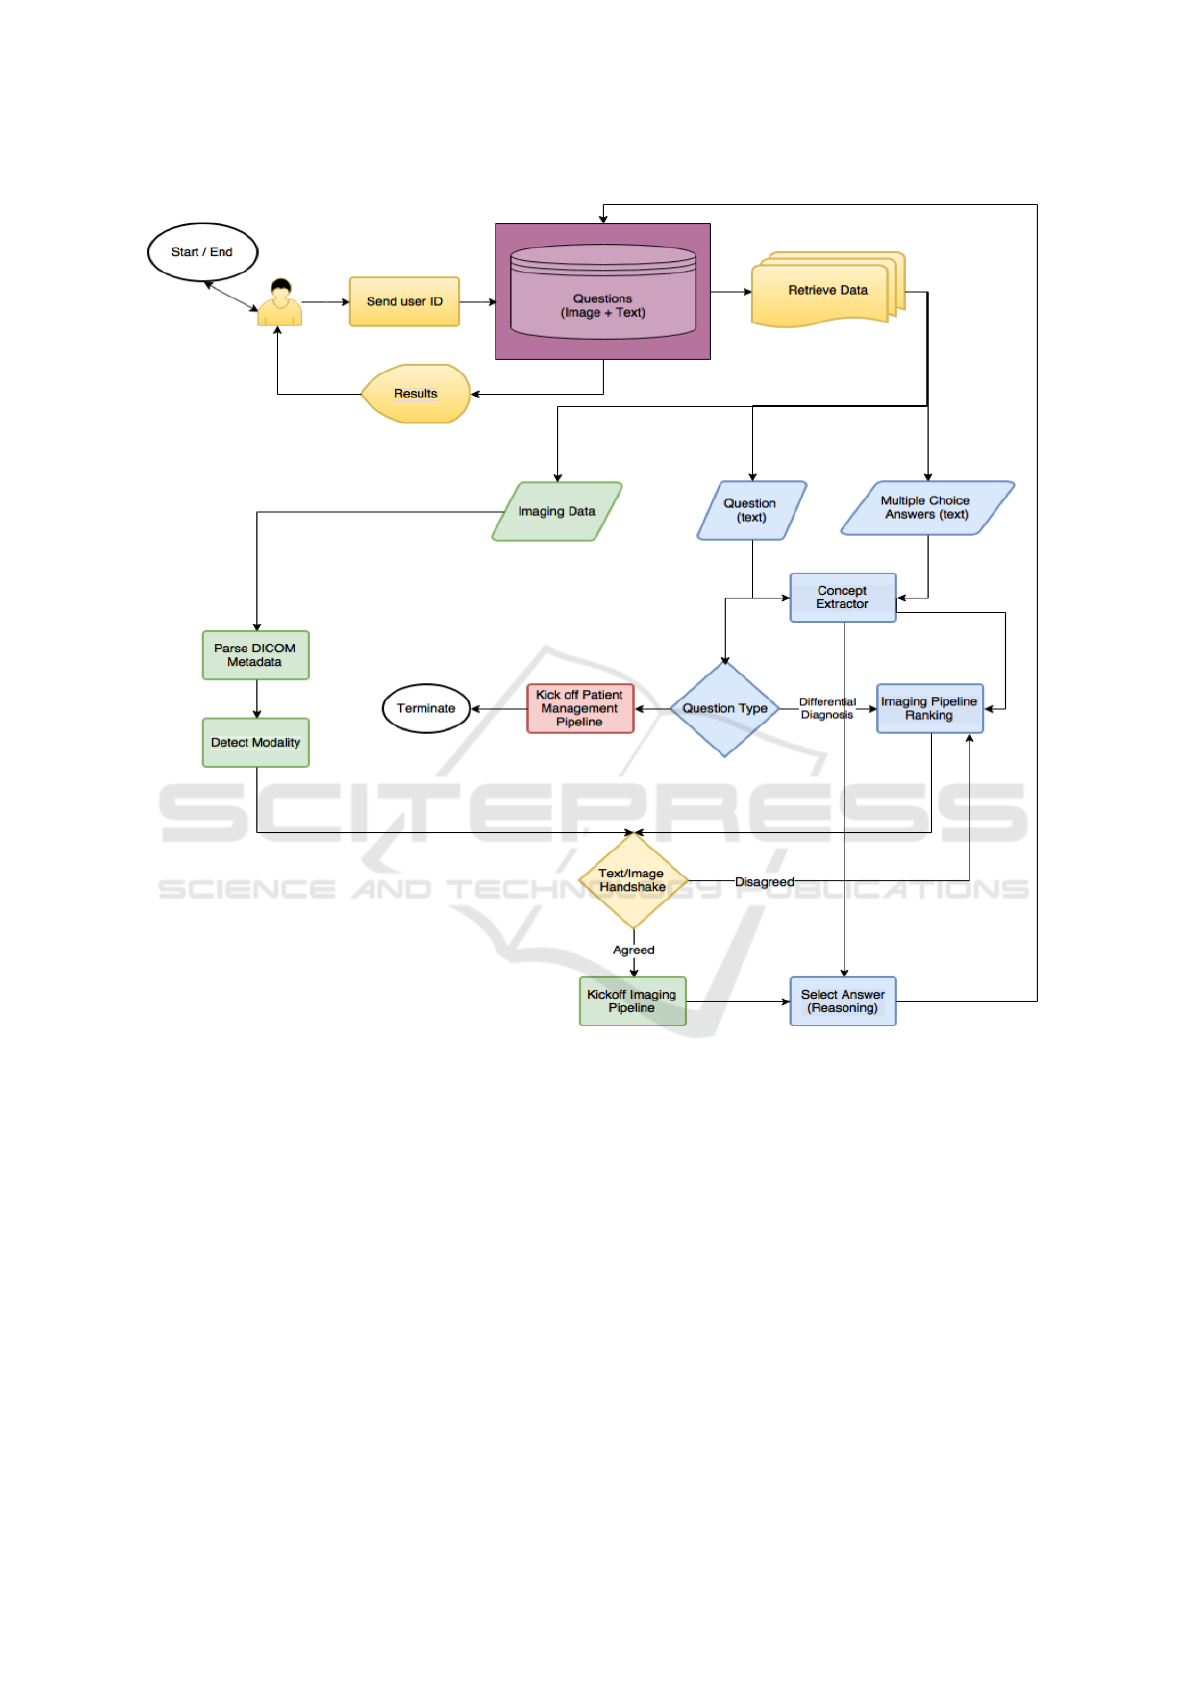
Figure 1: Architecture diagram for the Eyes of Watson system.
demonstration using an artificial intelligence technol-
ogy was conducted at RSNA 2016. The participants
were subsequently surveyed to understand receptivity
to the project and the demonstrated system, what fea-
tures of the technology were important to them, and
to gather meaningful opinions, comments, and feed-
back.
2 SYSTEM ARCHITECTURE
The AI system was designed, specifically, as a Ques-
tion Answering (QA) system that attempted to answer
radiology questions formulated in natural language.
We focused on two main question types: i) differ-
ential diagnosis and ii) patient management. An an-
swer could be i) an anomaly for differential diagno-
sis questions or ii) a procedure for management type
questions. In addition, for every answer suggested by
the system, a justification explaining how the system
utilized the available textual and imaging evidence to
arrive at an answer was also presented using Sankey
charts (Google, 2016). The system leveraged multi-
ple disease detection algorithms processed on clini-
cal images and knowledge extracted from the textual
information presented, to arrive at answers weighted
by probabilities based on both the imaging and tex-
tual evidence. The system highlighted the search and
extraction of evidence from our medical knowledge
database, built by mining resources such as medi-
cal ontologies, textual corpora and clinical websites.
Receptivity of an AI Cognitive Assistant by the Radiology Community: A Report on Data Collected at RSNA
179

Some such mined resources were Unified Medical
Language System (UMLS), SNOMED CT, Radlex,
Dynamed, and Diagnosis Pro.
A detailed overview of our QA system is shown in
Figure 1. When a user logged in to the system, they
were presented with multiple studies to choose from.
Upon selection, they were shown a question with a
brief patient history, multiple answer choices, and an
imaging study related to the question. After they
made their answer selection, they could have chosen
to ask the system to analyze the study. This began
the analysis process in which the text and imaging
data were, first, extracted separately and sent to the
appropriated processing stages. Following this, the
textual and imaging information underwent a sanity-
check stage, which served as a verification process to
corroborate that the information gathered was in sync.
Finally, this information was forwarded to the reason-
ing stage which performed answer ranking based on
evidence, and presented the answers weighted by their
probabilities.
The main segments of our system are elaborated
below and further details may be found in (Pillai et al.,
2019).
2.1 Question Classification
In order for a QA system to answer a question with
speed and efficiency, the system must first be able to
deduce the type of question it is presented with. This
question type classification becomes even more diffi-
cult than traditional text classification problems when
the question text contains only a few short sentences.
To address these complications with question clas-
sification, we employed the use of a Na
¨
ıve Bayes text
classifier. The classifier applied Bayes theorem with
independent feature selection and could be applied
more easily to larger sets of data. It was simpler than
other models, which aided in real-time classification
tasks (Rish et al., 2001). Our classifier made the as-
sumption that the presence of a feature in a class is un-
related to the presence of another feature in the class.
The classifier also assumed that numerous features
selected together created a higher probability of the
question being classified in the correct category- ”dif-
ferential diagnosis” versus ”patient management”.
Differential diagnosis questions are those which
require an analysis on a list of symptoms and infor-
mation to come to a conclusive finding based on the
evidence. For example, the following question would
be classified as a differential diagnosis question: “A
61-year-old female presents to the ER with a heart
murmur and acute chest pain. Past medical history is
positive for acute myocardial infarction. Patient also
has an extensive history of tobacco use. Given the
following chest X-ray, which is most likely?”.
Patient management problems also require an
analysis of the facts presented, however, they focus
on the next steps of treatment. The following would
be classified as a patient management problem: “A
52-year-old male with hypertension is admitted to the
Emergency Department with acute chest pain, tachyp-
nea, back pain. Unenhanced CTA was performed and
it shows intimal calcification toward the lumen. A
contrast CTA was performed next and is shown here.
What is the next step of management?”.
The Na
¨
ıve Bayes classifier we chose suited best
for the real-time reasoning application we aimed for,
because of its ability to speedily predict question
types in real-time during the demonstration. It did
this by counting the number of times a word appears
amongst all of the words in a question with a specific
label, and then assigning a label to the question af-
ter looking at its array of words and its class. After
question text classification into differential diagnosis
or patient management, the system then proceeded to
text and image processing.
2.2 Text and Image Processing
The text and image processing stage is further delin-
eated into four major steps as follows.
i) Concept and feature identification. In this step,
we identified the most relevant concepts and features
in the presented data. These included, but were not
limited to, things such as demographic information,
signs and symptoms, medications, image type, treat-
ments, and question type, along with negated con-
cepts. The concepts were extracted by running a con-
cept extractor on the question text, and only the most
relevant information was retained by the reasoning
module.
ii) Feature expansion. In this step, we expanded
the identified concepts and features with their syn-
onyms, related words, and ontological concepts. We
did this in order to address the mismatch that derived
from extracted concepts in questions differing from
those in our knowledge base. For example, a question
text could contain the words ”heart attack” while our
knowledge base refers to this as ”myocardial infarc-
tion”. Since these two concepts are related, we needed
to perform feature expansion to ensure that they were
mapped together.
iii) Knowledge retrieval. In this step, we fetched
all the relevant clinical knowledge for every possible
disease based on the expanded features. Our knowl-
edge base consists of scientific facts that capture dis-
ease and diagnosis information in the forms of con-
HEALTHINF 2020 - 13th International Conference on Health Informatics
180
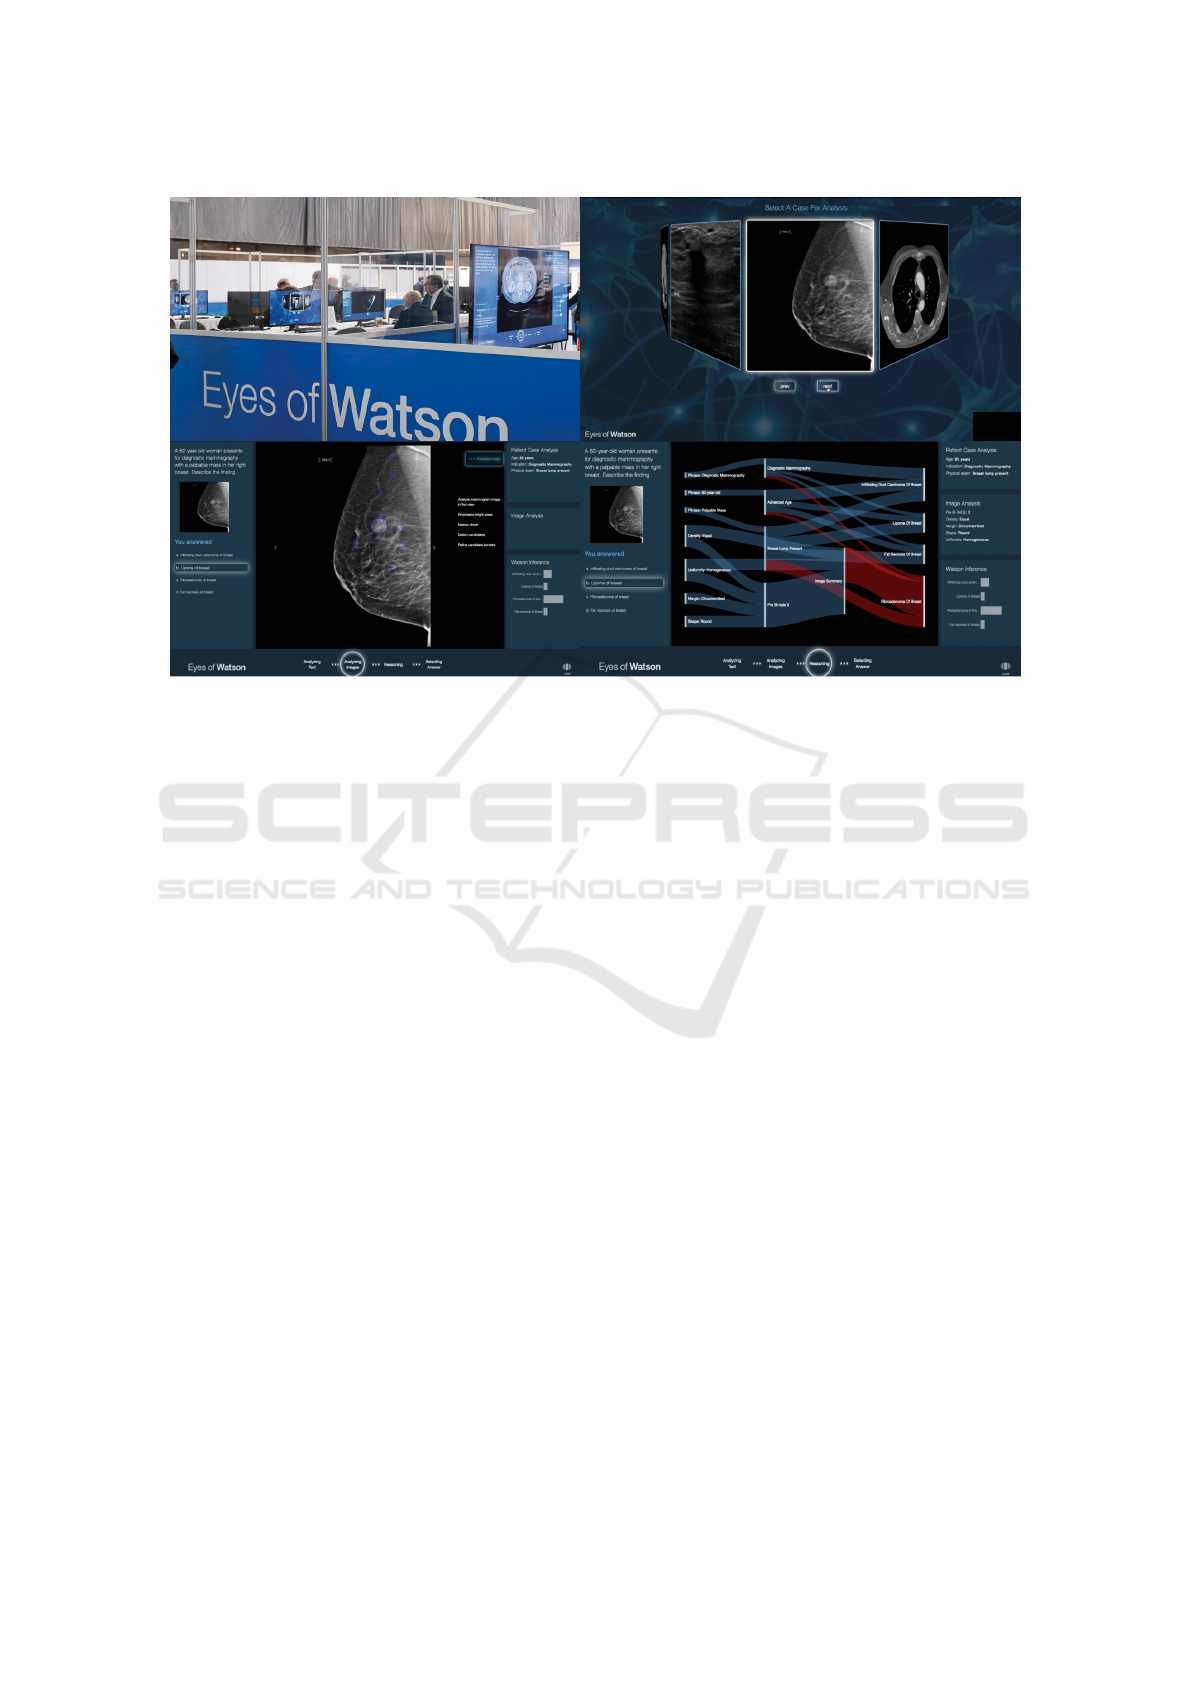
Figure 2: The Eyes of Watson exhibit at RSNA. Users received brief instructions and were provided access to a workstation
(upper left), could select exams (upper right), were presented images with a multiple-choice question (lower left), and could
then opt to view the results and the clinical inference pathway in a Sankey chart produced by the system (lower right).
cepts and relationships. For example, a relationship
in its simplest form in the knowledge base can be rep-
resented plainly as ”chest pain: sign and symptom:
myocardial infarction”.
iv) Imaging pipeline ranking. In this step, we
ranked the answer choices based on all of the pre-
vious steps in conjunction with the question type in-
formation. This module determined which imaging
pipeline was the most pertinent to the possible an-
swer choices. An analytics framework then regis-
tered this information. The framework contained all
imaging pipelines and some related textual informa-
tion (e.g. pipeline descriptions and imaging modali-
ties). These features were inputs to the search for ap-
plicable imaging pipelines within the analytics frame-
work. If Digital Imaging and Communications in
Medicine (DICOM) header information was avail-
able, this information was also included as a feature in
the search. The candidate pipeline search results were
filtered into further stages. These stages involved du-
plicates removal and updated pipeline selection. In
order to differentiate between analogous pipelines, we
performed distance calculations between the text de-
scriptions and concepts extracted for each pipeline
and answer. The pipelines were, finally, ranked in ac-
cordance with the shortest distance. For example, in
the case of two similar pipelines, ”aortic dissection”
and ”aortic aneurysm” such filtering became invalu-
able and essential. Once all of the answer choices
were matched with imaging pipelines, the pipelines
were run in sequential order.
Our answer selection process was an iterative one.
The features gathered from this text and image pro-
cessing module were fed to the reasoning module af-
ter the highest ranked imaging pipeline performed its
analysis. Had the reasoning module not been able
to provide sufficient evidence to probabilistically sup-
port an answer, the next highest ranked imaging mod-
ule was run. In this way, the process continued to
iterate until sufficient confidence in an answer was
acquired. Our reasoning module and how it was vi-
sualized by the system is detailed next.
2.3 Reasoning and Visualization
From each imaging pipeline, we identified features
such as diseases, specific measurements, and imag-
ing abnormalities. We then retained evidence from
both the imaging features and the textual features.
From this information, the reasoning algorithm was
able to create a probabilistic ranking of the answer
choices/targeted diseases. The disease or answer
choice with the highest probability was then selected
based on this evidence presented.
In our system, we chose to display our reasoning
workflow in the form of Sankey charts (Riehmann
et al., 2005). They are used to visualize what steps
the reasoning algorithm performed in order to arrive
Receptivity of an AI Cognitive Assistant by the Radiology Community: A Report on Data Collected at RSNA
181
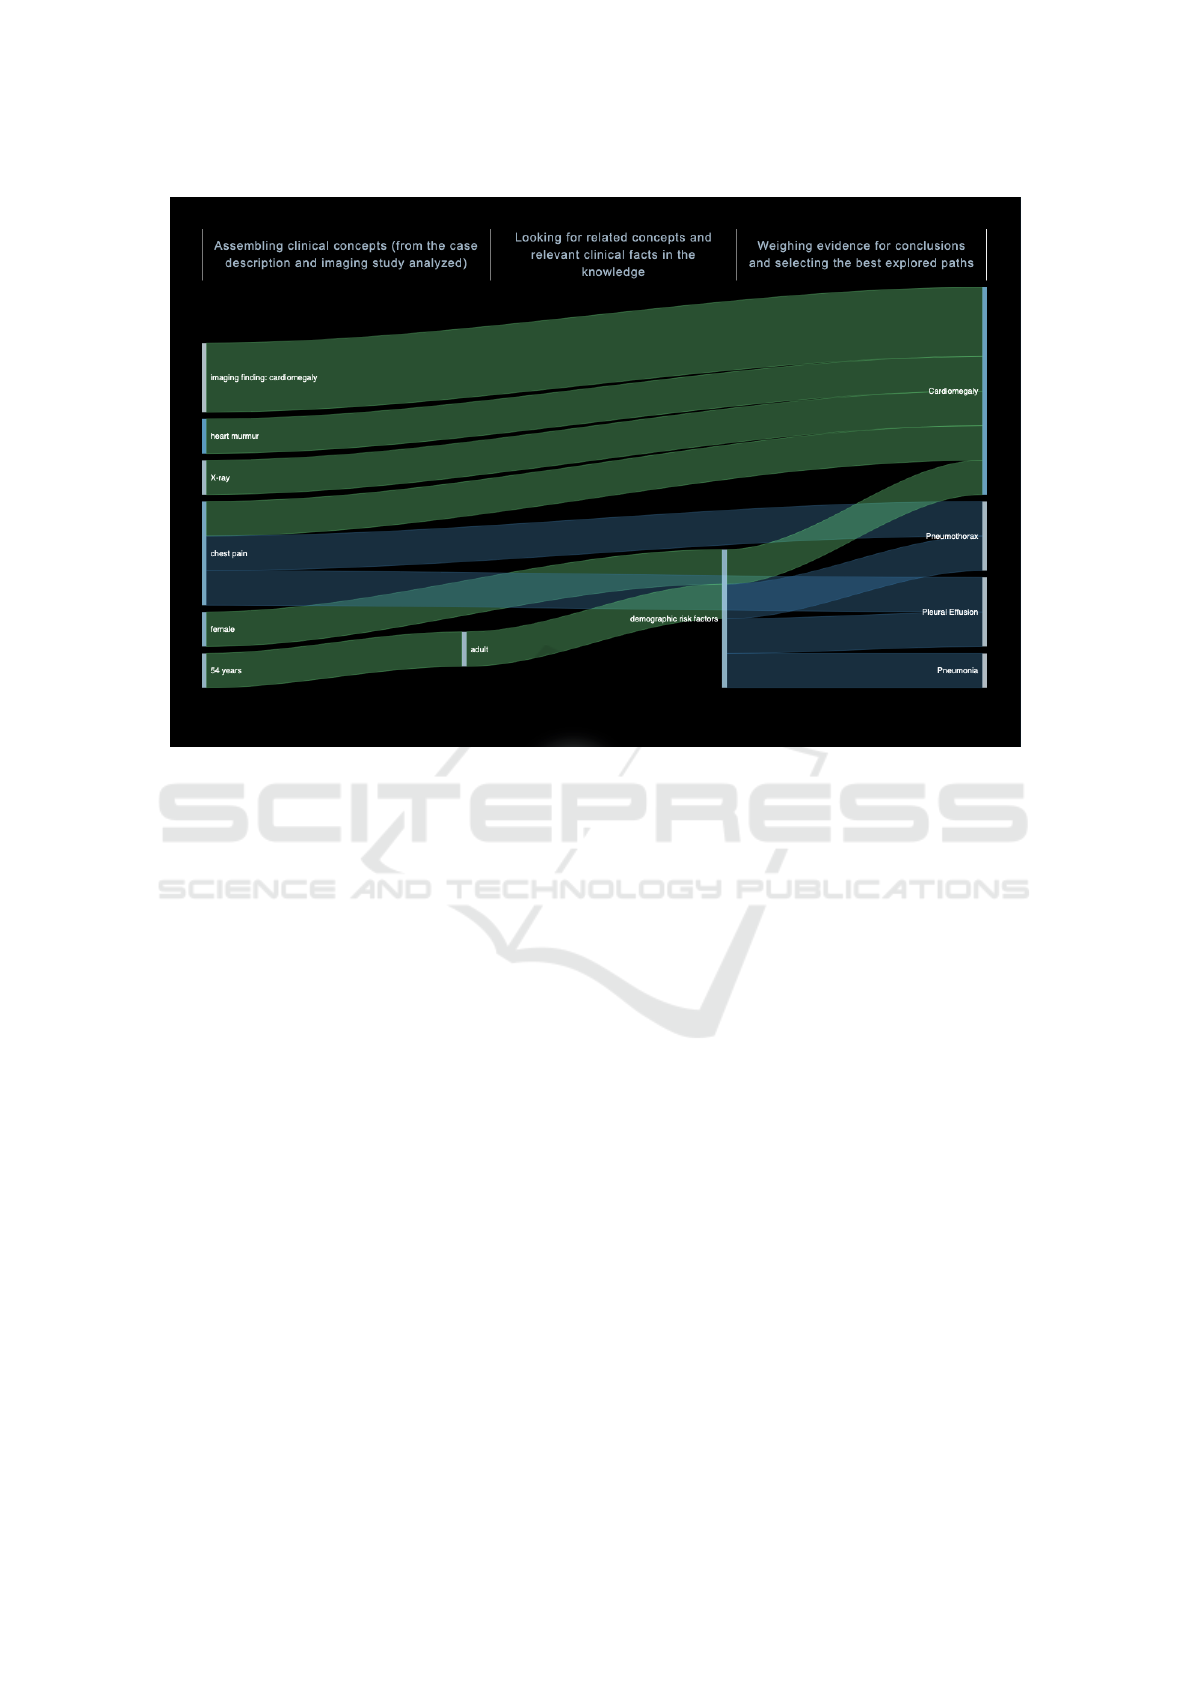
Figure 3: Example Sankey chart used to visualize the system’s reasoning steps.
at its conclusion. An example of such a Sankey chart
can be seen in Figure 3. The chart shows how the
most probable answer choice from the acquired data
points was determined by displaying data flows in the
form of weighted and colored lines (Google, 2016). A
line’s thickness denotes the weight of that data point
and its underlying confidence. Different colors are
also used to represent categories and show transitions
between stages. Ultimately, the highest ranked an-
swer choice would present with the highest number
and largest thickness of lines, showcasing that the par-
ticular answer had the most supporting evidence in
quantity and quality.
3 MATERIALS AND METHODS
3.1 Setting
The system’s exhibit was assembled in the learning
center at RSNA 2016 in Chicago. This conference
was attended by 54,037 registrants, including 26,988
healthcare professionals (RSNA, 2017).
A team of researchers and engineers arranged for a
computer demonstration wherein attendees could use
one of 16 kiosks that were provided. Three types of
conference attendees visited the demonstration at the
kiosks: i) A person who simply visited the learning
center, but did not sign in to a kiosk with their creden-
tials or experience the demonstration first-hand; ii) A
person who visited the learning center, signed in to the
kiosk with their credentials, experienced the demon-
stration, but did not take the survey; iii) A person who
visited the learning center, signed in to the kiosk, ex-
perienced the demonstration, and took the survey.
Visitors belonging to the first category were
mostly passive onlookers who experienced the
demonstration second-hand at a kiosk where someone
else was signed in. Those who visited the learning
center were first provided two training videos, each
2.5 minutes in duration. Persons who were inter-
ested in learning more and experiencing the demon-
stration, then progressed to a kiosk. Each kiosk had
four random cases selected from a collection of ap-
proximately 200 mammography and cardiovascular
cases. The collection included images in the form of
chest computed tomography (CT), chest computed to-
mography angiography (CTA), cardiac magnetic res-
onance imaging (MRI), and digital radiographs. Each
of the cases were prepared in a question-answering
format by a team of radiologists who worked with the
engineers, with the intent to mimic real world cases.
In each case, the user was presented with the im-
ages along with a multiple-choice question with four
possible answer choices. The user had the option to
HEALTHINF 2020 - 13th International Conference on Health Informatics
182
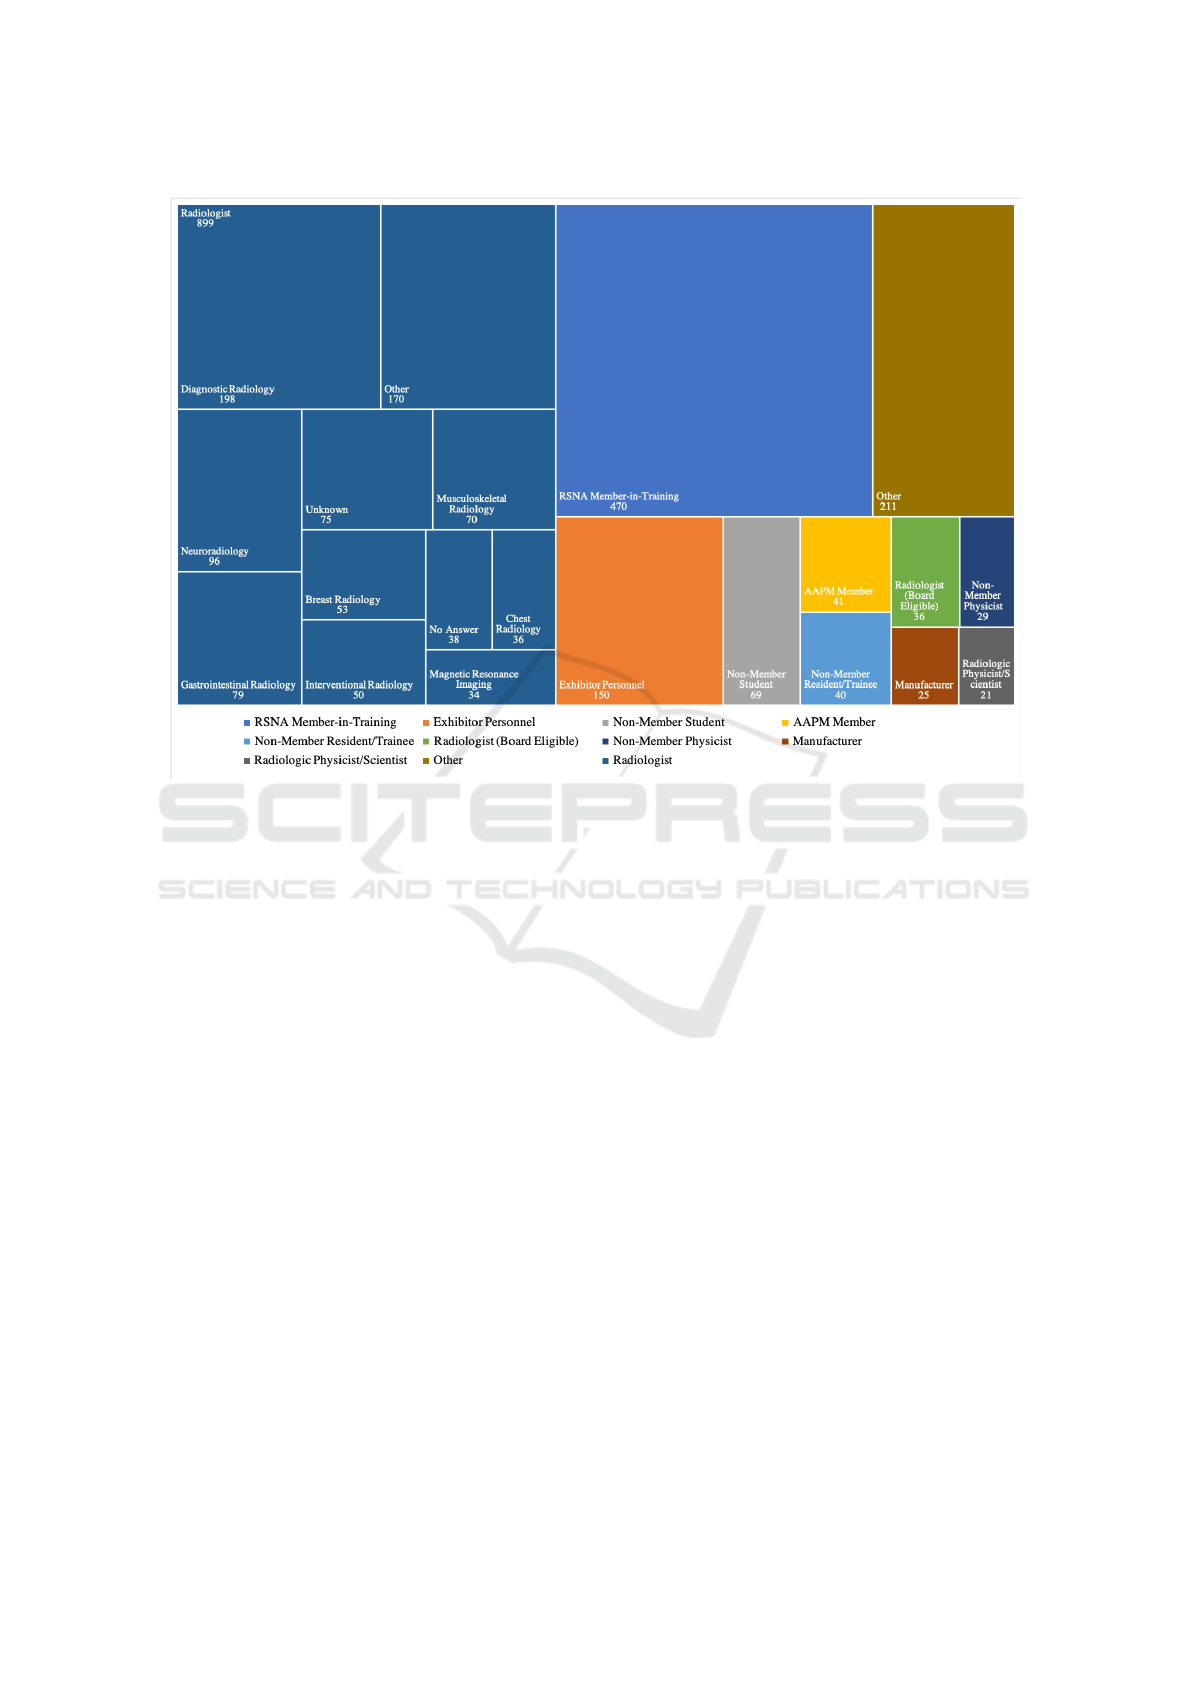
Figure 4: The 1991 participants in the system demonstration outlined by type, including radiology speciality.
choose an answer and then click ”Ask Watson” to
show the most probable answer, or they could opt out
of choosing an answer and directly click ”Ask Wat-
son” to show the workflow. In either case, by asking
the system, the user could experience and visualize
how our cognitive computing technology solved the
same exam and answered the same question. The
cognitive process was deliberately slowed down so
that the participants could see the system analyze the
question text, parse out the salient clinical informa-
tion, and then evaluate the images and segment the
normal anatomy. In the next step, the system evalu-
ated the images for suspected pathology. During each
step of the process, as more data were collected and
analyzed, the AI system calculated and updated the
statistical probability of each answer choice. In the fi-
nal step, the thought process of the system was graph-
ically illustrated through the Sankey diagrams. Fol-
lowing the completion of the process, the participant
could return to each step to peruse. Using the clini-
cal inference pathway page, participants could hover
over each color coded pathway to see the weight the
system gave that data point, and how it was connected
to the possible answer choices.
After experiencing the demonstration, users were
provided with a questionnaire. Their responses were
then tabulated and reported herein.
3.2 Data Analysis
There were 2,927 total participants who experienced
the Eyes of Watson demonstration. Described as vis-
itor type one above, these individuals visited the ex-
hibit in the learning center and scanned their RSNA
conference badge to indicate their presence. A total of
1,991 of these visitors proceeded to sign in to a kiosk
and take an exam (visitor types two and three). This
indicates that most, 67%, of the visitors to the learn-
ing center were interested in learning more about the
proposed system upon seeing the kiosks and training
videos.
Furthermore, we analyzed the type of user who
partook in the demonstration, and found that 45%
were radiologists, while the rest were RSNA mem-
bers, exhibitor personnel, or other types of individu-
als. We also analyzed the type of radiologist special-
izations, in order to better understand whether the sys-
tem would be of interest to experts outside of the chest
and breast radiology fields, since our system was fo-
cused in those two radiology specialties. We found
that a variety of radiologists specializing in different
fields participated in the exams; chest and breast ra-
diologists accounted for fewer than 100 participants.
Receptivity of an AI Cognitive Assistant by the Radiology Community: A Report on Data Collected at RSNA
183
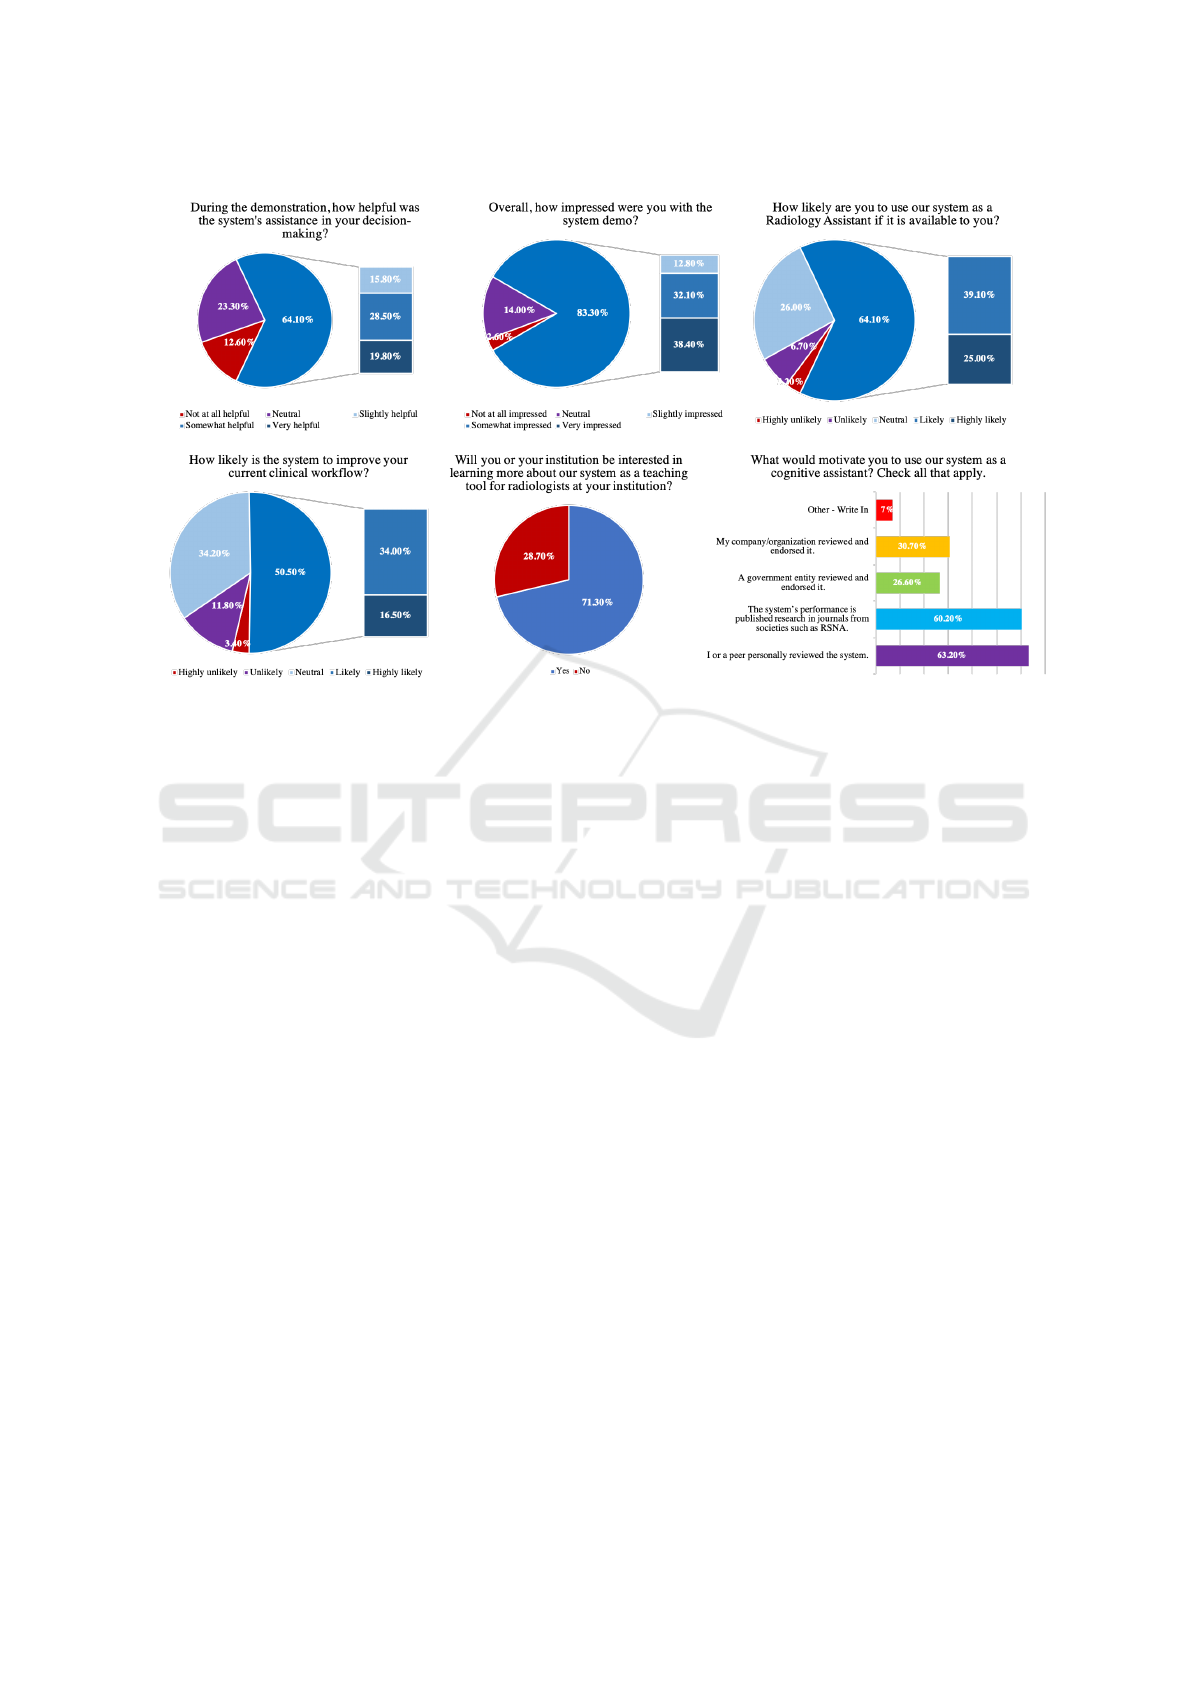
Figure 5: Survey multiple choice questions and responses. Top row and bottom left questions use Likert scale. Bottom middle
is a ”yes or no” question. Bottom right question allows for multiple selections.
The types of users depicted by their titles, and the
further detailed radiologist speciality information is
shown in Figure 4. The figure also includes the num-
ber of each type of participant.
Visitors who took an exam spent an average of 43
seconds per question in the demo, and, overall, users
responded to a total of 7,023 questions. In 4,235 in-
stances, the participant both answered a question and
selected the “Ask Watson” option. This option al-
lowed the system to perform its cognitive process on
the question. In 70 instances, the participant only
answered the question. In 2,129 instances, the user
asked the system without first answering the question.
Lastly, in 589 instances, the user neither answered
the question nor asked the system. When analyzed,
this shows that around 91% of users were interested
in seeing how the system worked once they were ex-
posed to it. Additionally, on average, each partici-
pant answered less than one question correctly. This
suggests that users were not motivated by the idea of
solving the problem correctly or outperforming the
system. Verbal feedback collected by staff at the event
indicated that many users purposefully chose an in-
correct answer in order to test the system. To support
this anecdotal evidence, data collected showed that
51% of users answered the questions in less than 30
seconds- an insufficient amount of time to arrive at the
correct conclusion. Analysis showed that users spent
an average of 41 seconds per question when the ques-
tion was answered incorrectly. In contrast, users took
an average of 51 seconds per question to choose the
correct answer. This shows that spending more time
on the questions led to correct answer selection, how-
ever, most users chose to spend 30 seconds or less.
Lastly, we provided a questionnaire with seven
questions for users who experienced the demonstra-
tion first-hand. This questionnaire was curated by our
team as a means to understand users’ experience with
our system. We included questions with Likert scale
instead of simply polar questions in order to better
understand the degree of receptiveness. A total of
1,025 users participated in the survey and answered
all of the questions following the demonstration; these
users were defined as visitor type three above. Six
of the questions possessed a multiple choice format,
while the remaining one involved a free text response.
Of the six multiple choice questions, four questions
employed the use of the Likert scale, one was a ”yes
or no” question, and one consisted of custom answer
choices designed by the authors. The questionnaire,
which can be visualized in Appendix A, was adminis-
tered electronically using a standard survey tool (Sur-
veymonkey, 2019). Figure 5 shows the user response
to the multiple choice portion of the questionnaire.
All positive responses such as ”slightly impressed”,
”somewhat impressed”, and ”very impressed” were
grouped together to better showcase the true receptiv-
ity to the system. The percent distinctions between
these categories can also be seen in the figure. Ad-
ditionally, Appendix B presents some representative
HEALTHINF 2020 - 13th International Conference on Health Informatics
184

responses to the free text question that show the most
popular feedback.
4 SUMMARY OF SURVEY
RESULTS
The survey results can be summarized as follows:
Overall, the RSNA attendees who received a demon-
stration of the AI tool were impressed with the sys-
tem and receptive to adoption. Nearly 85% were im-
pressed by the technology, and the majority reported
that they would like to use such a tool in the future.
15% of survey takers did not believe that a cognitive
assistant would help improve their workflow, exhibit-
ing some skepticism. As seen in Figure 4, the ma-
jority of participants also indicated that they would
use such a tool if validated by their own or a peer’s
personal experience, or if shown to be valid in a peer-
reviewed publication. Respondents, reportedly, were
less likely to be convinced by a government entity or
local validation.
Despite the much-published concern that AI sys-
tems may threaten physician jobs, the RSNA atten-
dees’ responses suggest that they are most motivated
by clinical outcomes. As AI continues to improve, it
will likely become a regularly used tool in all aspects
of healthcare. An intelligent cognitive assistant could
be a major factor that helps reduce clinical workload
and allows physicians to focus on their primary pur-
pose – the patient. Our results indicate that most peo-
ple who participated in this experience are open and
ready for a future of AI augmented medicine.
While this study showed promise for AI aided
cognitive assistants, it has a few limitations. First,
we did not rigorously collect accuracy data or vali-
date the credentials of the test-takers; our information
was derived from data collected from scanned RSNA
badges and system interaction. As a result, we cannot
report whether the user’s impressions were influenced
by their individual performance relative to the system.
Their receptivity could conceivably be influenced by
a technology that is either so outstanding that it is
threatening, or so poor that it is not helpful. Secondly,
we could not control against bias. For example, we do
not know if the attendees were self-selected because
of their interest in this technology. We did not col-
lect data that might have indicated whether the exhibit
changed a user’s impression of the technology.
Nevertheless, the results indicate that imaging
professionals are open to the use of artificial intel-
ligence technologies to provide cognitive assistance,
particularly if validated by personal experience, a peer
reference, or published research.
REFERENCES
Google (2016). Sankey diagram. https://developers.google.
com/chart/interactive/docs/gallery/sankey, note = Ac-
cessed: 2019-10-03.
Pillai, A., Katouzian, A., Kanjaria, K., Shivade, C., Jad-
hav, A., Bendersky, M., Mukherjee, V., and Syeda-
Mahmood, T. (2019). A knowledge-based question
answering system to provide cognitive assistance to
radiologists. In Medical Imaging 2019: Imaging In-
formatics for Healthcare, Research, and Applications,
volume 10954, page 1095418. International Society
for Optics and Photonics.
Pynoo, B., Devolder, P., Duyck, W., van Braak, J., Sijnave,
B., and Duyck, P. (2012). Do hospital physicians’ at-
titudes change during pacs implementation? a cross-
sectional acceptance study. International journal of
medical informatics, 81(2):88–97.
Riehmann, P., Hanfler, M., and Froehlich, B. (2005). Inter-
active sankey diagrams. In IEEE Symposium on In-
formation Visualization, 2005. INFOVIS 2005., pages
233–240. IEEE.
Rish, I. et al. (2001). An empirical study of the naive bayes
classifier. In IJCAI 2001 workshop on empirical meth-
ods in artificial intelligence, volume 3, pages 41–46.
RSNA (2017). Rsna facts. https://press.rsna.org/timssnet/
media/pressreleases/14 pr target.cfm?ID=1978#
targetText=RSNA\%C2\%AE\%20has\%20over\
%2054\%2C000,registrants\%2C\%20including\
%2026\%2C988\%20healthcare\%20professionals,
note = Accessed: 2019-10-03.
Singh, H., Spitzmueller, C., Petersen, N. J., Sawhney,
M. K., and Sittig, D. F. (2013). Information overload
and missed test results in electronic health record–
based settings. JAMA internal medicine, 173(8):702–
704.
Surveymonkey (2019). Surveymonkey. https://www.
surveymonkey.com/, note = Accessed: 2019-10-03.
Zeleznik, M. P., Maguire Jr, G. Q., and Baxter, B. (1983).
Pacs data base design. In Picture Archiving and Com-
munication Systems, volume 418, pages 287–295. In-
ternational Society for Optics and Photonics.
APPENDIX A
Question 1. During the demonstration, how helpful
was the system’s assistance in your decision-making?
a. Not at all helpful
b. Slightly helpful
c. Neutral
d. Somewhat helpful
e. Very helpful
Question 2. Overall, how impressed were you with
the system demo?
a. Not at all impressed
b. Slightly impressed
Receptivity of an AI Cognitive Assistant by the Radiology Community: A Report on Data Collected at RSNA
185

c. Neutral
d. Somewhat impressed
e. Very impressed
Question 3. How likely are you to use our system as
a Radiology Assistant if it is available to you?
a. Highly unlikely
b. Unlikely
c. Neutral
d. Likely
e. Highly Likely
Question 4. How likely is the system to improve your
current clinical workflow?
a. Highly unlikely
b. Unlikely
c. Neutral
d. Likely
e. Highly Likely
Question 5. Will you or your institution be interested
in learning more about using our system as a teaching
tool for radiologists at your institution?
a. Yes
b. No
Question 6. What would motivate you to use our sys-
tem as a cognitive assistant? Check all that apply.
a. I or a peer personally reviewed the
system’s performance.
b. The system’s performance is published
research in journals from societies such
as RSNA.
c. A government entity reviewed and
endorsed it.
d. My company/organization reviewed and
endorsed it.
e. Other
Question 7. Where do you think this should be in-
cluded in your clinical workflow? (Do you have any
additional feedback?)
Answer: Free text
APPENDIX B
Sample of free text responses to Question 7:
During routine interpretation At emergency
room by non-radiologists
It would be helpful if it reviewed findings af-
ter I have written the report but before I have
signed it off, allowing me to re-review my
findings.
As head of a large academic radiology depart-
ment training more residents than any other
program in the US, I think this could first be
educational for residents, and would be worth
exploring in breast and PE imaging.
Pre-reading cases Peer review Help with dif-
ficult cases Synthesize clinical data in context
with imaging
Should be integrating into the reading work-
flow. Watson could be inserted between the
time of imaging acquisition and image inter-
pretation by the radiologist.
1. Every exam should be evaluated and a re-
port (within limits) be generated and then com-
pared to the final read. For example, outpatient
studies that sit on the list over the weekend or
institutions that do not have 24 hours cover-
age. The read generated by Watson should not
be available for clinical decision making un-
til properly endorsed by an accredited body or
institution. 2. Post-operative changes, how-
ever, a standardized post-operative note should
be made available for a simpler algorithm. 3.
Long nodule follow-up 4. Any patient with
cross-sectional imaging that requires follow-
up. 5. HCC screening!!!
in case of doubts: we use to ask colleagues
for suggestions in difficult cases, but on night
calls or in small hospitals it may happen you
have no colleagues whom to ask for. therefor,
my suggestion is it should not be to expansive
so small hospital ans small clinical practicians
may be buy it
People will usually choose the cheapest op-
tion. Machine is going to be cheaper than
human. Thus performance must be abso-
lutely verified before clinical implementation
because it can not, I believe, be put back into
the box. Also, I listened a lecture about AI
and I would suggest AI as a second reader (if
there are two readers to all studies), because it
would be more rewarding for a radiologist to
do the job first and then only check the po-
tential misses. If radiologists job is only to
check if the machine has made any mistakes,
I believe A) she/he would more easily ignore
machine’s suggestions and B)she/he becomes
demoralized. (Sloppy, underperfoming, unen-
thusiastic and depressed).
HEALTHINF 2020 - 13th International Conference on Health Informatics
186
