
An Empirical Evaluation of Cross-scene Crowd Counting Performance
Rita Delussu, Lorenzo Putzu and Giorgio Fumera
University of Cagliari, Piazza D’Armi, Cagliari, Italy
Department of Electrical and Electronic Engineering, Piazza D’Armi, 09123 Cagliari, Italy
Keywords:
Crowd Counting, Crowd Density Estimation, Cross-scene Evaluation, Video Surveillance.
Abstract:
Crowd counting and density estimation are useful but also challenging tasks in many video surveillance sys-
tems, especially in cross-scene settings with dense crowds, if the target scene significantly differs from the
ones used for training. This also holds for methods based on Convolutional Neural Networks (CNNs) which
have recently boosted the performance of crowd counting systems, but nevertheless require massive amounts
of annotated and representative training data. As a consequence, when training data is scarce or not rep-
resentative of deployment scenarios, also CNNs may suffer from over-fitting to a different extent, and may
hardly generalise to images coming from different scenes. In this work, we focus on real-world, challenging
application scenarios when no annotated crowd images from a given target scene are available, and evaluate
the cross-scene effectiveness of several regression-based state-of-the-art crowd counting methods, including
CNN-based ones, through extensive cross-data set experiments. Our results show that some of the existing
CNN-based approaches are capable of generalising to target scenes which differ from the ones used for train-
ing in the background or lighting conditions, whereas their effectiveness considerably degrades under different
perspective and scale.
1 INTRODUCTION
Automatic crowd counting and density estimation are
useful functionalities in video surveillance applica-
tions. These tasks can be very challenging in un-
constrained real-world scenarios, especially for dense
crowd scenes with severe overlapping between peo-
ple, perspective distortion and different lighting con-
ditions. Several crowd counting and density estima-
tion methods have been proposed so far (Loy et al.,
2013; Sindagi and Patel, 2017a). Some of them are
based on pedestrian detection or tracking, which are
suitable only for sparse crowds with limited or no
overlapping between people (Loy et al., 2013). Other
methods, which are more suited to dense crowds,
are based on regression techniques, either for crowd
counting only (Loy et al., 2013) or also for density es-
timation (Sindagi and Patel, 2017a). The latter meth-
ods require a training set of crowd images manually
annotated with the exact number of people.
In this work we focus on dense crowd scenarios,
which are the ones we are addressing in the context
of the LETSCROWD project funded by the European
Commission under the H2020 programme related to
the security of mass gathering events.
1
In particular,
we consider fully unsupervised cross-scene applica-
tion scenarios where a system has to be deployed on a
specific target scene for which it is not possible to col-
lect and annotate images for training or fine-tuning,
and additionally real-time operation is required. Al-
though considerable progress has been achieved so
far, especially by recent methods based on convolu-
tional neural networks (CNNs) (Sindagi and Patel,
2017a), and some solutions based on domain adapta-
tion or transfer learning have already been proposed,
crowd counting and density estimation remain chal-
lenging tasks in a cross-scene setting like the one
above. In particular, only limited cross-scene evalu-
ations of existing methods have been provided in the
respective papers. This is partly due also to the small
number and relatively small size of publicly available
data sets of dense crowds.
A thorough evaluation and analysis of the per-
formance of existing methods under realistic cross-
scene settings is therefore still lacking in the litera-
ture. This is however a necessary step toward fur-
ther development of crowd counting and density esti-
mation methods that can be effectively deployed also
1
https://letscrowd.eu/
Delussu, R., Putzu, L. and Fumera, G.
An Empirical Evaluation of Cross-scene Crowd Counting Performance.
DOI: 10.5220/0008983003730380
In Proceedings of the 15th International Joint Conference on Computer Vision, Imaging and Computer Graphics Theory and Applications (VISIGRAPP 2020) - Volume 4: VISAPP, pages
373-380
ISBN: 978-989-758-402-2; ISSN: 2184-4321
Copyright
c
2022 by SCITEPRESS – Science and Technology Publications, Lda. All rights reserved
373

in challenging cross-scene application scenarios. Ac-
cordingly, the aim of this work is to evaluate the
performance gap of state-of-the-art regression-based
crowd counting methods between same-scene and
cross-scene scenarios, i.e., where manually annotated
images of the target scene are or are not available for
training, respectively. To this aim we simulate cross-
scene settings using the available benchmark data
sets, and consider several state-of-the-art regression-
based methods, including the most recent CNN-based
ones, for which either a re-implementation was possi-
ble or the code was made available by the authors.
This paper is structured as follows. In Sect. 2 we
review existing approaches and methods for crowd
counting and density estimation. In Sect. 3 we discuss
their open issues, focusing on the application scenario
mentioned above, and describe the objective of this
work. Our experimental evaluation is described in
Sect. 4. The discussion of Sect. 4.4 concludes this
paper and outlines directions for future work.
2 RELATED WORK
Several approaches have been developed so far for
crowd counting and density estimation (Loy et al.,
2013; Sindagi and Patel, 2017a). Existing methods
can be categorised into counting by detection, count-
ing by clustering, and counting by regression (Loy
et al., 2013). The first two approaches are based on
detecting or tracking each pedestrian in a scene, and
can provide an exact count. However they are effec-
tive only on sparse crowd scenes with little or no over-
lapping among people (Loy et al., 2013). The latter
one provides instead a direct mapping from low-level
image features to the number of people (Loy et al.,
2013) or, for most recent CNN-based methods, to the
density map, from which the number of people can be
derived (Sindagi and Patel, 2017a). This approach is
suited to dense crowd scenes, but can provide only an
estimate of the number of people and the correspond-
ing density map. In the rest of this section, we focus
on the regression-based approach.
2.1 Early Regression-based Methods
Early regression-based methods are based on extract-
ing low-level image features (usually texture, gradient
and edge), and on training a regression model to es-
timate the number of people in a given image. Some
of them carry out also foreground segmentation (e.g.,
by background subtraction). Typical features are the
grey-level co-occurrence matrix (GLCM) and Local
Binary Patterns (LBP). Both linear and non-linear re-
gression models have been proposed, such as partial
least squares, kernel ridge regression, support vector
regression with RBF kernel and Gaussian process re-
gression (Loy et al., 2013).
2.2 Methods based on CNNs
More recent CNN-based methods estimate either the
number of people or the density map. In the latter
case the density map (ground truth) is obtained as the
sum of Gaussian kernels centred on each pedestrian,
whose position has to be manually annotated (Sindagi
and Patel, 2017a). Existing methods are based either
on specific CNN architectures, or on modifications of
“standard” architectures such as VGG.
A specific Multi-Column CNN architecture
(MCNN) was proposed in (Zhang et al., 2016), aimed
at achieving robustness to scale variations. It is made
up of three parallel CNNs with the same structure ex-
cept for the dimensions of filters (large, medium and
small), and a block used to merge the correspond-
ing feature maps. Two similar architectures, Count-
ing CNN (CCNN) and Hydra CNN, were proposed in
(Onoro-Rubio and L
´
opez-Sastre, 2016). CCNN com-
putes the density maps of several image patches, and
aggregates them to obtain the final density map. Hy-
dra CNN improves the CCNN architecture by com-
bining the information from multiple scales at the
same time, inspired by other works (Marsden et al.,
2017; Sindagi and Patel, 2017b). In particular, in
(Sindagi and Patel, 2017b) a cascade CNN architec-
ture (Cascade-CNN) was proposed to learn two re-
lated sub-tasks: crowd count classification and den-
sity map estimation. The first sub-task consists of cat-
egorising the crowd count into ten groups. The second
one uses information extracted in the first sub-task to
obtain the density map. The first layers are shared
between the two sub-tasks. Despite the fact that all
these methods have a high performance, their com-
plexity might be high, and the training phase might
take several hours. This issue was addressed in (Liu
et al., 2018) and (Li et al., 2018). In (Liu et al., 2018)
a scale-aware multi-task architecture fast to train was
proposed. It extracts concentric image patches, and
exploits the fact that inner patches contain a number
of people lower or equal to larger ones. In the Con-
gested Scene Recognition Network (CRSNet) of (Li
et al., 2018) a dilated convolution which aggregates
multi-scale information without increasing the num-
ber of parameters is used to keep processing time low.
It consists of one front-end and four different back-
ends: the front-end is based on VGG, in which the
fully connected layers are replaced by convolutional
layers; the back-end is composed by dilated convo-
VISAPP 2020 - 15th International Conference on Computer Vision Theory and Applications
374

lutional layers to up-sample the feature maps to the
original image resolution. The Deformation Aggre-
gation network (DA-Net) of (Zou et al., 2018) com-
putes the density map by aggregating the outputs of
different layers. It is based on the VGG architec-
ture to which new blocks are added to preserve the
correspondence between the input image and the es-
timated density map, to improve robustness to scale
variations. A soft-attention strategy is also used to dy-
namically weigh the feature maps of different layers.
Similarly, in (Liu et al., 2019) an end-to-end archi-
tecture was proposed to fuse multi-scale contextual
information (CAN) without using image patches. It
is composed of the first ten layers of VGG-16 and a
decoder based on dilated convolutions. The output of
the first part of this architecture concatenates feature
maps with weighted feature maps.
To limit cross-scene performance degradation,
which is inherent in supervised methods, domain
adaptation methods have been proposed. The Spatial
Fully Connected Network (SFCN) model of (Wang
et al., 2019) consists of a standard CNN architecture
(VGG-16 or ResNet-101), a spatial encoder and a re-
gression layer; it is trained on a synthetic data set ob-
tained from a video game, and is fine tuned using real
images from benchmark data sets. In (Sindagi and
Patel, 2020) a Hierarchical Attention-based Crowd
Counting Network was proposed: a spatial attention
module selects relevant regions in the feature maps,
and the global attention module produce a channel-
wise map. The network is fine-tuned on a data set
with categorical, image-level density values (zero,
very low, low density, etc.).
3 OPEN ISSUES AND GOAL OF
THIS WORK
In this work we consider the following, very challeng-
ing real application scenario we are dealing with in
the LETSCROWD project:
• a crowd counting system has to be deployed on
a given target scene, which is different from the
ones used for training, in terms of perspective,
background, configuration of the people in the
scene and possibly also crowd size;
• no annotated crowd images of the target scene can
be collected for training or fine tuning the system;
• the system has to operate in real time.
Cross-scene effectiveness is a known issue of existing
crowd counting and density estimation methods, but,
to the best of our knowledge, it has been addressed ex-
plicitly only in (Zhang et al., 2015; Sindagi and Patel,
2020). The solution proposed in (Zhang et al., 2015)
is based on the use of a perspective normalisation to
compensate for perspective distortion. Using a per-
spective map is common in regression-based crowd
counting methods (Loy et al., 2013); however it may
be not sufficient if the target scene is significantly dif-
ferent from the ones used for training. The solution
of (Sindagi and Patel, 2020) is partially supervised: it
requires to collect representative images from the tar-
get scene, annotating them into three discrete density
values (low, medium, high), and in using them to fine
tune the proposed CNN architecture; this can be how-
ever infeasible in the application scenario considered
in this work. Further solutions are fully unsupervised,
but they still require the collection of representative
images from the target scene (Liu et al., 2018; Sam
et al., 2019). Additionally, several CNN-based solu-
tions exhibit a high processing time in the inference
step, which can prevent their use in real-time appli-
cations (Sindagi and Patel, 2017a). Some works re-
ported a cross-scene evaluation of the proposed meth-
ods (Zhang et al., 2016), but limited to a single target
data set. Moreover, some of these evaluations can-
not be considered representative of the above appli-
cation scenario where a crowd counting and density
estimation system has to be deployed on a specific tar-
get scene, since benchmark data sets of dense crowds
are made up of a collection of single crowd images
taken from different scenes, with the only exception
of World Expo Shanghai 2010 (see Sect. 4.2).
Evaluating the performance gap of existing crowd
counting and density estimation methods between
same-scene and cross-scene settings, and especially
the cross-scene setting considered here, is therefore
still an open issue and also a very relevant one. This
is the goal of our ongoing work, inspired by our expe-
rience in the LETSCROWD project. In the rest of this
paper we present the first results of an extensive em-
pirical evaluation we are carrying out under the set-
ting described above. To this aim we simulate the
above cross-scene setting by using as the target scene
a given data set of images from a single scene, and by
using images from different scenes in the training set.
Our evaluation is carried out on several state-of-the-
art regression-based methods, including CNN-based
ones, for which either a re-implementation was possi-
ble or the code was made available by the authors.
4 EXPERIMENTAL EVALUATION
In this section we evaluate and compare the same- and
cross- crowd counting performance of state-of-the-art
methods on benchmark data sets. We first describe the
An Empirical Evaluation of Cross-scene Crowd Counting Performance
375

methods and data sets we used, then the experimental
set-up and finally the experimental results.
4.1 Crowd Counting Methods
We selected four representative regression-based
methods (see Sect. 2.1): linear regression, Partial
Least Squares (PLS) regression, Support Vector Re-
gression (SVR) with Radial Basis Function (RBF)
kernel, and Random Forest (RF) regression (Loy
et al., 2013). Gaussian Process regression has been
discarded since it turned out to be not suitable for real
time applications. Most of the feature sets used by
the above methods (see (Loy et al., 2013)) are signif-
icantly affected by the image background; even when
a background image is available, existing background
subtraction and segmentation approaches are not ef-
fective in real-world scenarios with frequent illumi-
nation changes. We decided therefore to use only the
LBP texture descriptor. Moreover, here we have not
used the perspective correction nor the region of inter-
est mask (Loy et al., 2013; Ryan et al., 2015), to cor-
rect the distortion or the influence of the background.
Indeed, this experiments should simulate a real case
scenario (a new camera installation) where all these
information and data are not available.
We also selected six more recent CNN-based
methods (see Sect. 2.2) whose code was made avail-
able by the authors: MCNN, Cascade-CNN, DA-
Net, CRSNet, CAN, and SFCN (see Sect. 2.2 for a
description of these methods). We point out that for
all the above CNN architectures, except for SFCN, we
used the trained models provided by the same authors.
For SFCN we trained the whole CNN instead, since
no pre-trained model was available.
4.2 Data Sets
To our knowledge, only three publicly available
data sets can be considered representative of dense
crowd scenarios (Zhang et al., 2019; Sindagi and Pa-
tel, 2017a), namely ShanghaiTech, UCF-QNRF and
World Expo Shanghai 2010. However the first two
do not contain images from a same scene, and World
Expo Shanghai 2010 contains only 3 to 41 training
images belonging to a same scene. They are there-
fore not suitable to be used to simulate target scenes
in the testing sets of our cross-scene experiments, un-
der the scenario of interest to this paper. We used
only ShanghaiTech to train CNN-based models. To
simulate the target scenes we used three other pub-
licly available, single-scene data sets, namely Mall,
UCSD and PETS. Although they do not include dense
crowd images, they present challenging crowd scenes
nevertheless, with lighting variations, perspective dis-
tortion and severe occlusions. Mall is made up of
2,000 frames from a single scene, collected from a
surveillance camera in a shopping mall, with a size
of 640×480. It contains a total of 62,325 pedestrians
(Chen et al., 2012), with 13 to 53 people per frame
(on average 31). This is a challenging data set with
severe perspective distortion and several occlusions
caused by static objects or by other people. Follow-
ing the set-up used in recent works (Sindagi and Pa-
tel, 2017a) we used the first 800 frames as the train-
ing set and the remaining 1200 frames as the testing
set. UCSD contains 2,000 frames of size 238×158
acquired from a camera installed in a pedestrian walk-
way at the UCSD campus (Chan et al., 2008). It con-
tains a total of 49,885 pedestrians, with an average
number of people per frame of around 25. Follow-
ing the set-up of (Sindagi and Patel, 2017a) we split
the data set into two parts: a training set containing
frames from 600 to 1,399, and a testing set containing
the remaining frames. PETS2009 was released to test
several algorithms for visual surveillance tasks (Fer-
ryman and Shahrokni, 2009). The S1 part includes
crowd counting: it is subdivided into three difficulty
levels, defined by the crowdedness and behaviour of
the people in the scene. Each level presents two se-
quences acquired at different times under different il-
lumination and shading. This is not a standard single-
scene data set since each sequence has been acquired
with a different camera, but the frames belonging to
the same camera view (for different difficulty lev-
els and times) can be grouped to create single-scene
data sets. To this aim we grouped the images from
the first 3 cameras to create 3 single-scene data sets
named PETSview1,PETSview2 and PETSview3; we
used the ground truth provided in (Zhang and Chan,
2019). ShanghaiTech contains 1,198 images for a to-
tal of 330,165 pedestrians (Zhang et al., 2016). This
data set is one of the most used in the literature, espe-
cially for training CNN models, since it includes im-
ages acquired from different cameras, with different
illumination, perspective and crowd density. It is usu-
ally divided into two parts, Part A and Part B, con-
taining 482 and 716 images, respectively. Each part
is further subdivided into 300 images for training and
the remaining ones for testing (Liu et al., 2018; Zhang
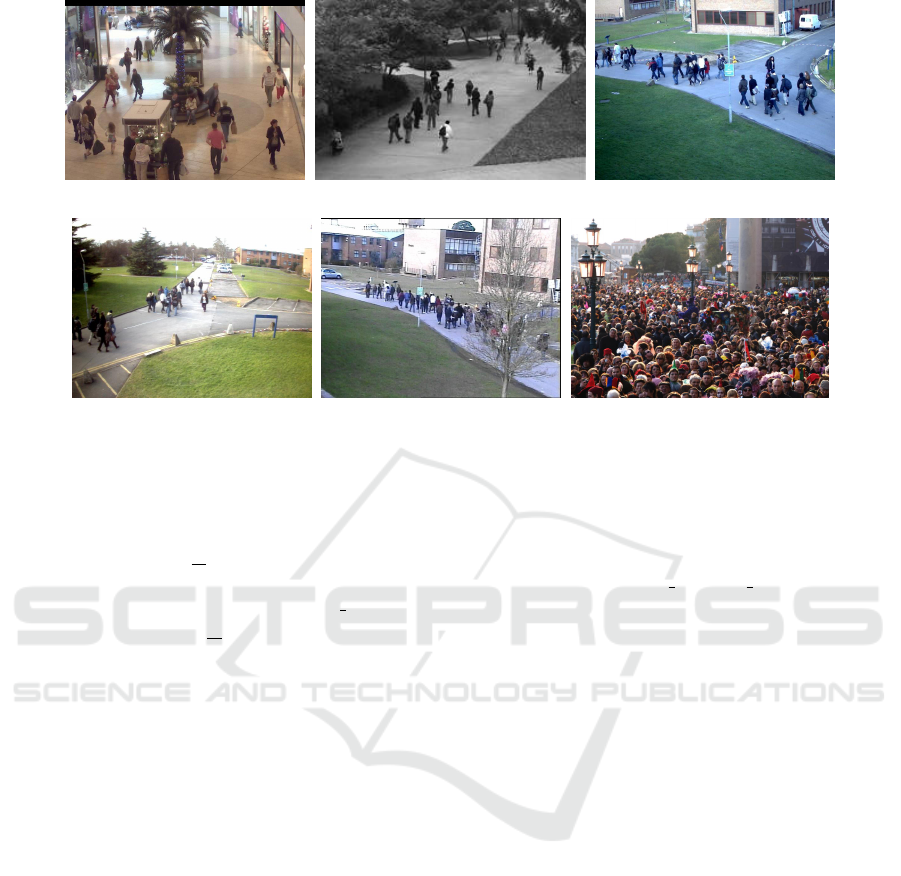
et al., 2016; Sindagi and Patel, 2017a). Fig. 1
shows one frame from the above data sets.
4.3 Experimental Set-up
We consider two accuracy metrics commonly used for
crowd counting methods, mean absolute error (MAE)
VISAPP 2020 - 15th International Conference on Computer Vision Theory and Applications
376
(a) (b) (c)
(d) (e) (f)
Figure 1: Example of frames from the data sets used in our experiments: (a) Mall, (b) UCSD, (c) PETSview1, (d) PETSview2,
(e) PETSview3, (f) ShanghaiTech.
and mean root squared error (RMSE):
MAE =
1
N
N
∑
i=1
|y
i
− ˆy
i
| (1)
RMSE =
1
N
N
∑
i=1
(y
i
− ˆy
i
)
2
!
1
2
(2)
where N is the number of images, y
i
is the exact peo-
ple count in the i-th image (ground truth) and ˆy
i
the
estimated count. Note that RMSE penalises large
errors more heavily than small ones with respect to
MAE. We point out that in many recent works (Liu
et al., 2018; Wang et al., 2019; Ryan et al., 2015)
the RMSE metric was used, but it was called MSE,
although MSE does not include the square root (Loy
et al., 2013). We use the RMSE to be aligned with the
most recent works in this field, and also because it has
the same unit of measurement as MAE.
In our experiments we simulated the cross-scene
setting described at the beginning of Sect. 4.1 by us-
ing training images taken from one or several data
sets, and testing the resulting model on images from a
single scene taken from a different data set. As a base-
line to evaluate the performance gap between same-
scene and cross-scene scenarios, for each model we
also include the results obtained using training and
testing samples from a same data set. Tables 1 and 2
show the results of the experiments carried out us-
ing training images taken from a single data set. For
ease of comparison, for each target scene (data set)
the same-scene performance is highlighted in grey.
To evaluate whether using as training data im-
ages coming from different scenes can improve cross-
scene performance, we also carried out experiments
using as a training set the multi-scene data set
ShangaiTech (either part A or part B). The results are
reported in Table 3.
4.4 Results
From Table 1 it can be observed that in most cases
the accuracy achieved in cross-scene experiments by
CNN-based methods is definitely worse than that one
achieved in the corresponding single-scene experi-
ment (i.e., when training and testing images come
from the same data set). The most noticeable perfor-
mance gap can be observed when UCSD is used as
the target scene (testing set). On the other hand, as
it can be expected, when training images come from
a different data set which however has a similar per-
spective and scale as the testing images (target scene)
the cross-scene accuracy is comparable with the cor-
responding single-scene accuracy. This happens for
the Mall and PETS data set, up to the point that in
some cases the performance achieved on Mall is even
better when the training set comes from PETS than
from Mall itself. Similar behaviour can be observed
when two of the three different views of the PETS
data sets, which are very similar, are used in a cross-
scene experiment. Instead, it is interesting to see from
Table 2 that the cross-scene performances of meth-
ods not based on CNNs are mostly comparable to the
ones of CNN-based methods, whereas (as it can be ex-
pected) the same-scene performance is generally bet-
An Empirical Evaluation of Cross-scene Crowd Counting Performance
377

Table 1: Cross-scene MAE and RMSE of CNN-based methods. Same-scene accuracy (when training and testing come from
the same data set) is reported for comparison, highlighted in grey. The best result for each column is reported in bold.
Method
Training set
Testing set
Mall UCSD PETSview1 PETSview2 PETSview3
MAE RMSE MAE RMSE MAE RMSE MAE RMSE MAE RMSE
Multi Col.
Mall 5.33 6.17 24.64 25.75 5.94 7.83 9.67 10.95 9.9 11.22
UCSD 86.39 88.04 2.3 2.84 144.9 149.6 49.4 56.85 180.6 181.2
PETSview1 19.54 20.16 24.18 25.28 6.2 7.86 22.05 23.59 9.77 11.75
PETSview2 3.39 4.27 19.62 20.92 20.93 22.19 4.23 5.08 24.29 27.72
PETSview3 4.31 5.35 21.28 22.47 19.54 21.63 10.37 11.66 4.18 5.13
Cascheded
Mall 5.53 6.39 23.42 24.58 5.77 7.42 17.65 19.28 11.41 12.79
UCSD 189.1 191.1 2.04 2.50 213.7 217.9 111.9 113.7 298.5 300.8
PETSview1 9.93 10.73 24.18 25.13 5.11 6.29 15.56 17.20 4.46 5.95
PETSview2 4.68 5.95 24.63 25.76 36.85 38.49 4.80 6.06 47.34 50.96
PETSview3 4.61 5.79 21.94 23.12 21.90 24.54 11.50 13.97
4.23 5.06
DA-Net
Mall 5.43 6.42 25.42 26.54 7.51 9.43 11.7 13.14 8.84 10.27
UCSD 164.1 166.1 5.18 6.39 185.9 192.1 61.76 66.53 227.3 228.5
PETSview1 7.97 9.06 26.1 27.09 4.92 6.15 16.41 19.12 6.34 7.74
PETSview2 28.95 29.54 27.86 29.0 26.43 28.38 28.68 30.37 32.89 33.38
PETSview3 7.9 9.48 18.8 20.12 18.02 20.45 13.2 15.15 4.63 5.92
SFCN
Mall 4.05 5.02 28.15 29.27 19.37 20.85 27.66 28.72 71.38 71.87
UCSD 880.2 882.1 2.91 3.64 853.5 859.6 634.3 635.5 988.4 990.6
PETSview1 8.33 9.64 27.13 28.1 6.32 7.57 12.83 14.5 10.74 12.05
PETSview2 36.55 38.35 25.93 26.85 85.29 87.81 8.1 9.81 106.9 108.6
PETSview3 14.78 15.98 28.23 29.36 11.49 13.64 10.03 12.74 4.35 5.68
CSRNet
Mall 6.57 7.73 24.51 25.8 21.55 23.89 19.08 21.61 15.37 16.38
UCSD 70.78 71.46 6.2 7.01 57.52 61.86 28.29 31.21 69.06 69.36
PETSview1 14.51 14.96 27.33 28.43 5.54 6.83 15.62 17.46 20.57 21.11
PETSview2 12.15 12.66 27.06 28.16 10.14 11.82 7.09 7.9 8.42 9.53
PETSview3 9.21 9.89 27.49 28.62 5.84 6.8 9.66 10.56 2.9 3.76
CAN
Mall 2.59 3.21 28.09 29.23 8.28 10.36 17.49 20.02 29.54 30.11
UCSD 281.6 283.1 4.73 6.16 173.5 176.9 133.4 135.2 252.0 252.4
PETSview1 10.5 11.17 27.5 28.56 6.33 7.5 8.43 9.25 3.94 4.84
PETSview2 27.59 28.51 27.1 28.15 24.62 26.03 6.07 7.67 5.09 6.77
PETSview3 6.73 7.7 27.55 28.7 7.5 9.07 11.54 12.78 6.82 7.84
ter for CNN-based methods Table 1.
Consider finally the cross-scene experiments on
CNN-based methods where the multi-scene Shang-
haiTech was used as the training set, whose results
are reported in Table 3. First, the comparison with the
results achieved in the same-scene setting (Table 1,
grey entries) shows that in most cases the best cross-
scene performance on a given target scene (data set)
is worse than the worst same-scene performance: this
means that even using the multi-scene ShanghaiTech
as the training set does not fill the gap with the same-
scene setting. If we compare the cross-scene perfor-
mance in both tables, no consistent improvement can
be observed when the training set comes from the
multi-scene ShanghaiTech: in several cases (for the
same CNN model) a better cross-scene performance
is achieved when the training set comes from a single-
scene data set.
5 CONCLUSIONS
We evaluated the gap between the same- and cross-
scene performance of several state-of-the-art crowd
counting methods based on regression models and
on CNNs, focusing on a challenging, real-world ap-
plication scenario where no manually annotated im-
ages of a specific target scene are available. To this
VISAPP 2020 - 15th International Conference on Computer Vision Theory and Applications
378

Table 2: Cross-scene MAE and RMSE of regression models not based on CNNs. See caption of Table 1 for more details.
Method
Training set
Testing set
Mall UCSD PETSview1 PETSview2 PETSview3
MAE RMSE MAE RMSE MAE RMSE MAE RMSE MAE RMSE
linear
Mall 2.74 3.49 9.59 11.63 289.2 294.4 348.7 349.0 268.1 270.9
UCSD 67.3 78.75 2.9 3.54 334.6 347.9 369.2 374.0 128.2 146.6
PETSview1 276.9 277.0 577.1 577.2 6.25 7.91 33.43 38.04 9.35 11.17
PETSview2 210.2 210.3 308.4 308.4 97.86 127.0 4.85 5.98 159.4 160.2
PETSview3 12.15 14.01 29.09 29.93 110.3 110.7 125.1 126.6 6.84 8.42
RF
Mall 3.82 4.85 5.12 7.42 9.27 12.43 12.15 13.96 4.44 6.59
UCSD 5.83 6.98 3.82 4.66 9.12 11.45 8.06 10.46 5.22 5.94
PETSview1 3.89 5.07 6.92 8.12 9.47 11.03 13.59 14.98 8.36 9.31
PETSview2 6.88 8.57 5.38 7.31 8.01 8.94 9.56 11.05 6.27 8.14
PETSview3 5.52 7.07 6.34 7.73 10.11 11.54 11.59 12.54 11.41 12.49
SVRrbf
Mall 4.8 6.29 8.15 9.18 9.56 10.45 9.8 10.68 8.74 9.55
UCSD 7.68 9.32 5.38 7.31 10.74 12.08 12.09 13.15 12.86 13.88
PETSview1 12.26 13.57 6.21 8.52 12.82 15.25 14.85 16.79 17.67 18.56
PETSview2 8.54 10.12 5.13 7.3 11.06 12.62 12.6 13.81 13.78 14.8
PETSview3 5.11 6.71 7.52 8.61 9.76 10.61 10.2 11.04 9.5 10.37
PLS
Mall 3.16 4.1 110.7 110.9 51.97 65.77 16.97 20.94 53.4 61.05
UCSD 266.3 268.0 2.6 3.23 99.38 109.1 428.7 429.9 460.9 467.7
PETSview1 49.0 49.37 13.0 14.21 8.46 10.13 20.39 24.53 21.07 26.56
PETSview2 23.01 23.42 103.9 104.1 57.72 68.15 7.65 9.06 103.1 103.8
PETSview3 18.05 18.67 5.1 7.27 14.55 16.86 25.12 26.75 9.03 10.06
Table 3: Cross-scene MAE and RMSE of CNN-based methods trained on the multi-scene ShanghaiTech dataset. The best
result for each column is reported in bold.
Training set
Testing set
Mall UCSD PETSview1 PETSview2 PETSview3
(ShanghaiTech) MAE RMSE MAE RMSE MAE RMSE MAE RMSE MAE RMSE
MC
Part A 16.16 16.77 18.88 19.64 9.3 10.04 10.26 11.98 33.9 38.67
Part B 21.03 21.58 22.01 22.86 7.51 8.58 23.2 24.86 6.55 8.12
Cas.
Part A 17.71 18.33 21.0 21.84 8.51 9.39 10.36 11.92 33.46 40.68
Part B 13.92 14.6 22.26 23.02 10.32 11.38 17.95 19.89 9.61 12.39
DAN
Part A 16.76 17.32 23.96 24.67 8.88 10.21 14.49 16.56 15.68 16.68
Part B 18.02 18.64 22.82 24.01 8.93 10.71 19.19 22.03 20.13 21.11
SFCN
Part A 773.2 777.4 5.42 7.55 30.59 31.5 802.1 802.3 683.6 687.4
Part B 31.21 32.4 322.7 323.7 10.88 12.46 238.5 238.5 33.8 34.3
CSR
Part A 14.64 15.1 26.58 27.63 8.58 10.08 8.92 10.17 15.45 16.55
Part B 10.61 11.1 28.06 29.2 10.97 12.11 12.28 13.83 15.44 16.62
CAN
Part A 9.72 10.28 27.04 28.16 5.04 5.87 6.2 7.46 10.3 11.67
Part B 3.6 4.56 28.05 29.18 6.53 8.25 10.31 11.49 15.57 16.55
aim we simulated cross-scene scenarios by training
each model on one or more data sets, and then test-
ing it on a different, single-scene data set. Our re-
sults show that some of the existing CNN models can
achieve a relatively good performance also in cross-
scene scenarios, and that this happens when the tar-
An Empirical Evaluation of Cross-scene Crowd Counting Performance
379

get scene differs from the ones used for training only
in the background or in the lighting conditions, but
exhibit similar perspective and scale; their perfor-
mance is considerably worse when target and training
scenes significantly differ in perspective and scale,
instead. As a possible solution to improve cross-
scene effectiveness when no manually annotated data
from the target scene is available, and it is also dif-
ficult to obtain non-annotated data for unsupervised
domain adaptation methods, we envisage the use of
synthetic data sets reproducing the same perspective
of the target scene. We are currently investigating
this approach, and preliminary results can be found
in (Delussu et al., 2020).
As a final remark, the still large gap between
same- and cross-scene performance suggests to avoid
focusing future work on improving crowd counting
accuracy on benchmark data sets under same-scene
scenarios (somewhat according to the suggestions
given in (Torralba et al., 2011) for other computer vi-
sion tasks), and to address the efforts toward achiev-
ing a higher invariance in perspective and scale.
ACKNOWLEDGEMENT
This work was supported by the project “Law
Enforcement agencies human factor methods and
Toolkit for the Security and protection of CROWDs in
mass gatherings” (LETSCROWD), EU Horizon 2020
programme, grant agreement No. 740466.
REFERENCES
Chan, A. B., Liang, Z.-S. J., and Vasconcelos, N. (2008).
Privacy preserving crowd monitoring: Counting peo-
ple without people models or tracking. In IEEE
CVPR, pages 1–7.
Chen, K., Loy, C. C., Gong, S., and Xiang, T. (2012). Fea-
ture mining for localised crowd counting. In BMVC,
pages 1–11.
Delussu, R., Putzu, L., and Fumera, G. (2020). Investigating
synthetic data sets for crowd density estimation. In
VISAPP. In press.
Ferryman, J. and Shahrokni, A. (2009). Pets2009: Dataset
and challenge. In PETS, pages 1–6.
Li, Y., Zhang, X., and Chen, D. (2018). Csrnet: Dilated
convolutional neural networks for understanding the
highly congested scenes. In IEEE CVPR, pages 1091–
1100.
Liu, W., Salzmann, M., and Fua, P. (2019). Context-aware
crowd counting. In IEEE CVPR, pages 5099–5108.
Liu, X., van de Weijer, J., and Bagdanov, A. D. (2018).
Leveraging unlabeled data for crowd counting by
learning to rank. In IEEE CVPR.
Loy, C. C., Chen, K., Gong, S., and Xiang, T. (2013).
Crowd counting and profiling: Methodology and eval-
uation. In Modeling, simulation and visual analysis of
crowds, pages 347–382. Springer.
Marsden, M., McGuinness, K., Little, S., and O’Connor,
N. E. (2017). Resnetcrowd: A residual deep learning
architecture for crowd counting, violent behaviour de-
tection and crowd density level classification. In IEEE
AVSS, pages 1–7.
Onoro-Rubio, D. and L
´
opez-Sastre, R. J. (2016). Towards
perspective-free object counting with deep learning.
In ECCV, pages 615–629. Springer.
Ryan, D., Denman, S., Sridharan, S., and Fookes, C. (2015).
An evaluation of crowd counting methods, features
and regression models. Computer Vision and Image
Understanding, 130:1–17.
Sam, D. B., Sajjan, N. N., Maurya, H., and Babu, R. V.
(2019). Almost unsupervised learning for dense
crowd counting. In Association for the Advancement
of Artificial Intelligence.
Sindagi, V. and Patel, V. M. (2017a). A survey of recent
advances in cnn-based single image crowd counting
and density estimation. Pattern Recognition Letters,
107:3–16.
Sindagi, V. A. and Patel, V. M. (2017b). Cnn-based cas-
caded multi-task learning of high-level prior and den-
sity estimation for crowd counting. In IEEE AVSS,
pages 1–6.
Sindagi, V. A. and Patel, V. M. (2020). HA-CCN: hierar-
chical attention-based crowd counting network. IEEE
Trans. on Image Processing, 29:323–335.
Torralba, A., Efros, A. A., et al. (2011). Unbiased look at
dataset bias. In IEEE CVPR, pages 1521–1528.
Wang, Q., Gao, J., Lin, W., and Yuan, Y. (2019). Learning
from synthetic data for crowd counting in the wild. In
IEEE CVPR, pages 8198–8207.
Zhang, C., Li, H., Wang, X., and Yang, X. (2015). Cross-
scene crowd counting via deep convolutional neural
networks. In IEEE CVPR, pages 833–841.
Zhang, Q. and Chan, A. B. (2019). Wide-area crowd count-
ing via ground-plane density maps and multi-view fu-
sion cnns. In IEEE CVPR, page 8297–8306.
Zhang, Y., Zhou, C., Chang, F., and Kot, A. C. (2019). A
scale adaptive network for crowd counting. Neuro-
computing, 362:139–146.
Zhang, Y., Zhou, D., Chen, S., Gao, S., and Ma, Y. (2016).
Single-image crowd counting via multi-column con-
volutional neural network. In IEEE CVPR, pages 589–
597.
Zou, Z., Su, X., Qu, X., and Zhou, P. (2018). Da-net: Learn-
ing the fine-grained density distribution with defor-
mation aggregation network. IEEE Access, 6:60745–
60756.
VISAPP 2020 - 15th International Conference on Computer Vision Theory and Applications
380
