
Clustering of Physical Behaviour Profiles using Knowledge-intensive
Similarity Measures
Deepika Verma
1
, Kerstin Bach
1 a
and Paul Jarle Mork
2 b
1
Department of Computer Science, Norwegian University of Science and Technology, Trondheim, Norway
2
Department of Public Health and Nursing, Norwegian University of Science and Technology, Trondheim, Norway
Keywords:
Case-based Reasoning, Knowledge Intensive Similarity Measures, Physical Activity, K-Means.
Abstract:
In this paper, we reuse the Case-Based Reasoning model presented in our last work (Verma et al., 2018) to
create a new knowledge intensive similarity-based clustering method that clusters a case base such that the
intra-cluster similarity is maximized. In some domains such as recommender systems, the most similar case
may not always be the desired one as a user would like to find the closest, yet significantly different cases. To
increase the variety of returned cases, clustering a case base first, before the retrieval is executed increases the
diversity of solutions. In this work we demonstrate a methodology to optimize the cluster coherence as well
to determine the optimal number of clusters for a given case base. Finally, we present an evaluation of our
clustering approach by comparing the results of the quality of clusters obtained using our knowledge intensive
similarity-based clustering approach against that of the state-of-the-art K-Means clustering method.
1 INTRODUCTION
With the unprecedented growth in popularity of wear-
able activity trackers, acquiring reliable and objective
physical behaviour data from users over a long pe-
riod of time has become feasible. Activity trackers
provide objectively measured basic activity statistics
such as daily step count, miles run, heart rate among
others while some selective trackers additionally pro-
vide activity recommendations to help user stay active
throughout the day. While the validity and reliabil-
ity of the activity trackers remains a topic of research
(O’Driscoll et al., 2018), we conduct our research
on the very premise of physical behaviour measured
objectively, as opposed to self-reported (subjective)
and that shall be the point of departure for our work
ahead. Such objectively measured data present the
opportunity to identify groups of people (or clusters)
with similar physical behaviour (Marschollek, 2013;
Howie et al., 2018). Further, this may provide a foun-
dation for gaining new insights into the driving forces
of physical behaviour in a population.
Clustering methods provide a simple yet power-
ful way to reveal underlying structure of the data and
statistically understand the relationship between dif-
a
https://orcid.org/0000-0002-4256-7676
b
https://orcid.org/0000-0003-3355-2680
ferent data points. K-Means clustering (MacQueen,
1967) is one of the most commonly employed state-
of-the-art unsupervised machine learning method for
partitioning a given dataset into k clusters. Simple
similarity metrics are used for calculating the similar-
ity of the assigned cluster centroids to any given data
point in the dataset in order to determine the cluster
membership of each data point. The process repeats
until no more changes in the position of centroids are
observed. However, there are certain limitations to K-
Means. It has a tendency to overlook data complexity
(Yang et al., 2016) and moreover, is sensitive to out-
liers (Singh et al., 2011) and therefore can fail to give
meaningful clusters in presence of many outliers in
the dataset.
The challenge for most state-of-the-art clustering
methods is the use of knowledge poor similarity met-
rics or simple distance metrics such as Hamming dis-
tance and Euclidean distance, among others. These
metrics take into consideration only the syntactic dif-
ference between two data points, ignoring the coher-
ence of each attribute or variable of a data point, thus
leading to insufficient estimation of the similarity be-
tween them. In datasets where each variable takes on
a value within a specific range elicits a requirement
for modelling the local dependency for each variable.
The similarity metric used must allow the existing
knowledge to be brought to use for the assessment
660
Verma, D., Bach, K. and Mork, P.
Clustering of Physical Behaviour Profiles using Knowledge-intensive Similarity Measures.
DOI: 10.5220/0008980406600667
In Proceedings of the 12th International Conference on Agents and Artificial Intelligence (ICAART 2020) - Volume 2, pages 660-667
ISBN: 978-989-758-395-7; ISSN: 2184-433X
Copyright
c
2022 by SCITEPRESS – Science and Technology Publications, Lda. All rights reserved

of similarity between data points in a dataset. Sim-
ple distance metrics can render the clusters incoherent
in a complex dataset as opposed to cohesive clusters
wherein the data points within a cluster are more simi-
lar to each other than to data points in another cluster.
A solution to this problem can be formulated using
Case-Based Reasoning (CBR) (Aamodt and Plaza,
1994), which employs a more knowledge-driven ap-
proach. Focusing on the semantic similarity between
attributes rather than the syntactic similarity, the col-
lective influence of each variable’s importance on the
final (global) similarity score will improve the clus-
tering quality significantly by incorporating the ex-
isting knowledge in the dataset (Adam and Blockeel,
2015) and that CBR offers a more versatile approach
to handle clustering of complex datasets (M
¨
uller and
Bergmann, 2014).
In the sections that follow, we will use both
knowledge-intensive as well as knowledge-poor simi-
larity measures for cluster computation. We now hy-
pothesize in this paper that using knowledge-intensive
similarity measure as the metric for clustering the
cases in a case base would create clusters wherein the
cases within each cluster are semantically more sim-
ilar to each other than to cases in the other clusters.
The main contribution of this paper is a knowledge-
intensive similarity based clustering method that can
be used for any case base to compute clusters with
high intra-cluster similarity. For brevity sake, any
mention of the term similarity from this point on-
wards shall be taken as a reference to the knowledge-
intensive similarity, unless otherwise stated. The
terms have also been used interchangeably.
This paper is organized into sections as follows:
section 2 discusses the related work on similarity-
based clustering, section 3 presents the application
domain and elaborate on how similarity based clus-
tering can be applied to identify clusters of physi-
cal behaviour profiles from the objective physical be-
haviour data; section 4 is dedicated towards our sim-
ilarity based clustering algorithm; section 5 describes
the dataset we use to test our algorithm; section 6
presents a set of experiments to evaluate our clus-
tering approach, followed by section 7 discusses and
conclude our work.
2 RELATED WORK
Application of clustering methods has played a ma-
jor role in discovering the underlying patterns in pub-
lic health data sets and understanding the character-
istic differences among clusters. Identifying differ-
ent clusters of similar physical behaviour patterns is
similarly pivotal in understanding the physical activ-
ity characteristics of a population and will facilitate
identification of different physical behaviour pheno-
types
1
. Clustering has been previously applied by
(Marschollek, 2013) on objectively measured physi-
cal behaviour data to identify four activity phenotypes
using regularity, duration and intensity of activities
as the pivotal attributes. Similar to their work, we
aim at applying clustering, albeit knowledge inten-
sive similarity-based, on objectively measured phys-
ical behaviour data to identify phenotypes. Using
a more probabilistic approach, (Howie et al., 2018)
identified five activity phenotypes for each gender us-
ing sex-specific latent class analysis. Although our
approach differs from the one taken in their work, our
long term goals and the target data are quite similar.
Similar to the self-efficacy based activity recom-
mendation approach adopted by (Baretta et al., 2019)
to promote physical activity among adults, we aim
to underpin activity recommendations based on the
activity profile-assessed efficacy using a case-based
approach in order to promote achievement of rec-
ommended physical activity goals
2
. A case-based
marathon profile recommendation approach has been
presented by Smyth and Cunningham in (Smyth and
Cunningham, 2017) to help marathon runners achieve
their personal best. Using a different approach for
improving the similarity-based retrievals in CBR,
(M
¨
uller and Bergmann, 2014) presents a cluster-
based indexing approach to make retrieval of most
similar cases more efficient. While they use the sim-
ilarity measure to construct a hierarchical cluster-tree
which is used as an index for efficient retrieval, we use
the similarity measure to create the clusters which can
then be used as an index for retrieving relevant cases.
(Lucca et al., 2018) presents a framework for devel-
oping an index on clustered cases for improving query
accuracy in agent simulation systems and making re-
trieval of relevant cases more efficient by organizing a
large case base into smaller sub-case bases. Similarly,
(Cunningham, 2009) introduces using similarity as a
valid measure for selective sampling and generating
solutions for unlabelled cases in clustered case bases.
Furthermore, (Fanoiki et al., 2010) presented a
cluster-based approach which facilitates the identifi-
cation of relevant cases for a given query problem by
considering the similarity relation among the cases
within the case base with respect to their problem
space as well the solution space. Their guiding princi-
ple being that the solutions of the most similar cases
are likely to be similar if their problem descriptions
1
www.sciencedirect.com/topics/neuroscience/phenotype
2
https://www.who.int/ncds/prevention/physical-
activity/guidelines-global-recommendations-for-health/en/
Clustering of Physical Behaviour Profiles using Knowledge-intensive Similarity Measures
661

are also similar. They formulate the solution by first
selecting the cluster with the most similar problem de-
scription and then adapting the solution of the cases
within that cluster. This is similar to what we intend to
achieve for recommending activity goals. The under-
taken approach in (Fanoiki et al., 2010) is somewhat
similar to the selective case sampling approach pre-
sented in (Wiratunga et al., 2003) wherein they show
how unlabelled cases can be labelled with solutions
by clustering similar unlabelled problems within the
case base, which can then be labelled with solutions
by the expert.
3 CLUSTERS OF PHYSICAL
BEHAVIOUR PROFILES
Real-time activity tracking and systematic physical
activity recommendations remind users to help them
stay active throughout the day. This is especially use-
ful for sedentary individuals(Lagersted-Olsen et al.,
2013). Prolonged uninterrupted bouts of sedentary
behaviour are known to be detrimental to health
(Saunders et al., 2012). In addition to the type of
physical activity, the intensity of the moderate to vig-
orous activity performed also has an impact on the
overall health outcomes (Ekelund et al., 2019).
The importance of enough sedentary behaviour
has also been acknowledged (Coenen et al., 2018)
since both high as well as low ends of the activity
spectra are necessary in the right balance in order to
promote good health. However, the existing state-
of-the-art trackers provide approximately the same
recommendations with slight variation to every user.
Recommending activity goals to an individual which
are challenging, yet achievable is more beneficial for
improving their health as opposed to recommending
either unachievable or not challenging enough activ-
ity goals (Baretta et al., 2019). Using an example
from our dataset, we demonstrate how a CBR system
can be used to identify unique clusters of physical be-
haviour profiles and how evidence-based experience
of other similar profiles can be used to underpin ac-
tivity recommendations for an individual.
Suppose we identify four clusters of physical be-
haviour profiles, as shown in figure 1 (we use a small
subset of the original dataset for clarity in the visu-
alization), in our dataset (see section 5. The aim is
to provide a user a diverse set of adapted most sim-
ilar profiles from other clusters as recommendations,
ranked by their similarity (such that lower similarity
indicates more challenging goal). For instance, to rec-
ommend activity goals to case 20, the system can se-
lect one most similar case from each cluster other than
Figure 1: Example: A potential set of similarity-based clus-
ters and how they can be utilised to recommend achievable
activity goals to a user. The x-axis and y-axis show total
sedentary duration and active duration (in minutes), respec-
tively, over a period of six days.
its’ member cluster and return the set of adapted pro-
files ranked by similarity to offer a diverse set of op-
tions for the user to choose their goal from. The most
similar profile, case 67 appears to be a challenging as
well as an achievable goal for case 20. Therefore, it
might be advisable for case 20 to try and get closer to
the adapted activity profile of case 67 if they wish to
challenge themselves while at the same time achieve
the recommended activity goals. Similarly for case
85, case 12 appears to be a challenging and achievable
goal. Therefore, in this case, it might be advisable for
case 85 to try and get closer to the adapted activity
profile of case 12 in order to become more physically
active.
Large and complex datasets such as the objective
measurements for the HUNT4
3
(see section 5) study
require pre-processing and organization of the case
base to improve the overall performance of a CBR
system. We address this topic by identifying unique
clusters of different physical behaviour within the
HUNT4 dataset using our similarity-based clustering
method. We direct our attention solely towards under-
standing the behavioural characteristics of a sample
population that contribute to differences in physical
activity and sedentary behaviour which could allow
for designing improved recommendations tailored to
each phenotype for an innovative, yet effective active
lifestyle management intervention. To elicit greater
improvements in the existing infrastructure of activity
recommendations, radical shift in the use and applica-
tion of the existing methodologies may be required.
3
https://www.ntnu.no/hunt4
ICAART 2020 - 12th International Conference on Agents and Artificial Intelligence
662

4 KNOWLEDGE INTENSIVE
SIMILARITY BASED
CLUSTERING
Unsupervised machine learning methods provide a
way of inferring underlying patterns or structure in
a given dataset without any reference to known out-
comes and therefore, is a viable option for our prob-
lem. We have a dataset consisting of 9034 physical
behaviour profiles and look for clusters that represent
meaningful physical behaviour types. Each cluster
should be semantically coherent. While the state-of-
the-art clustering methods such as K-means do pro-
vide a set of clusters, the profiles within each cluster
are not guaranteed to be very semantically similar to
each other since these methods use knowledge-poor
similarity measures or simple distance measures.
As we have shown in our previous work (Verma
et al., 2018), CBR outperforms the k-NN method in
finding the most similar physical behaviour profiles.
We therefore use the similarity score as the measure
for clustering the profiles in our dataset. Our approach
for using similarity as the metric for clustering ex-
tends the conventional approach of similarity in CBR
by allowing to model and further utilize the similar-
ity measures which are aligned with domain expert
knowledge. Algorithm 1 introduces the knowledge
intensive similarity-based clustering algorithm used
in our work.
Algorithm 1: Knowledge Intensive Similarity-
based Clustering Algorithm.
Input : case base C, number of clusters n
Output: n clusters
initialization: assign n random cases as
centroids-{c
n
}
Determine Cluster Membership
for each case k in C do
compute sim(k,c
j
), ∀j ∈ 1, ..., n
assign k to most similar centroid
end
Update Cluster Centroids
for each c
j
in {c
n
} do
compute meanSim
j
=
1
|S
j
|
∑
∀k
i
∈S
j
sim(k
i
, c
j
)
find case m in S
j
such that
sim(m,c
j
) ≈ meanSim
j
assign m as the new centroid c
j
end
Repeat until centroids converge
S
j
denotes the set of cases in cluster c
j
.
The algorithm initially assigns n cases as centroids
at random and then computes the clusters using the
similarity score of each case to each centroid. As
the similarity-based clustering method operates on the
similarity score between each case and each centroid
to determine its’ cluster membership, it is indepen-
dent of the data type. As a result, one advantage of
this method is that it can be applied to different types
of data sets other than just numerical, for example cat-
egorical or mixed datasets, which otherwise proves
to be challenging when using the conventional clus-
tering methods. Once the similarity measures are in
place, the user is freed from the trouble of taking care
of the data types before applying this knowledge in-
tensive similarity-based clustering method.
5 DATASET
The data set used in this work is the objectively
measured physical activity data collected during the
fourth round of the HUNT
4
cohort study. The data
collection in HUNT4 spanned over 18 months and
was finished in February 2019. Each person who vol-
unteered to participate in the objective physical ac-
tivity data collection was fitted with two tri-axial ac-
celerometers, AX3 Axivity
5
, one on the lower back
and another on the thigh and wore them for a period
of seven consecutive days. Objective measurements
of a total of 35449 participants have been collected
and basic physical activities have been assigned (see
Table 1).
Table 1: Activity Descriptions.
Activity Description
Lying The person is lying down
Sitting When the person’s buttocks is on the
seat of a chair or something similar
Standing Upright, feet supporting the person’s
body weight
Walking Locomotion towards a destination with
one or more strides
Running Locomotion towards a destination, with
at least two steps where both feet leave
the ground during each stride
Cycling The person is riding a bicycle
Before populating the CBR system, we pre-
process the data to obtain the same amount of data
per participant. Therefore we decided to only include
participants who have full six days of measured data.
Furthermore, we remove any record containing zero
minutes for lying, standing, sitting and less than one
minute for walking activity as well as records where
the sum of all activities exceeds 1440 minutes for a
day (which represents the total minutes in a day). Due
4
https://www.ntnu.no/hunt
5
https://axivity.com/downloads/ax3
Clustering of Physical Behaviour Profiles using Knowledge-intensive Similarity Measures
663
to various reasons (discomfort, sensor failure, loss or
removal of sensor), this reduces our dataset to 31113
participants, out of which we randomly sample 9034
participants while maintaining the overall distribution
of activities for our experimental evaluation. Figure
2 shows the distribution of the six activities in the
dataset.
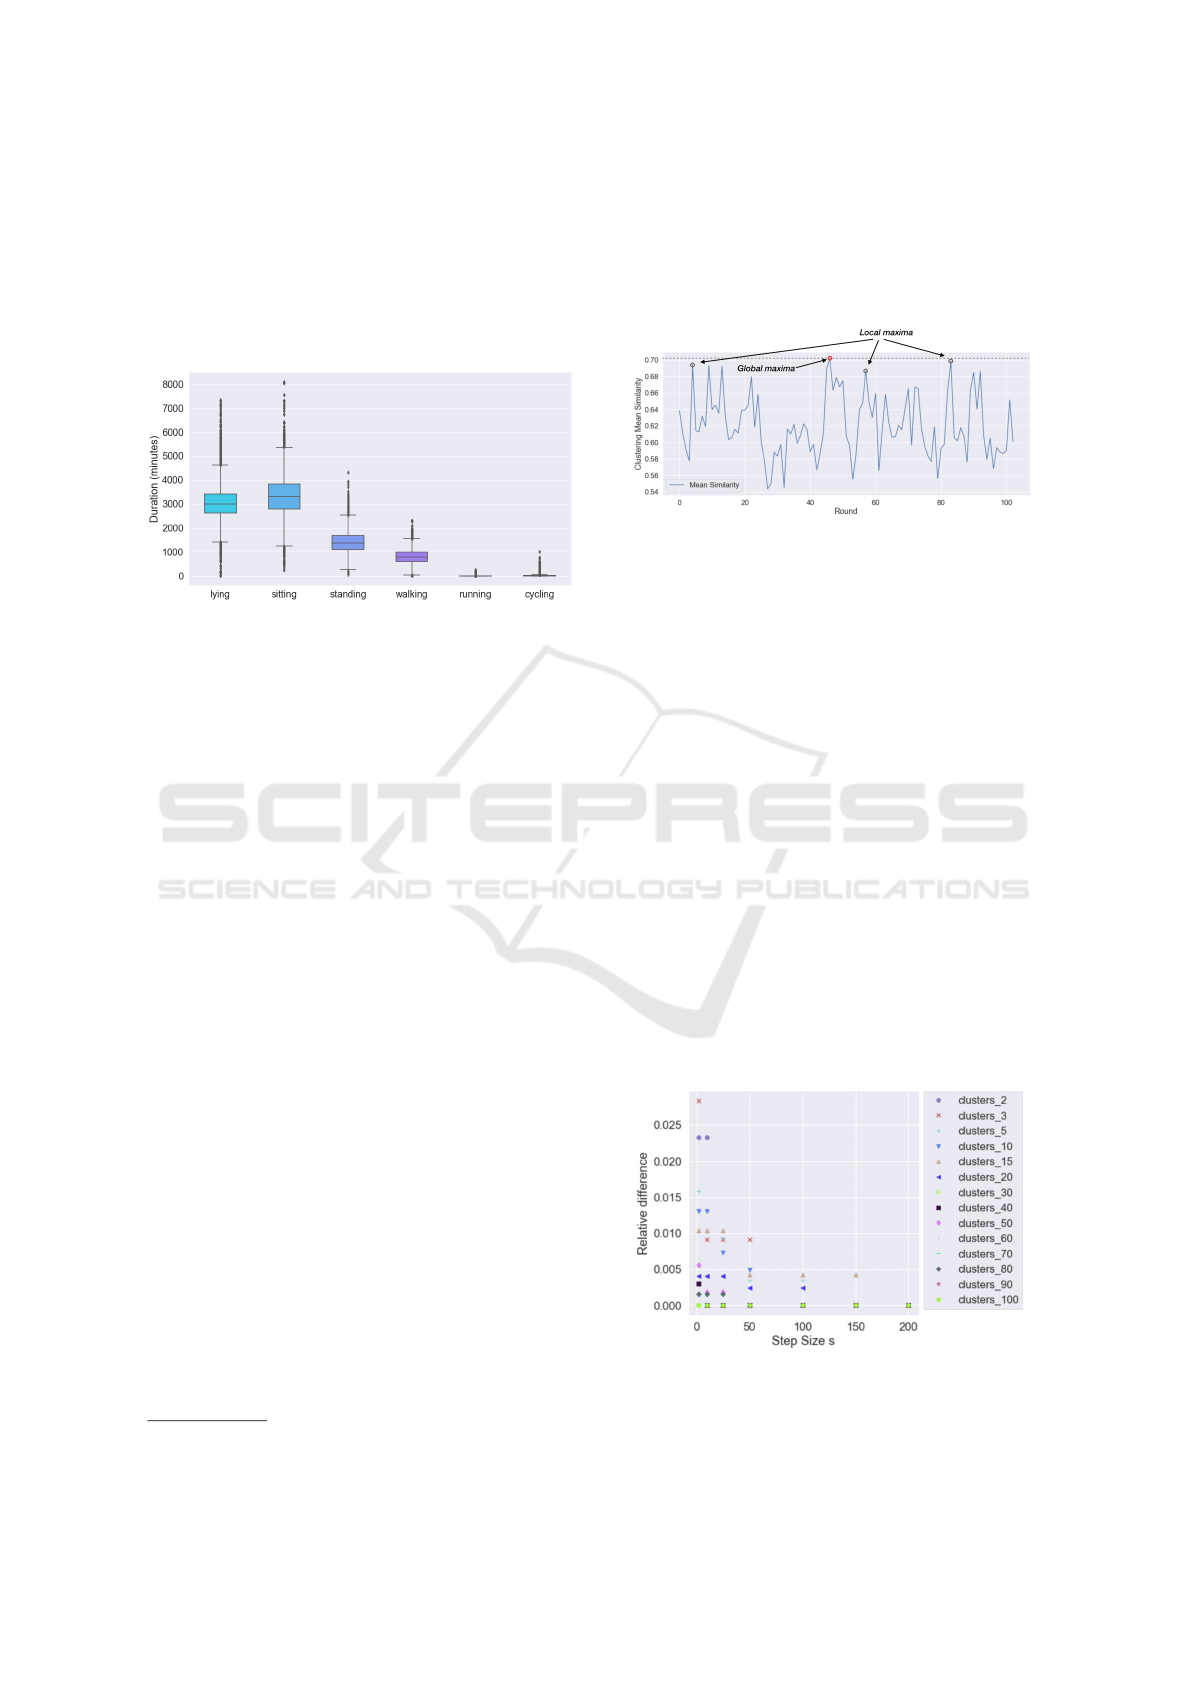
Figure 2: Summary of test dataset (9034 participants): Dis-
tribution of minutes spent per activity category over a period
of six days.
6 EXPERIMENTAL EVALUATION
We implemented the knowledge intensive similarity-
based clustering algorithm in Java (version 1.8) using
the java implementation of myCBR tool
6
. The CBR
model for our dataset has been created in the myCBR
workbench (Stahl and Roth-Berghofer, 2008) by im-
porting the data from a csv file. Similarity modelling
of each activity attribute has been carried out in the
same data-driven manner as we have presented in our
last work (Verma et al., 2018). We then used the CBR
model in our java implementation of the algorithm to
compute any desired number of clusters.
6.1 Coherent Clusters
A new set of centroids in the knowledge intensive
similarity-based clustering algorithm may or may not
give better mean similarity of clusters than the previ-
ous centroids. We can observe in figure 3, the mean
similarity of clusters varies to a large degree with each
progressive round of clustering, wherein each round
represents a new set of centroids. These variations
occur due to change in cluster membership of the
cases. As the membership of cases in the case base
evolves over several rounds, the movement of cases,
especially the edge cases from one cluster to another
may result in increase in the mean similarity of the
exiting cluster and decrease in that of the joining clus-
6
https://github.com/ntnu-ai-lab/mycbr-sdk
ter or vice-versa, thereby introducing positive as well
as negative variations in the cluster mean similarity.
These variations make it challenging to determine the
optimal centroids and clusters at any given point in
the algorithm.
Figure 3: Variation in average similarity of ten clusters over
multiple rounds.
Direct optimization of similarity-based clustering
is an NP-hard problem (Yang et al., 2016). To over-
come this challenge, we employ a strategy where the
algorithm looks s steps or rounds to the future to
check if it finds a set of centroids with a higher mean
similarity than the current set of centroids. It declares
convergence only when it does not find any new set
of centroids with a higher mean similarity than the
current maximum mean similarity after s steps. The
objective now is to determine the step size s. It can
be observed in figure 3 that the mean similarity un-
dergoes considerable amount of variation over mul-
tiple rounds. Therefore, s must be set large enough
to foresee enough number of rounds before declaring
convergence, but small enough to be computationally
inexpensive for large datasets. The hypothesis here is
that the probability of falling into a local maxima is
less if the step size s is large enough to accommodate
the variation observed in the mean similarity of clus-
ters over multiple rounds, wherein each round con-
sists of a new set of centroids.
Figure 4: Relative difference in the mean similarity of clus-
ters with the step size s for number of clusters n in the range
[2,100]: The y-axis of the graph represents the difference
between the maximum mean similarity and mean similarity
achieved at s, displayed by the x-axis, for each n.
ICAART 2020 - 12th International Conference on Agents and Artificial Intelligence
664
We can observe in the figure 4, with the increase
in the number of clusters, there is a decrease in the
difference between the mean similarity achieved at
any given s and the maximum mean similarity. This
indicates an inverse relation between step size s and
the number of clusters n. The value of s may differ
depending on the size of the dataset and the number
of clusters chosen, however, for our dataset, s = 50
seems to give a fair trade-off between time complex-
ity and cluster coherency.
6.2 Number of Clusters
Clustering allows you to split a given data set into
clusters according to a similarity metric, but one must
specify the desired number of clusters in advance. De-
termining the optimal number of clusters in unsuper-
vised clustering is a fundamental challenge and can
be a daunting task. One way to determine the op-
timal number of clusters in K-Means is the elbow
method, which involves plotting the sum of squared
errors (SSE) against the number of clusters. As SSE
decreases with the increase in number of clusters, the
optimal number of clusters is observed by noting the
elbow in the graph. In our case however, as we are op-
erating on the mean similarity of clustering which is
expected to increase with the increase in the number
of clusters, we will have a reverse elbow graph.
To determine the optimal number of similarity
clusters we plot the mean similarity of clusters
against the number of clusters. With s = 50, we
computed n clusters in the range [2,100] in order
to learn the optimal number for our dataset. Five
epochs were computed with n randomly chosen cases
as initial centroids, wherein each epoch consists of
reassignment of cases and recomputing the centroids
until the clusters converge. Afterwards, an average
was computed from the mean similarity values of all
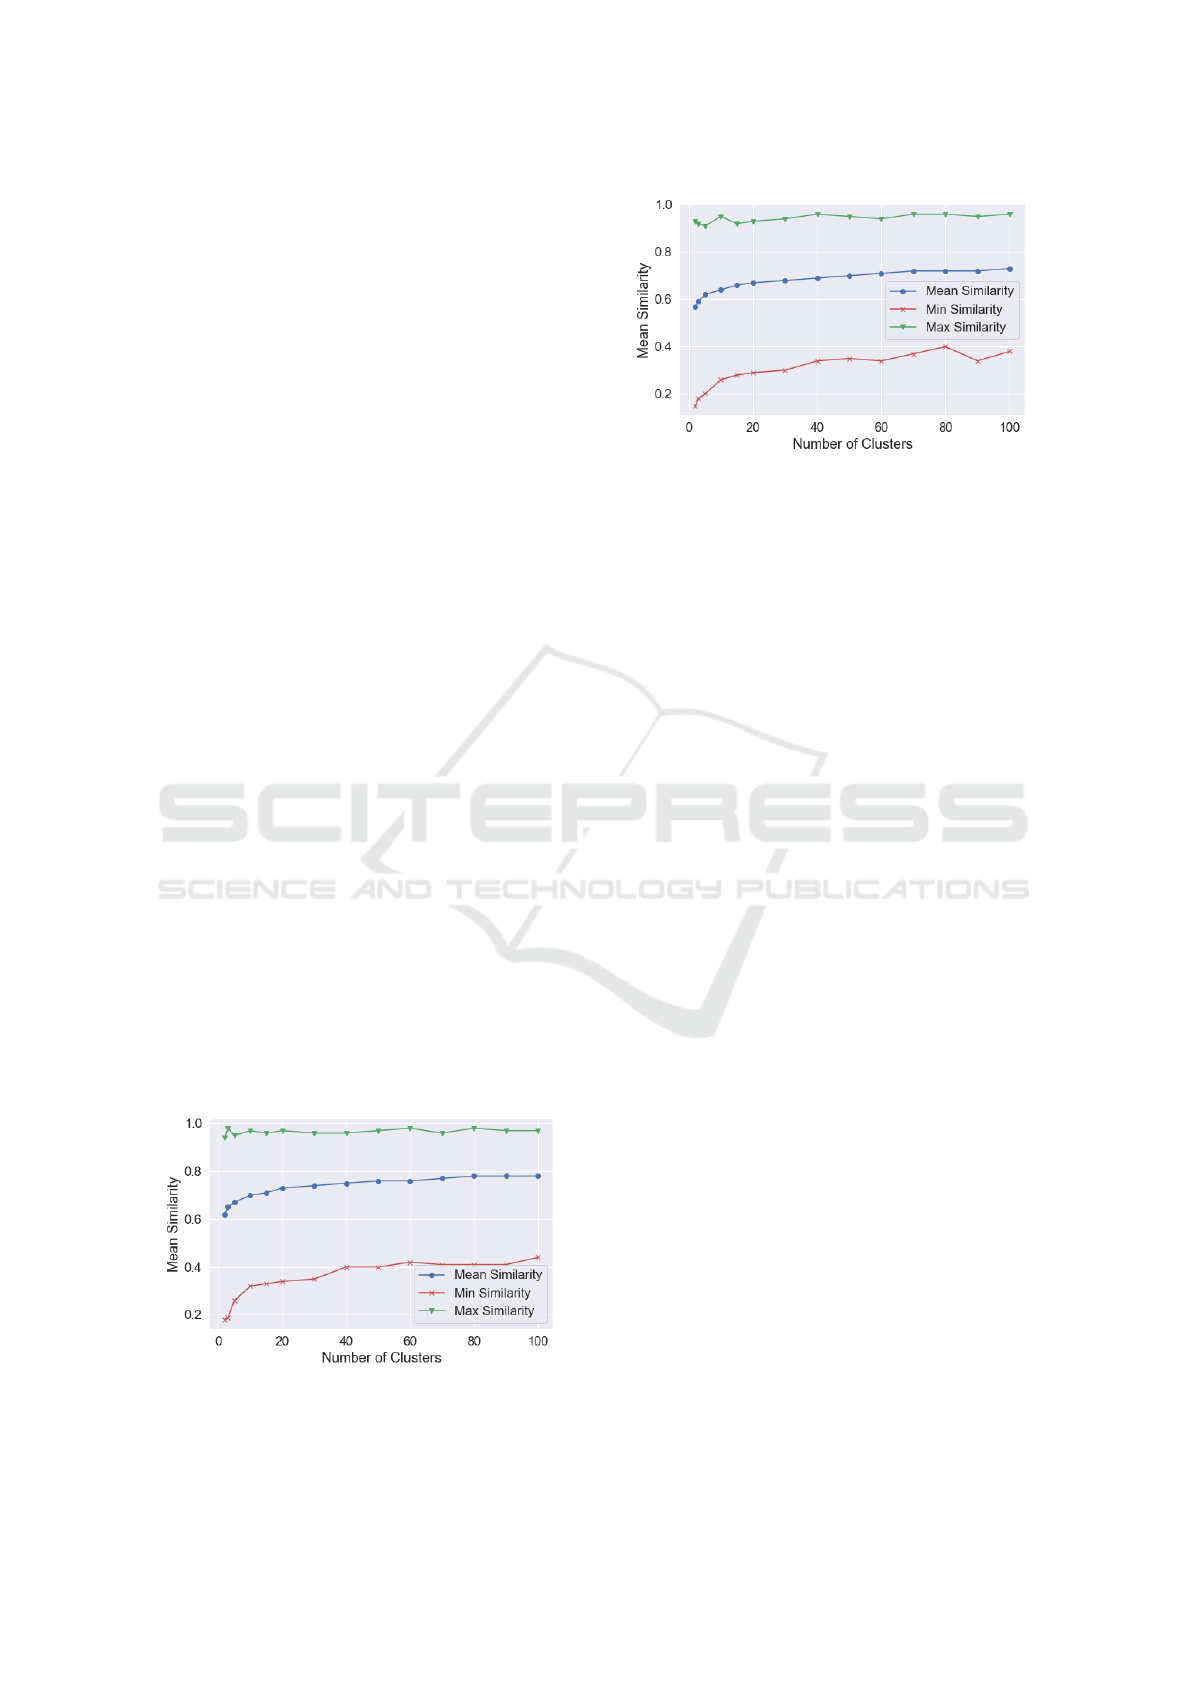
the five epochs. The results are shown in figure 5,
Figure 5: Similarity within clusters for the knowledge in-
tensive, similarity-based clustering(step size s = 50).
Figure 6: Similarity within clusters for the K-Means clus-
tering method.
where it can be observed that the mean similarity
increases gradually until 20 clusters, followed by a
slow but steady increase. This indicates the maxi-
mum optimal number of clusters for our dataset is 20
or less. We need a more detailed analysis in order
to uniquely identify the different phenotype clusters
from our dataset and aim at achieving this goal using
similarity-based clustering.
6.3 Assessment of Cluster Quality
We now evaluate the quality of the computed clus-
ters within our dataset using our similarity-based clus-
tering approach. We present an evaluation by com-
paring the performance of the proposed similarity-
based clustering method with that of state-of-the-art
K-Means clustering method. The implementation of
K-Means clustering algorithm was done using Scikit
Learn library (Pedregosa et al., 2011) in Python (ver-
sion 3.6.3).
For comparing the results for both methods, we
needed a common metric to base the comparison on.
Since our aim is to have clusters with high degree of
intra-cluster similarity, we decided to take the mean,
minimum and maximum similarity as the metric for
comparing the methods. However, K-Means does
not compute semantic similarity between two given
data points. To overcome this hurdle, we imple-
mented a Rest API function in the myCBR java pack-
age which allows us to compute the similarity of any
two given cases, provided that the attribute values are
within their respective range as defined in the CBR
model. We then used POST calls to calculate the
similarity between each case and its cluster centroid
for each cluster obtained using K-Means implemen-
tation. Five epochs were computed for both K-Means
and similarity-based clustering methods. Each epoch
consisted of reassignment of cases and recomputing
the means until the clusters converge. An average was
then computed of all the five epochs. The number of
Clustering of Physical Behaviour Profiles using Knowledge-intensive Similarity Measures
665
clusters n computed in each epoch were in the range
[2,100].
Figures 5 and 6 show the minimum and maximum
similarity for all the clusters in addition to the mean
similarity for both similarity-based clustering and K-
Means clustering. It can be observed from the results
that the mean similarity and the minimum similarity
for each number of clusters n are higher in similarity-
based clustering, however there is not much differ-
ence in the maximum similarity. To further verify the
difference in the results obtained by our algorithm and
K-Means, we performed a t-test at significance level
α = 0.01 and α = 0.05 for the mean similarity val-
ues of the clusters obtained using both the methods.
The result is: t-value = 2.87, p-value= 0.008; which
is significant at both α.
Although the measurable difference between re-
sults obtained using K-Means and similarity-based
clustering appears to be small, the t-test results show
that the results obtained are significantly different.
Moreover, the difference lies in the quality of the clus-
ters obtained using both the methods. As stated pre-
viously, our objective in this work has been to cre-
ate clusters wherein the cases within each cluster are
more similar to each other than to cases in other clus-
ters. In other words, if we were to query for m similar
cases for a particular case, say Participant 8921, we
would expect the most similar cases to be in the same
cluster as the queried case rather than in some other
cluster(s), except perhaps for the edge cases. We can
examine this by querying the case base in the myCBR
workbench and then verifying the cluster labels of the
m most similar cases in the clusters obtained using
both K-Means and similarity-based clustering meth-
ods. We choose n = 20 and make retrievals using two
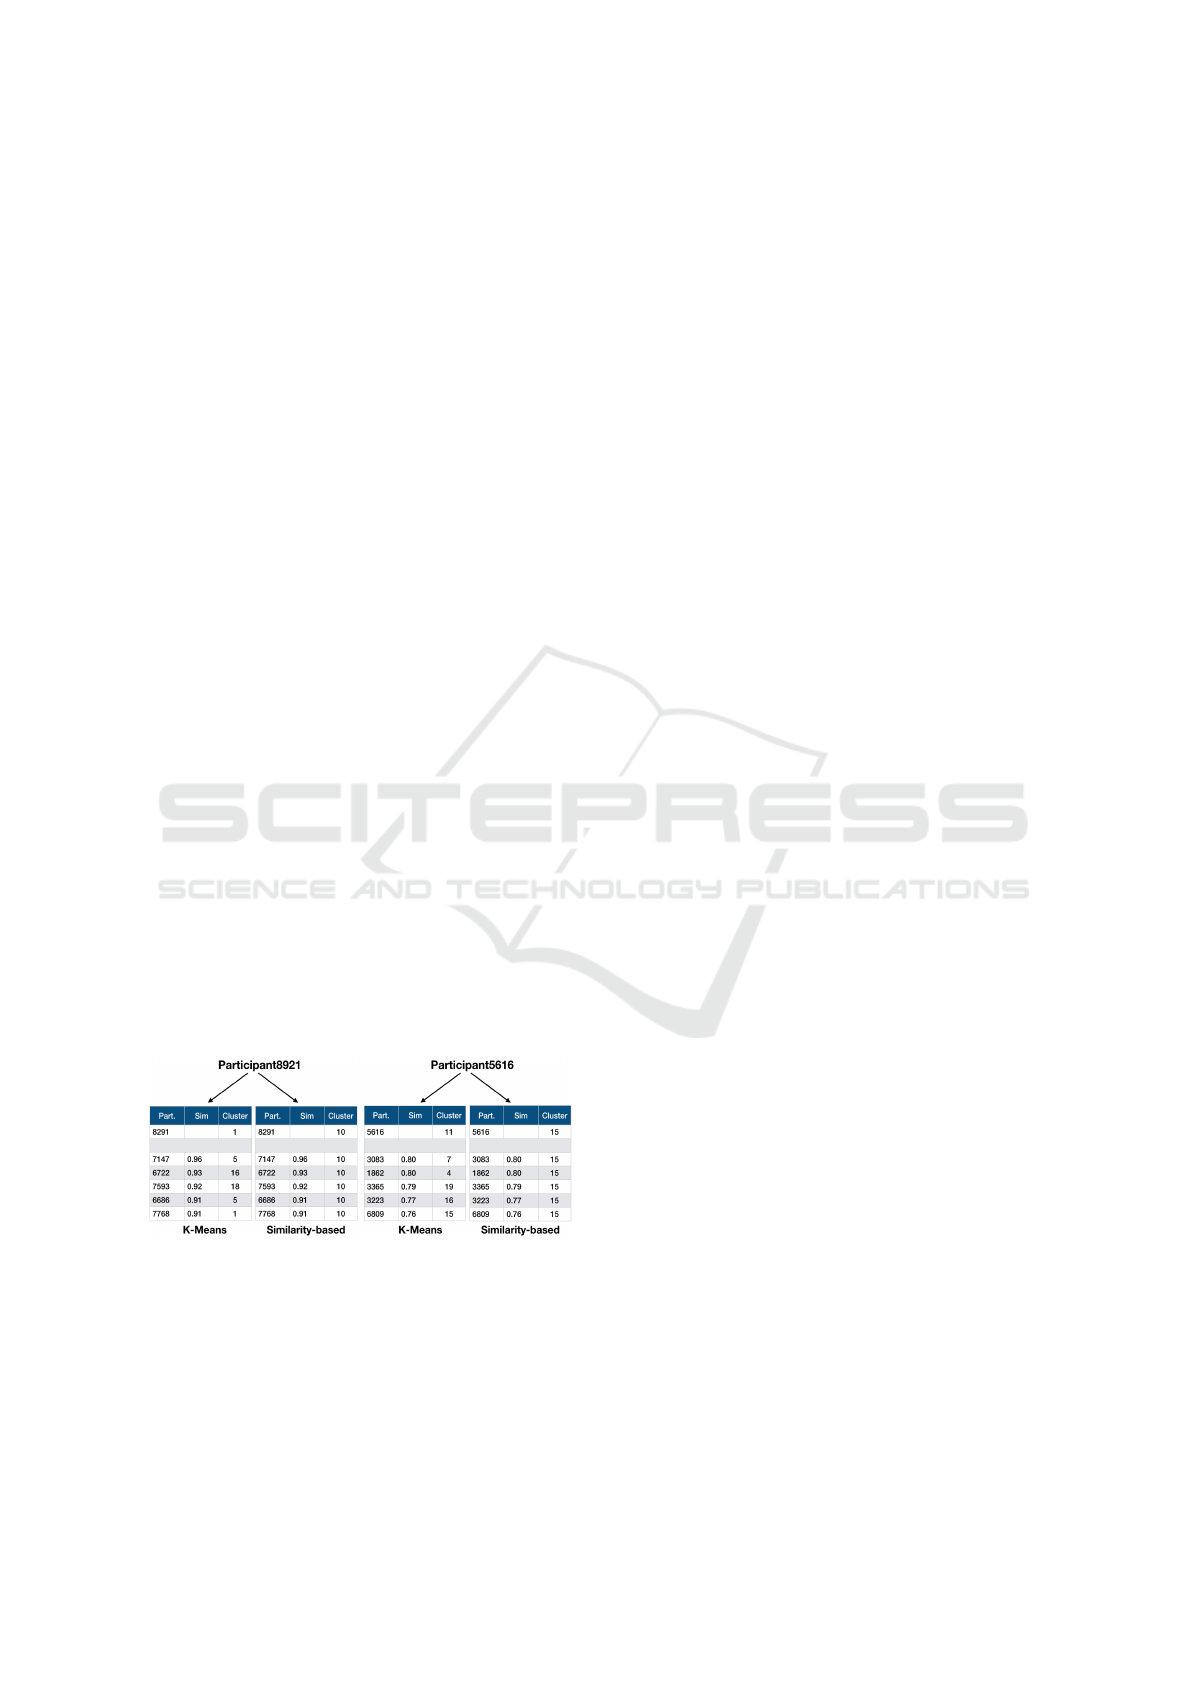
randomly chosen cases with m = 6. Figure 7 presents
the results.
Figure 7: Examples showing the quality of clusters for k-
Means vs similarity-based clusters. [Part.: Participant, Sim:
Similarity].
Taking as reference the top most record, which is
the queried case itself, we can now compare and con-
trast the difference in the quality of the clusters ob-
tained using both the methods. In both the examples,
the most similar cases in the similarity-based clusters
are placed in the same cluster. On the other hand,
most of the similar cases are placed in different clus-
ters in the K-Means clusters. The examples presented
in figure 7 support our hypothesis that the quality of
clusters achieved using our approach is much supe-
rior.
7 DISCUSSION & CONCLUSION
In this paper, we have presented a clustering algo-
rithm which uses knowledge intensive similarity as
the metric for computing clusters in a case base. We
presented an evaluation using the clustering method
in a CBR application built for the HUNT4 physical
behaviour dataset. The method computes clusters and
demonstrates how coherent clusters can be obtained
using an optimization strategy (see section 6.1). The
experimental results shown in figures 5 and 6 along
with the examples presented in figure 1 inevitably
demonstrate the coherence as well as the diversity of
the clusters obtained using our similarity-based clus-
tering approach. As stated previously, the conven-
tional clustering methods such as K-Means have cer-
tain limitations which can be overcome using CBR.
K-Means tends to overlook the complexity of the data
and puts emphasis on the attributes which have a dom-
inant presence in the data (such as lying) while ig-
noring the smaller (such as running) but significant
attributes. While a small-scale change in the small
attributes may not result in a very large difference in
the similarity score, it can however change the order
of the similar cases. And thus, even though the cases
in each K-Means cluster have a fairly high similarity
to their cluster centroid, they are not necessarily very
similar to each other.
We have demonstrated experimentally the clus-
ters obtained using our similarity-based clustering ap-
proach have higher intra-cluster similarity amongst
the cases as opposed to the clusters obtained using
the state-of-the-art K-Means clustering method. The
difference in the results obtained has been found to
be statistically significant. Therefore, it is safe to
conclude that our hypothesis is correct and the pro-
posed similarity-based clustering algorithm provides
better clusters than the K-Means clustering method.
The proposed algorithm is a suitable and viable op-
tion for our application and gives the desired coher-
ent clusters. The proposed similarity-based clustering
method can nevertheless be applied to other datasets
as well, including mixed datasets since the method is
independent of the data types.
In future, we will investigate the physical be-
haviour profiles in more detail and use sequential
ICAART 2020 - 12th International Conference on Agents and Artificial Intelligence
666

physical behaviour data for clustering profiles by
adding on information such as the intensity, frequency
and duration of the activity bouts. The guidelines on
physical activity make it evident that there is a ne-
cessity to develop recommendations that address the
links amongst the type, duration, intensity, frequency
and the total amount of physical activity necessary
to be done by an individual in order to prevent non-
communicable diseases and general health issues. We
will extend our work to address this challenge by us-
ing similarity-based clustering to determine more spe-
cialized clusters and attempt to steer towards identify-
ing the physical behaviour phenotypes in our dataset.
REFERENCES
Aamodt, A. and Plaza, E. (1994). Case-based reasoning:
Foundational issues, methodological variations, and
system approaches. Artificial Intelligence Communi-
cations, 7(1).
Adam, A. and Blockeel, H. (2015). Dealing with overlap-
ping clustering: A constraint-based approach to algo-
rithm selection. CEUR Workshop Proceedings, 1455.
Baretta, D., Sartori, F., Greco, A., D’Addario, M., Melen,
R., and Steca, P. (2019). Improving physical activ-
ity mhealth interventions: Development of a computa-
tional model of self-efficacy theory to define adaptive
goals for exercise promotion. Advances in Human-
Computer Interaction, 2019.
Coenen, P., Willenberg, L., Parry, S., Shi, J. W., Romero, L.,
Blackwood, D. M., Maher, C. G., Healy, G. N., Dun-
stan, D. W., and Straker, L. M. (2018). Associations
of occupational standing with musculoskeletal symp-
toms: a systematic review with meta-analysis. British
Journal of Sports Medicine, 52(3).
Cunningham, P. (2009). A taxonomy of similarity mecha-
nisms for case-based reasoning. IEEE Trans. Knowl.
Data Eng., 21.
Ekelund, U., Brown, W. J., Steene-Johannessen, J., Fager-
land, M. W., Owen, N., Powell, K. E., Bauman, A. E.,
and Lee, I.-M. (2019). A systematic review and har-
monised meta-analysis of data from 850 060 partici-
pants. British Journal of Sports Medicine, 53(14).
Fanoiki, T. O., Drummond, I., and Sandri, S. A. (2010).
Case-based reasoning retrieval and reuse using case
resemblance hypergraphs. In International Confer-
ence on Fuzzy Systems.
Howie, E. K., Smith, A. L., McVeigh, J. A., and Straker,
L. M. (2018). Accelerometer-derived activity pheno-
types in young adults: a latent class analysis. Interna-
tional Journal of Behavioral Medicine, 25(5).
Lagersted-Olsen, J., Korshøj, M., Skotte, J., Carneiro, I. G.,
Søgaard, K., and Holtermann, A. (2013). Comparison
of objectively measured and self-reported time spent
sitting. International journal of sports medicine, 35 6.
Lucca, M. R. B., Junior, A. G. L., de Freitas, E. P., and Silva,
L. A. L. (2018). A case-based reasoning and clus-
tering framework for the development of intelligent
agents in simulation systems. In FLAIRS, Florida.
MacQueen, J. (1967). Some methods for classification and
analysis of multivariate observations. Berkeley, Calif.
University of California Press.
Marschollek, M. (2013). A semi-quantitative method to de-
note generic physical activity phenotypes from long-
term accelerometer data – the atlas index. PLOS ONE,
8(5).
M
¨
uller, G. and Bergmann, R. (2014). A cluster-based
approach to improve similarity-based retrieval for
process-oriented case-based reasoning. ECAI’14. IOS
Press.
O’Driscoll, R., Turicchi, J., Beaulieu, K., Scott, S., Matu,
J., Deighton, K., Finlayson, G., and Stubbs, J. (2018).
How well do activity monitors estimate energy expen-
diture? a systematic review and meta-analysis of the
validity of current technologies. British journal of
sports medicine.
Pedregosa, F., Varoquaux, G., Gramfort, A., Michel, V.,
Thirion, B., Grisel, O., Blondel, M., Prettenhofer, P.,
Weiss, R., Dubourg, V., Vanderplas, J., Passos, A.,
Cournapeau, D., Brucher, M., Perrot, M., and Duch-
esnay, E. (2011). Scikit-learn: Machine learning in
Python. Journal of Machine Learning Research, 12.
Saunders, T. J., Larouche, R., Colley, R. C., and Tremblay,
M. S. (2012). Acute sedentary behaviour and markers
of cardiometabolic risk: a systematic review of inter-
vention studies. Journal of nutrition and metabolism.
Singh, K., Malik, D., and Sharma, N. (2011). Evolving
limitations in k-means algorithm in data mining and
their removal. International Journal of Computational
Engineering and Management, 12.
Smyth, B. and Cunningham, P. (2017). Running with cases:
A cbr approach to running your best marathon. In
Aha, D. W. and Lieber, J., editors, CBR Research and
Development, Cham. Springer.
Stahl, A. and Roth-Berghofer, T. R. (2008). Rapid proto-
typing of cbr applications with the open source tool
mycbr. In ECCBR ’08. Springer-Verlag.
Verma, D., Bach, K., and Mork, P. J. (2018). Modelling
similarity for comparing physical activity profiles - a
data-driven approach. In Cox, M. T., Funk, P., and
Begum, S., editors, CBR Research and Development,
Cham. Springer.
Wiratunga, N., Craw, S., and Massie, S. (2003). Index
driven selective sampling for cbr. In Ashley, K. D.
and Bridge, D. G., editors, CBR Research and Devel-
opment. Springer.
Yang, Z., Cor, J., er, and Oja, E. (2016). Low-rank doubly
stochastic matrix decomposition for cluster analysis.
Journal of Machine Learning Research, 17(187).
Clustering of Physical Behaviour Profiles using Knowledge-intensive Similarity Measures
667
