
Investigating the Semantic Perceptual Space of Synthetic Textures on an
Ultrasonic based Haptic Tablet
Maxime Dariosecq
1
, Patricia Pl
´
enacoste
1
, Florent Berthaut
1
, Anis Kaci
2
and Fr
´
ed
´
eric Giraud
2
1
CRIStAL, CNRS, University of Lille, France
2
L2EP, University of Lille, France
Keywords:
Haptic Feedback, Tactile Device, Ultrasonic Vibrations, Perceptual Space, Material Perception, Texture
Rendering.
Abstract:
This paper aims to investigate the semantic perceptual space of synthetic tactile textures rendered via an
ultrasonic based haptic tablet and the parameters influencing this space. Through a closed card sorting task,
30 participants had to explore 32 tactile-only textures and describe each texture using adjectives. A factorial
analysis of mixed data was conducted. Results suggest a 2 dimensional space with tactile textures belonging
to a continuum of rough to smooth adjectives. Influence of waveform and amplitude is shown to play an
important role in perceiving a texture as smooth or rough, and spatial period is a possible modulator of different
degrees of roughness or smoothness. Finally, we discuss how these findings can be used by designers on tactile
feedback devices.
1 INTRODUCTION
The vast majority of our daily touch interactions on
devices such as phones or tablets, consisting mainly
of visual and auditory information (Levesque et al.,
2011), are still lacking colourful tactile experience,
which has been shown to add to their emotional im-
pact (Wilson and Brewster, 2017). While real materi-
als vary in shape but also size or textures, the simula-
tion of these materials is often limited, due to the tech-
nological constraints of the devices. As such, various
devices can be found, ranging from deformation crust
devices, pin arrays, electrovibratory devices, midair
vibrations or friction modulation surfaces (Culbert-
son et al., 2018). Focusing specifically on tactile tex-
tures, ultrasonic based tablets have shown promising
enhancements to the user’s exploratory movements,
allowing applications such as haptic text messages,
image sharing and virtual touch (Mullenbach et al.,
2014) or haptic e-books (Cingel and Piper, 2017)
which can enhance children’s reading activity on a
tablet with tactile textures. These devices rely on a
phenomenon called squeeze film effect (Biet et al.,
2007) which leverages ultrasonic vibrations to create
an air-gap between the user’s finger and the tablet, re-
sulting in friction reduction.
1.1 Related Work
Thus far, most of the studies on tactile perception con-
ducted on these devices were focused on perception
thresholds of friction, size or sharpness(Biet et al.,
2007; Samur et al., 2009; Kalantari et al., 2016;
Kalantari et al., 2018b; Kalantari et al., 2018a). In the
context of interaction design however, many oppor-
tunities will arise from the ability of rendering tac-
tile textures that provide users with specific percep-
tual sensations (i.e. rough/smooth, soft/hard). Lit-
tle research has addressed the perception of simu-
lated textures (Brewer et al., 2016; Messaoud et al.,
2016). In these studies, real and simulated surfaces
were explored and compared by the participants. Re-
sults show acceptable classifications between real and
re-created textures, therefore illustrating the influence
of parameters such as temporal frequency and spa-
tial period, amplitude, friction, with specific signal
shapes. Fabrics or material with unique extracted fea-
tures gave participants enough perceptual cues to suc-
cessfully distinguish between compliant and harder
surfaces, between low friction surfaces and high fric-
tion surfaces, but also between different recreated fab-
ric such as velvet and cotton.
In Messaoud (Messaoud et al., 2016) virtual tac-
tile textures were created using a multi level approach
with both signal shape (the average of user’s friction
Dariosecq, M., Plénacoste, P., Berthaut, F., Kaci, A. and Giraud, F.
Investigating the Semantic Perceptual Space of Synthetic Textures on an Ultrasonic based Haptic Tablet.
DOI: 10.5220/0008979800450052
In Proceedings of the 15th International Joint Conference on Computer Vision, Imaging and Computer Graphics Theory and Applications (VISIGRAPP 2020) - Volume 2: HUCAPP, pages
45-52
ISBN: 978-989-758-402-2; ISSN: 2184-4321
Copyright
c
2022 by SCITEPRESS – Science and Technology Publications, Lda. All rights reserved
45

contrast) and real textile specific spatial periods (num-
bers of grooves of the textile’s surface) gathered by
tribological extraction. Instead of relying on existing
materials, we focus here on synthetic textures, with
the goal of allowing interface designers to generate
semantically defined (e.g. smooth, rough ...) textures
from a set of parameters. A similar approach was pro-
posed by Friesen et al (Friesen et al., 2018), who study
the users’ ability to recognise the spatial frequency of
synthetic tactile textures. We believe that observing
how individuals perceive and give perceptual descrip-
tors to randomly simulated textures will offer an in-
sight into which parameters tend to influence percep-
tion. In this paper, we aim to strengthen this method-
ology by giving a more general view about the influ-
ence of these parameters on the user’s perception, al-
lowing designers to approach specific tactile percep-
tions without the need of tribological extractions of
real materials.
Human perceptual and affective experiences in
touching materials are expressed by a semantically
multilayered and multidimensional information space
(Okamoto et al., 2016). The bottom layer of this
perception system involves the perception of phys-
ical properties, allowed by tactile receptors dis-
tributed by clusters around the human skin. Activated
mechanoreceptors or thermoreceptors will then trans-
mit information through nerve signals to the brain
(Dargahi and Najarian, 2004). This psychophysical
layer, or layer of textures has been widely investi-
gated, with more than 20 papers offering a relatively
homogeneous description of the dimensions required
to identify textures. While results may vary, previ-
ous attempts to describe this texture perception space
used multidimensional scaling (MDS) to converge to
an optimal 3 to 5 dimensions space (Holliins et al.,
1993; Hollins et al., 2000; Picard et al., 2003; Tiest
and Kappers, 2006; Guest et al., 2011; Okamoto et al.,
2016). These main textural dimensions supposedly
include continuum such as ”Rough/Smoothness”,
”Hard/softness”, ”Sticky/Slipperiness”, ”Hot/cold”
and ”Dry/Wetness”. Going further, Guest et al.
(Guest et al., 2011) broadened the lexicon used to
describe the experience of touch using similar MDS
based experimental design to represent the semantic
perceptual spaces underlying the words answered in
touch perception tasks. If the importance of a clear
lexicon to describe the perceptual experiences of real
materials is stressed by Guest et al., a lexicon describ-
ing artificially rendered textures on haptic devices
would greatly help further developing these technolo-
gies.
The semantic perception space for real materials
has been thoroughly studied, but it remains mostly
unknown for synthetic tactile textures on an ultrasonic
tablet. Moreover, there are no clear guidelines on how
to tune the parameters used for texture rendering to
elicit a specific perception. The goal of this study is
to broadly investigate the user’s semantic perceptual
space of ultrasonic rendered textures. We also aim to
reveal the relationship between specific semantic pat-
terns and the synthesis parameters used to create the
textures. More precisely, we aim to observe if there is
a specific relation between the waveform, amplitude,
and frequency and the descriptors used to qualify the
perception of specific textures.
2 EXPERIMENT
A closed card sorting task was performed to inves-
tigate the participant’s semantic perceptual space af-
ter they explored a sample of synthetic tactile texture.
Participants had to explore simulated textures on an
ultrasonic tactile device and qualify each texture us-
ing descriptors of either consistency and/or texture.
It is worth noting that there was no visual feedback
for the participants, the screen remained blank and
the textures were only tactile. Textures were explored
only once, without time restriction and with the pre-
ferred hand. During this task noise-cancelling head-
phones were used to prevent interference with noises
that could be emitted by the device. Factor analysis of
mixed data was used to investigate both the semantic
perceptual space derived from the chosen adjectives
and its relation with the texture’s parameters.
2.1 Textures and Descriptors
Thirty two synthetic tactile textures were generated
on the tablet’s surface using different waveforms, spa-
tial periods, amplitudes and ratios with a constant
offset. Two waveforms were used, namely sine and
square waves which is depicted in Figure 1. Spa-
tial periods ranged from 1000 to 10000 µm including
1000, 2500, 5000 and 10000 µm. Ratios, which cor-
respond to the proportion of high voltage in a period
for the square waveform, consisted of 10, 50, and 90
percents. Finally, two amplitudes ranges of 10% and
40% were used with an offset of 50%, 100% being the
maximal voltage actuated by the piezoelectric cells.
Participants were asked to describe textures by se-
lecting adjectives from a set of 20 descriptors. Instead
of relying on descriptors designed for visual textures
(Rao and Lohse, 1996), we chose to build a tactile
specific set of descriptors. They were therefore cho-
sen by narrowing down answers from a pre-testing
open card sorting task with 22 participants in which
HUCAPP 2020 - 4th International Conference on Human Computer Interaction Theory and Applications
46
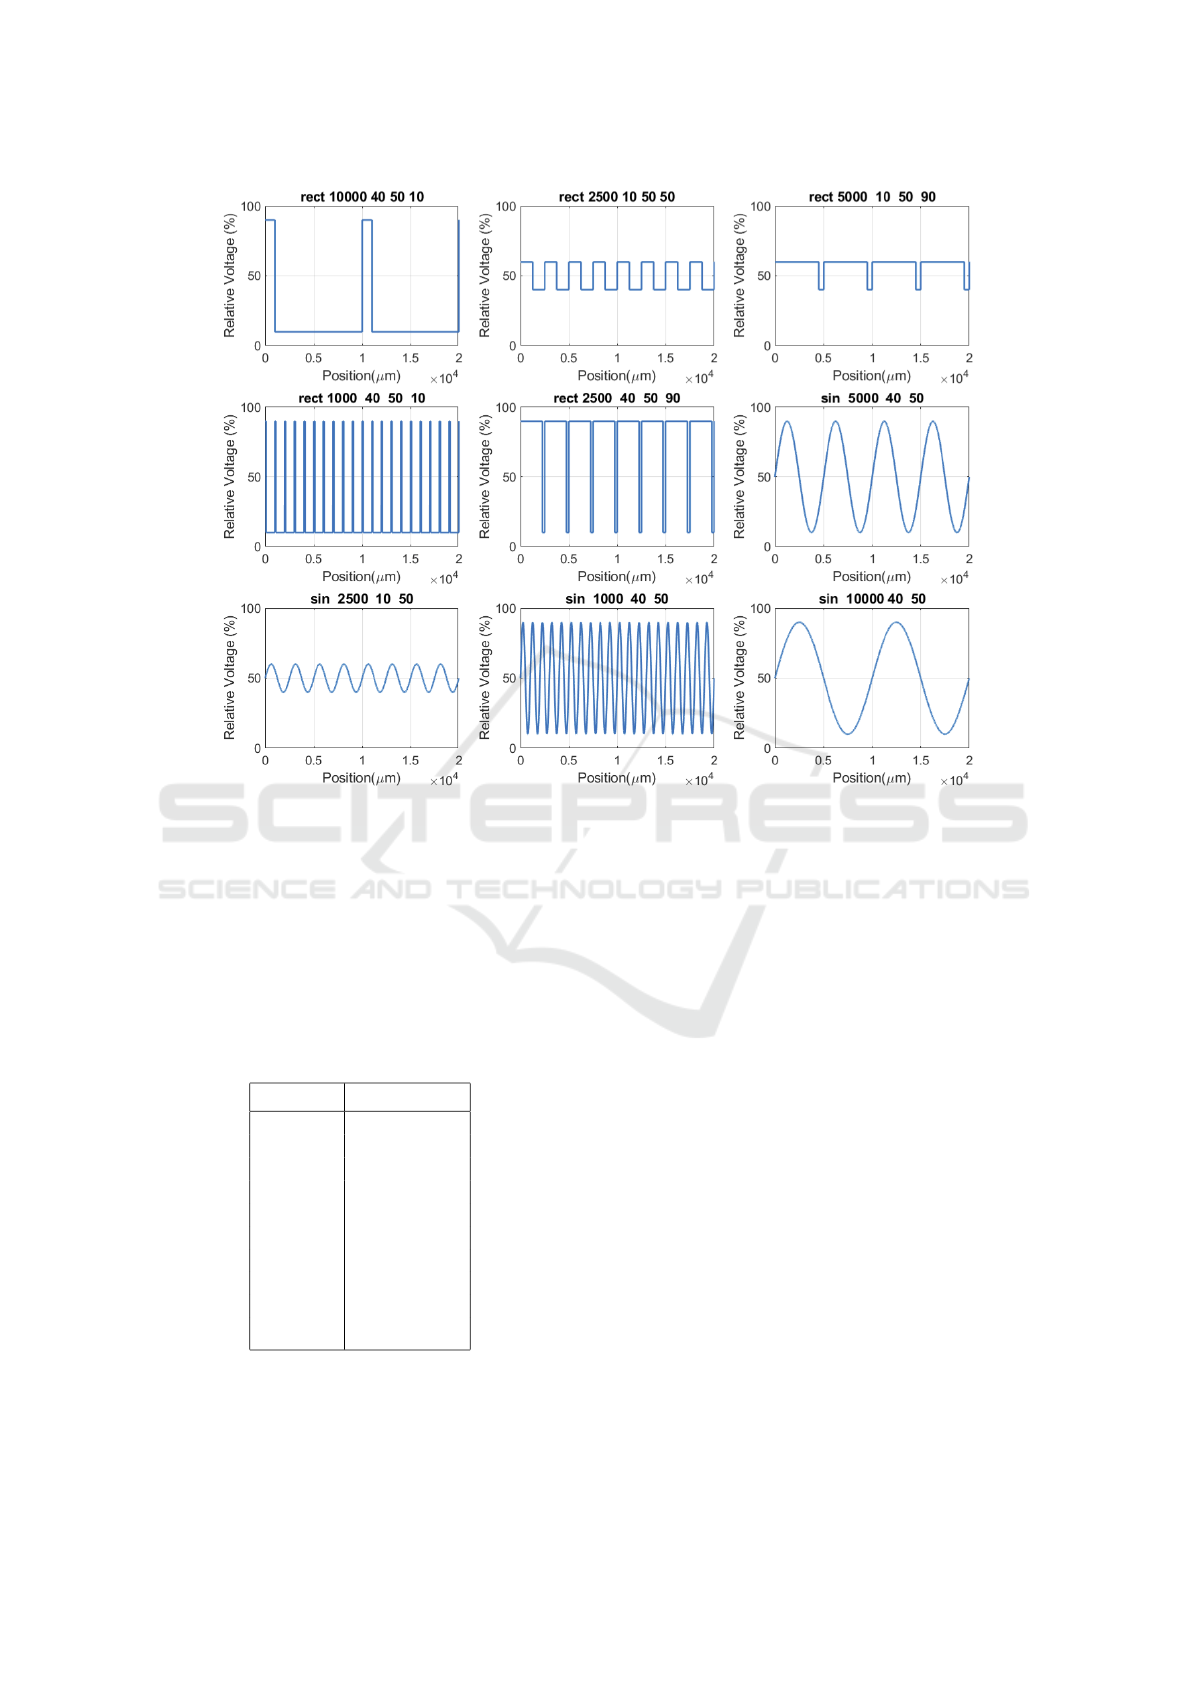
Figure 1: Example textures from a selection of waveforms (sine and rect/square waves), spatial periods, amplitude and ratios
(only for square waves) used in the study. 50 corresponds to the offset (50% of voltage).
they were asked to propose as many adjectives as they
wanted on the same set of synthetic textures. From
these answers, the ten more frequent adjectives were
kept. This pre-testing task also revealed a number
of terms describing consistency rather than texture,
which we chose to keep as a separate category and
complete with additional adjectives.
Table 1: Summary of the descriptors.
Texture Consistency
Delicate Hard
Spiky Soft
Sticky Mellow
Rough Pasty
Smooth Slimy
Granular Elastic
Wet Spongy
Oily Gelatinous
Sandy Viscous
Slippery Friable
2.2 Apparatus
Friction reduction comes with a number of limita-
tions, such as the absence of feedback when the finger
is not moving. However it allows for finer control of
synthetic texture parameters compared to other tech-
nologies such as vibrotactile feedback, which would
not permit the range of spatial periods that we inves-
tigate in this study.
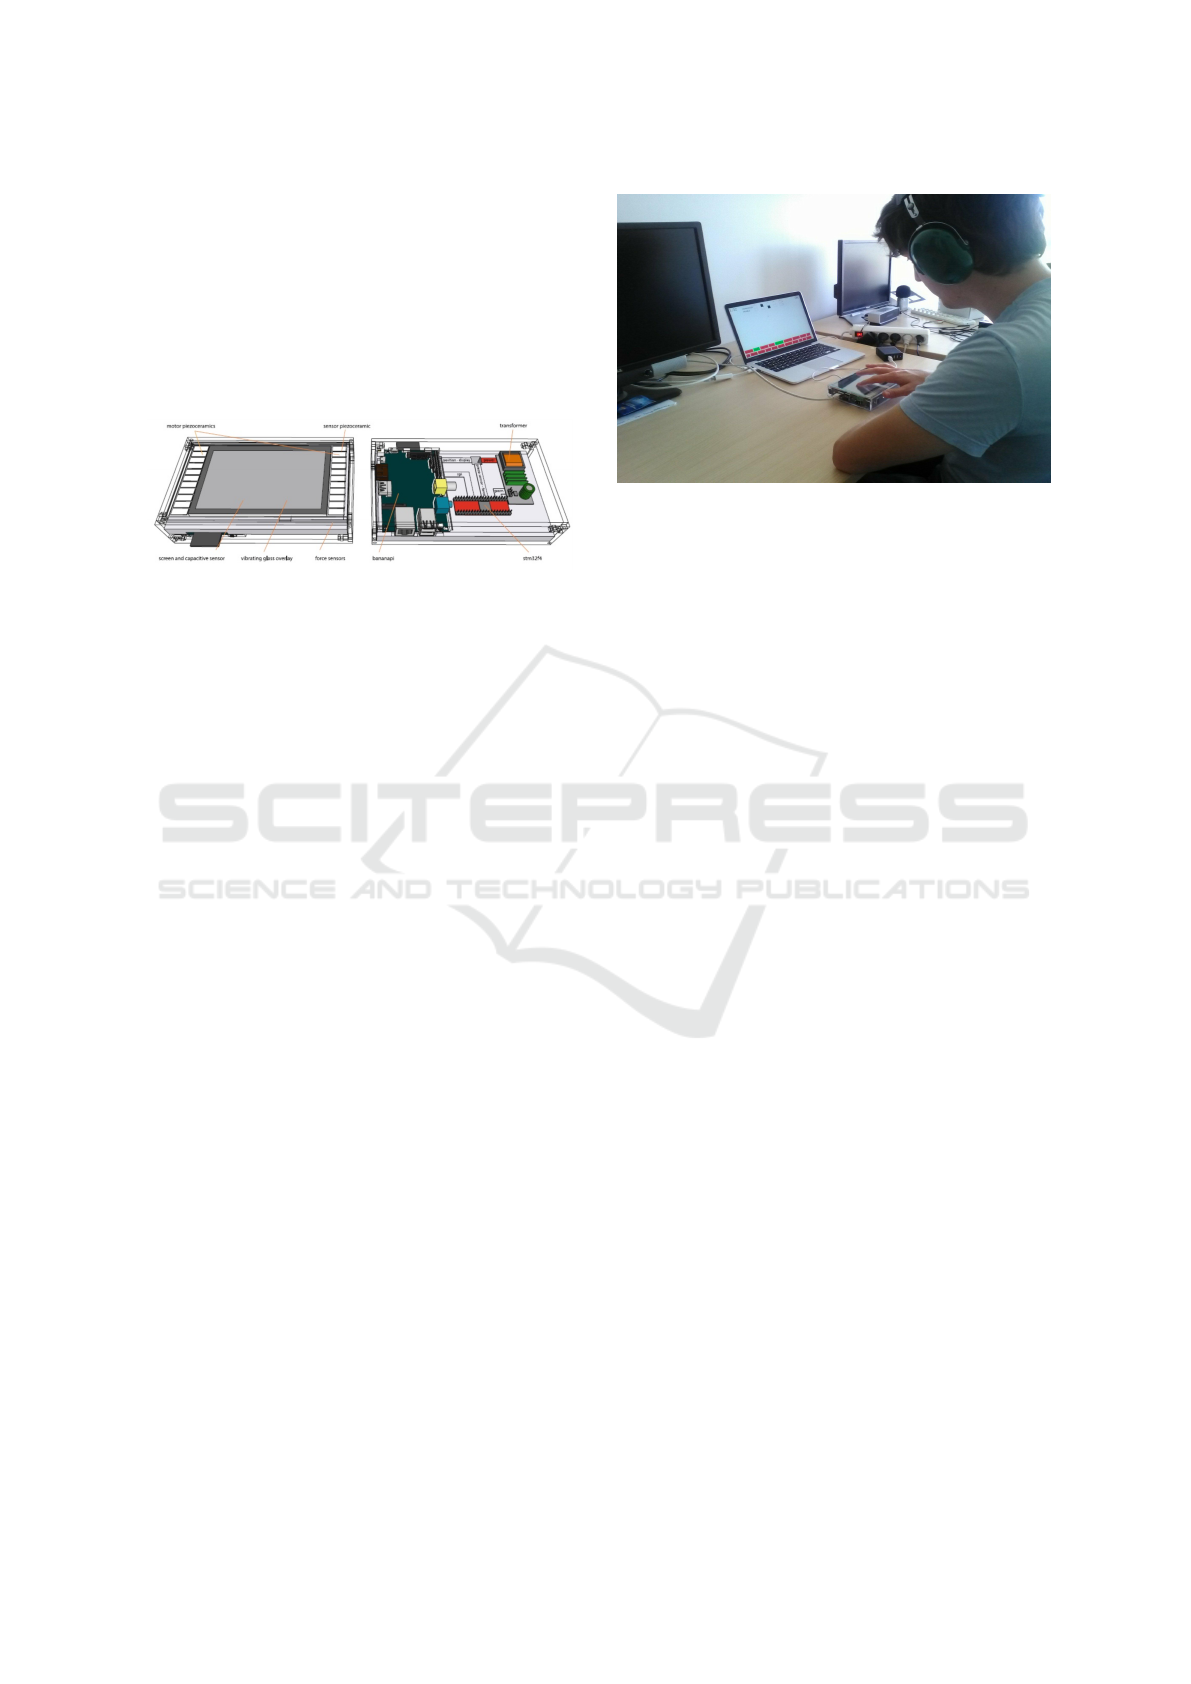
A tactile feedback display based on ultrasonic vi-
brations for haptic rendering was used, which is de-
picted in Figure 2. The enhanced visual tactile ac-
tuator (E-ViTa) is a Banana Pi based single-board
computer (Shenzhen LeMaker Technology Co. Ltd,
China),running a 1 GHz ARM Cortex-A7, a dual-core
CPU and 1 GB RAM. A STM32f4 microcontroller
(STMicroelectronics, France) is allowed to work in
parallel with the computer via Serial Peripheral In-
terface (SPI) bus at 10 kHz. To be able to detect
positions of the fingers, this setup is connected to a
12.5cm capacitive touchscreen (Banana-LCD 5”-TS,
MAREL, China), with a sampling frequency of 62
Hz.
Ten 14x6x0.5 mm piezoelectric cells actuate a
154x81x1.6 mm fixed glass plate, resonating at 60750
Investigating the Semantic Perceptual Space of Synthetic Textures on an Ultrasonic based Haptic Tablet
47
Hz with a half wavelength of 8 mm. A power
electronic circuit converts a 12V DC voltage source
into an AC voltage, controlled in amplitude and fre-
quency and supplied to the piezoelectric cells. The
microcontroller synthesizes a pulse-width modulation
(PWM) signal to drive a voltage inverter that actuates
the piezoceramics. Details on the friction reduction
which can be achieved with this technology can be
found in (Vezzoli et al., 2017).
Figure 2: Structure of the E-Vita ultrasonic based haptic
display.
2.3 Participants
A sample of 30 participants (24 males, 6 females,
M=29, SD=8.8) were recruited for this experiment.
They were all naive regarding the haptic technology
used in the experiment to avoid any interference dur-
ing the response phase of the protocol. They where
all right-handed, without motor impairment, and par-
ticipated freely in the experiment.
2.4 Procedure
Participants were seated and briefed in front of the
setup (see Figure 3). As proposed by Rao et al. (Rao
and Lohse, 1996) for visual textures, the 32 synthetic
tactile textures were presented one at a time and only
once, in random order. The textures were only tactile
and presented on a blank screen, i.e. the textures did
not have a visual representation presented to the par-
ticipants. Participant were free to explore each tex-
ture for as long as they needed, using a continuous
motion with their index finger. The hardware used for
this experiment does not allow for multitouch tactile
feedback, so we restrained the exploration to a sin-
gle finger. They then had to choose between the 20
descriptors listed in Table 1 on a laptop placed next
to the tablet. Participants were instructed to choose
descriptors they deemed accurate to represent the ex-
plored texture. There was no limitation regarding the
number of descriptors used. Experiment duration av-
eraged 35 minutes.
Figure 3: Experimental setup.
2.5 Statistical Analysis
A 2d square matrix was computed using the partici-
pants’ answers to each texture. Each cell expresses
the probability of each adjective being chosen for a
given texture.
As pointed out by Okamoto et al. (Okamoto et al.,
2016), factor analysis is a commonly used strategy
when assessing the psychophysical dimensions of tac-
tile perception of textures. However introducing both
qualitative (the texture’s parameters) and quantitative
(the probability of an adjective occurring) variables
requires the use of a factor analysis of mixed data
(FAMD). For each texture, we have K=4 quantita-
tive variables (the waveform, spatial period, ampli-
tude, ratio parameters) on a lower two dimensional
space, and Q=20 quantitative variables (probability
for each adjective) on a related subspace while maxi-
mizing inertia. Thus, after testing for correlation of
both K and Q dimensions, independent factors are
constructed representing a maximum portion of vari-
ance from the original data. Each factor can be con-
sidered as a perceptual dimension (Okamoto et al.,
2016).
2.6 Excluded Textures and Descriptors
After running this model a first time, a selection
of textures and descriptors were removed from the
model, because they showed either a very low prob-
ability of occurrence, no correlations, or absence of
clear patterns. The following results will not account
for the following descriptors : hard, mellow, pasty
and spongy and the textures presented in table 2.
HUCAPP 2020 - 4th International Conference on Human Computer Interaction Theory and Applications
48
A B
C D
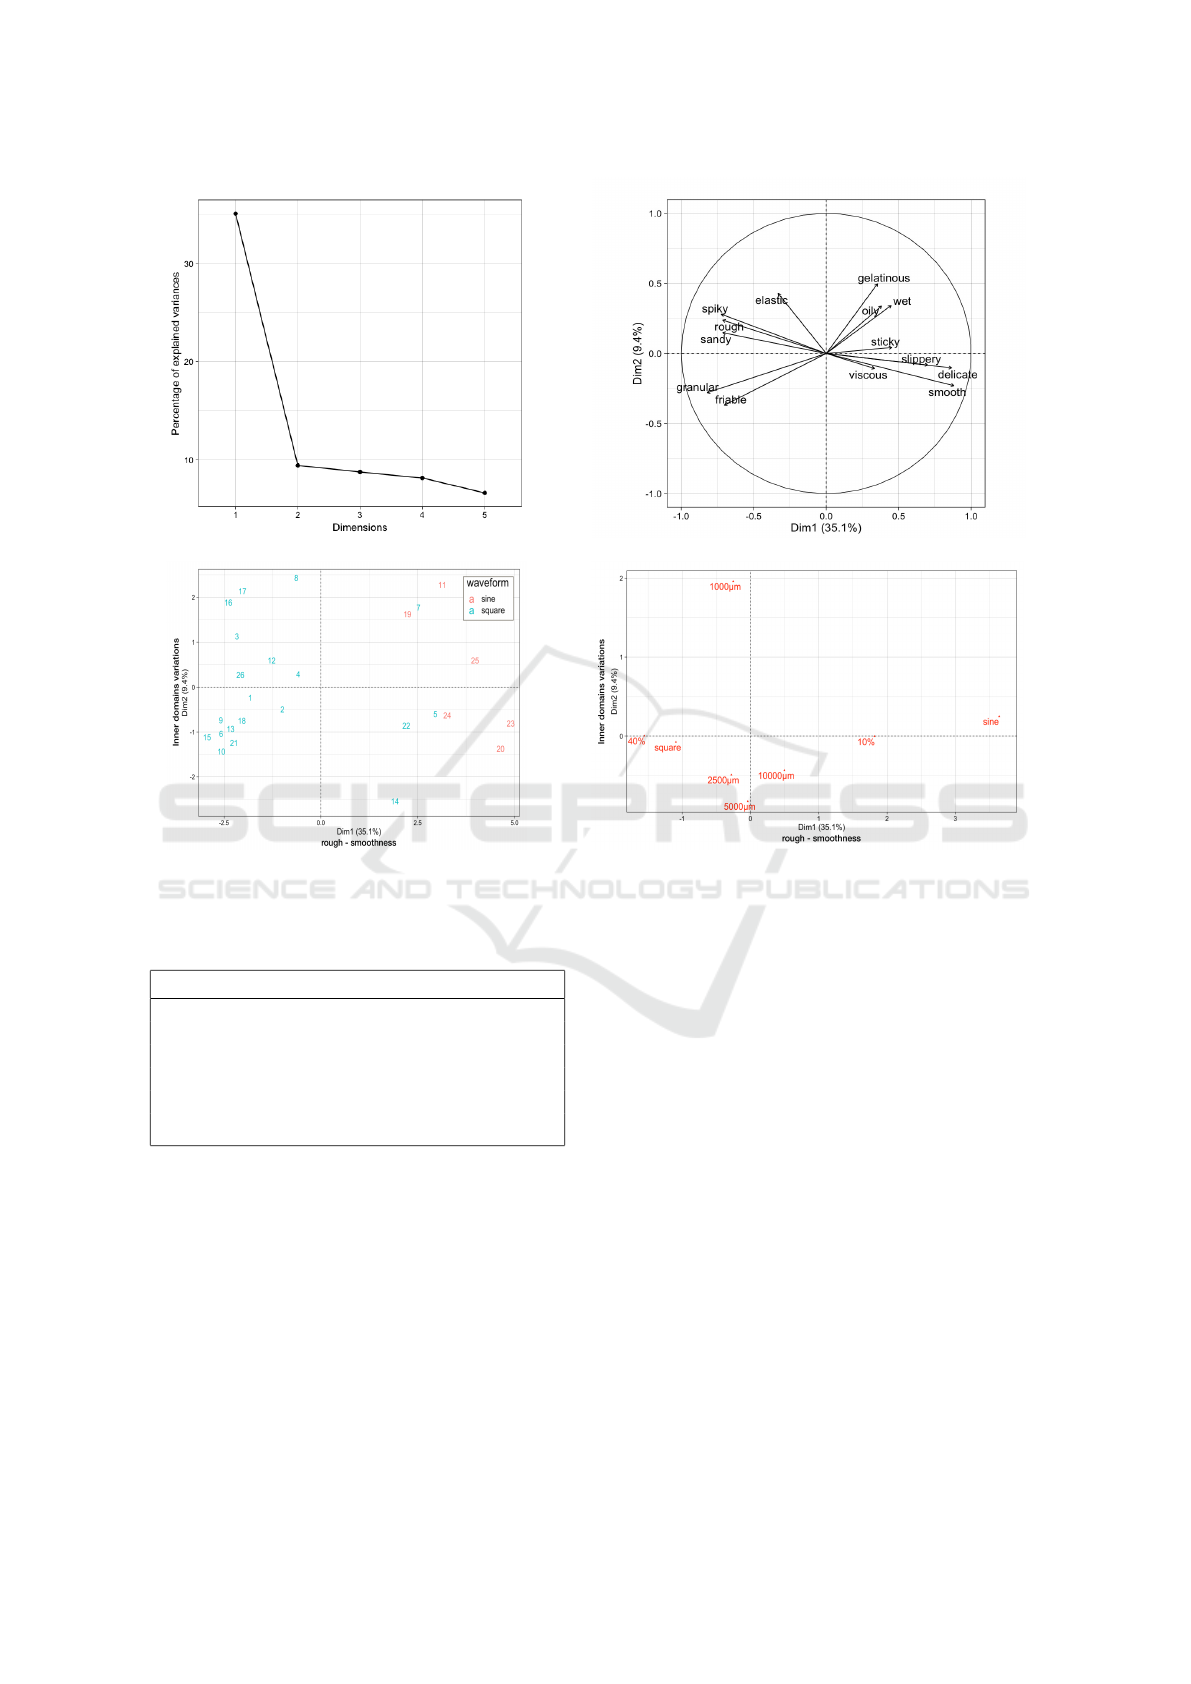
Figure 4: FAMD plots. A) screeplot, B) correlation circle for quantitative variables, C) subspace projection for the tex-
tures, D) subspace projection for the quantitative variables (waveform : sin(1)/square(2), amplitude : 10%/40%, period :
1000/2500/5000/10000 (µm)).
Table 2: Removed textures.
Texture Waveform Period Amplitude Ratio
1 rect 1000 10 90
16 rect 10000 10 50
19 rect 5000 10 50
23 rect 2500 10 50
27 sin 2500 40 na
28 sin 1000 40 na
3 RESULTS AND DISCUSSION
3.1 Semantic Perceptual Space
Results for the factor analysis of mixed data demon-
strate an optimal two dimensional space as shown
by the scree plot in Figure 4.A with a total of 44.6
% variance retained. Factor 1 (35.1 %) can be in-
terpreted as a rough/smoothness continuum with se-
mantically opposed clusters of descriptors including
rough descriptors all correlating negatively with F1
and smooth descriptors positively correlating (Figure
4.B). Table 3 shows the loading values for all fac-
tors, all loadings appearing as their maximum val-
ues. Loadings values can be interpreted as the cor-
relation coefficient between the loading and the fac-
tor. All descriptors within F1 show correlation coeffi-
cients superior to .71, indicating a strong relationship
to the factor. With approximately 3 times the vari-
ance retained, the rough/smoothness factor accounts
for most of the variations in this model, although F2’s
(9.4 %) loadings tends to explains both smooth and
rough inner clusters variations, with either rougher
or smoother surfaces. These results indicate that a
methodology designed to assess the psychophysical
dimensions (Okamoto et al., 2016) and the seman-
tic (Guest et al., 2011) of tactile perception on real
textures can be transferred to rendered ultrasonic tex-
tures. The texture sample used for this study therefore
seem to elicit perception of various roughness levels.
Perception elements of viscoelasticy (F3, 8.74%) and
wet/stickyness (F4, 8.13%) can also be extracted.
Investigating the Semantic Perceptual Space of Synthetic Textures on an Ultrasonic based Haptic Tablet
49

Table 3: FAMD factors extracted from the probability of adjective occurrence given a texture.
Factor F1: rough /
smoothness
F2: inner domains variations F3 : viscoelasticity F4 : wet/stickyness
%variance 35% 9.4% 8.74% 8.13%
Relationship
squared
Waveform .60 period .63
(qualitative) amplitude .42
Loadings granular -.82 viscous .52 sticky -.60
(quantitative) spiky -.72 elastic .45 wet .50
rough -.72
sandy -.71
friable -.71
smooth .88
delicate .86
slippery .70
3.2 Relation between Textures
Parameters and Semantic
Perceptual Space
In order to elicit specific perceptions, the underlying
influence of the parameters used to render these tex-
tures must be addressed. By maximizing the corre-
lations between qualitative and quantitative elements
and the factors, factor analysis of mixed data offers a
tool to assess these relations. Figure 4.C represents
the texture’s sub-space within the factors. We chose
not to provide the details for each of the 32 individ-
ual textures, to focus on the overall texture parame-
ters. Figure 4.D shows each modality of the texture’s
parameters, appearing as the centroid of the textures
possessing these properties in the 2D factor space.
Results show relationship squared coefficients of .60
for waveform and .42 for amplitude with F1, and .63
between period and F2. Relationship squared metric
helps appreciate the strength of the relation between a
qualitative variable and the factor.
Figure 4.D and Table 3 show a strong influence of
waveform and amplitude on F1, meaning that these
variables influence heavily the participant’s percep-
tion, leading them to categorize a texture on a rough
or smooth continuum. Indeed, textures being identi-
fied as rough-like (Figure 4.C), tend to possess spe-
cific properties such as being square waveforms with
higher amplitude, while smoother textures tend to be
sinusoidal waveforms with lower amplitudes. Varia-
tions within either continuum could here be explained
by the period, indeed variations located on the verti-
cal axis (Figure 4.B-dim2, Figure 4.D-dim2) of dif-
ferent roughness or softness tend to vary with differ-
ent magnitudes of periods. Also, Figure 4.C shows a
small cluster of square waveforms being identified as
smooth-like textures, due to lower amplitudes and a
probable effect of ratio, participants might not be able
to clearly perceive elements of macro roughness with
such reliefs.
3.3 Limitations
Regarding limitations, this experiment does not pro-
vide a specific list of textures eliciting very precise
and consistent perceptions. It rather provides general
guidelines allowing one to play with the dimension of
rough/smooth textures. As pointed out by Okamoto
et al. (Okamoto et al., 2013), adjective labels used in
these experiments are suffering from limitations, such
as limited vocabulary related to physical properties of
material, semantic variability or the lack of consensus
regarding the meaning of a descriptor. More appropri-
ately, these descriptors are more often used for the de-
tection of perceptual dimensionality, it is no surprises
that the descriptors presenting the best correlations,
probability of occurrences and representation in this
model tend to belong to the description of perceptual
dimensions.
Table 4: Tactile perception adjectives and possible corre-
sponding synthetic texture parameters.
Adjective Waveform Period Amplitude Ratio
granulous rect 5000 40 50
rough rect 2500 40 50
sandy rect 1000 40 50
smooth sin 10000 10 na
delicate sin 1000 10 na
HUCAPP 2020 - 4th International Conference on Human Computer Interaction Theory and Applications
50
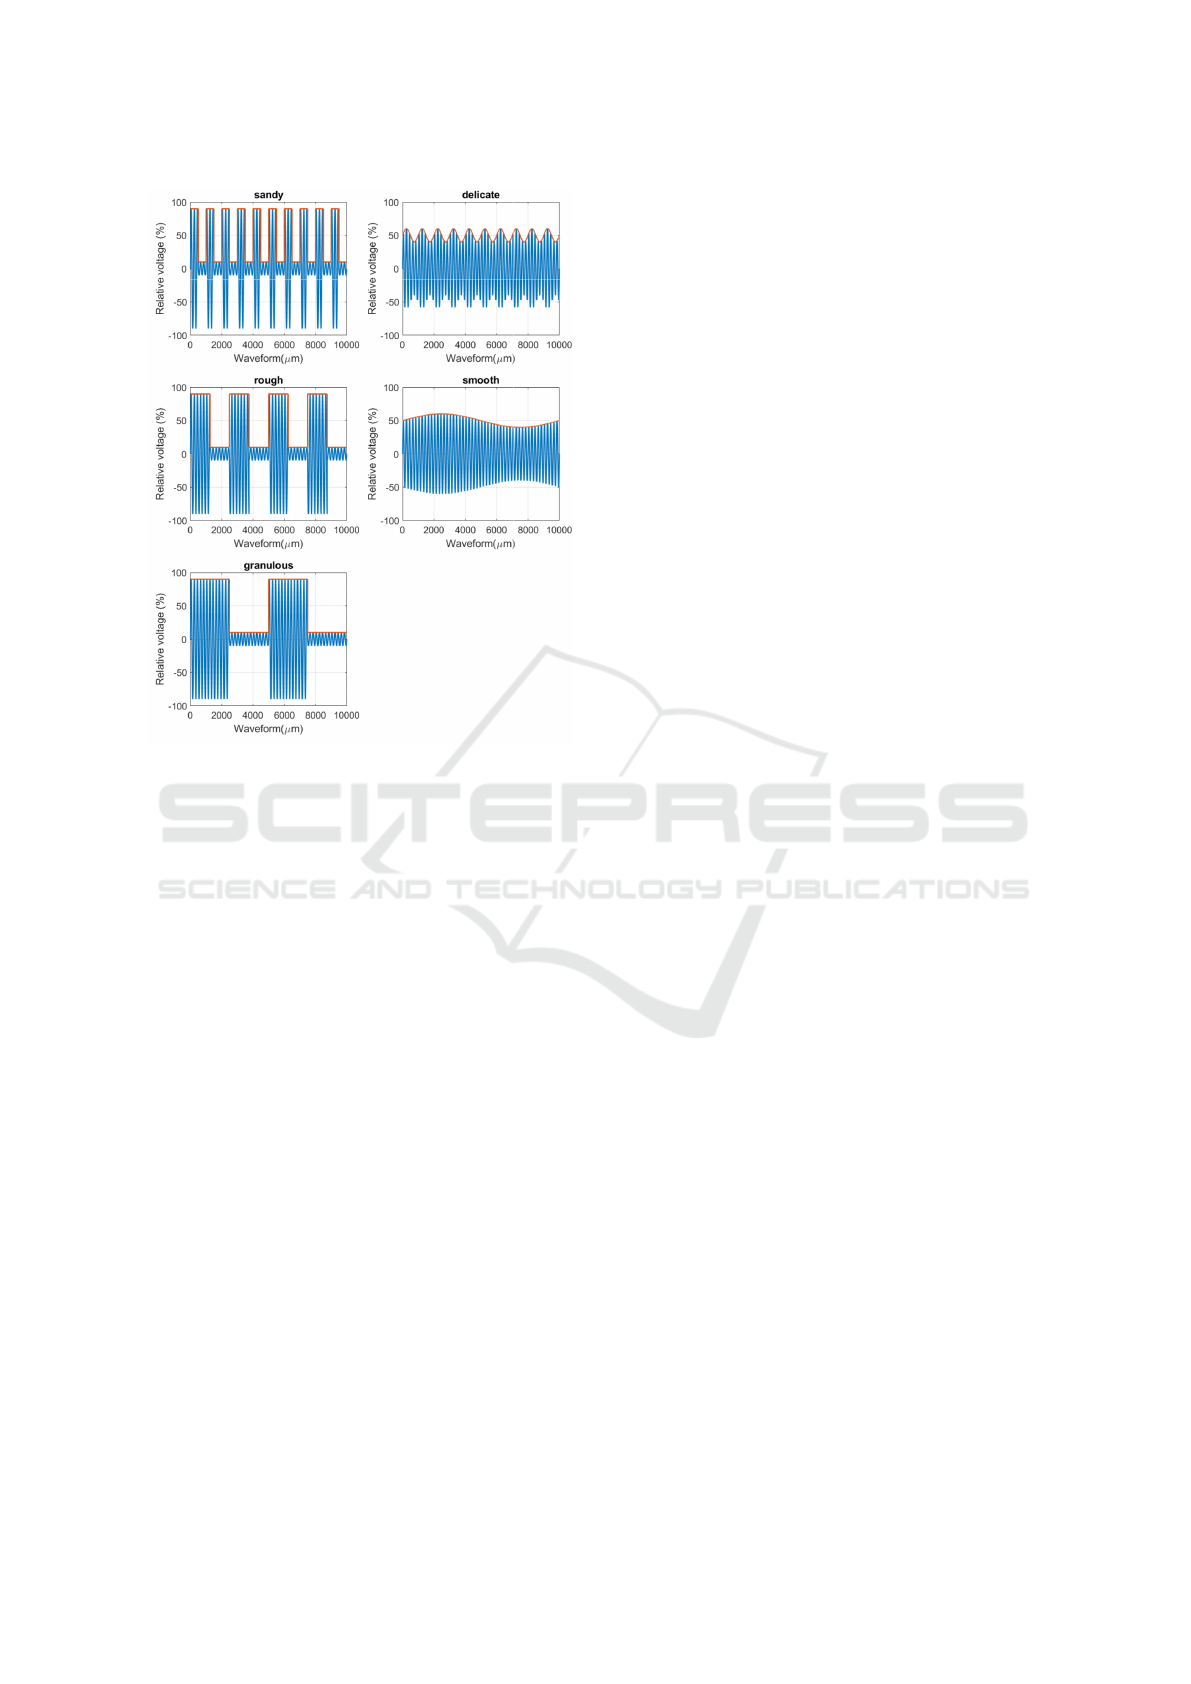
Figure 5: Waveform sample resulting from the parameters
which can be used to elicit perceptions represented by the
adjectives in Table 4.
3.4 Implications for the Design of
Tactile Feedback
From the results, we can extract a set of texture pa-
rameters that elicit perceptions ranging from smooth
to rough. This set is shown in Table 4. Figure 5 de-
picts the corresponding waveform patterns used for
texture rendering. As shown by our results, elicit-
ing smoother perceptual experiences would imply us-
ing sinusoidal waveforms with lower amplitudes and
rough-like textures would be rendered using rectan-
gular waveforms with higher amplitudes. Spatial pe-
riod could imply finer to coarser rough-like textures,
but this relationship remains uncertain for smooth-
like textures as there were fewer sinusoidal textures.
While this study was conducted on a tablet with ultra-
sonic friction reduction, we believe the same effects
could be obtained with other tactile rendering tech-
nologies which allow for at least creating synthetic
textures with two waveforms (square and sine) and
controllable spatial period.
4 CONCLUSION
Using models designed to investigate the perceptual
space of real textures, this study shows that it is
possible to investigate simulated textures using the
same strategies. We showed that a continuum of
smooth/roughness does exist in a given sample of ul-
trasonic rendered textures, with different degrees of
roughness and smoothness. Influence of waveform
and amplitude were found to play an important role
in perceiving a texture as smooth or rough, and spatial
period as a possible modulator of different degrees of
roughness or smoothness. For designers, these results
are offering insight on how to tune specific param-
eters such as wave grating, amplitude and period to
elicit perceptions of smooth/roughness, but also pos-
sible various degrees of roughness, without the need
to go through tribological extractions. In future work
we will explore other waveforms such as sawtooth or
triangle, with a broader range of amplitudes and peri-
ods. Finally the association of visual and tactile com-
ponents in the case of synthetic textures still needs to
be addressed.
REFERENCES
Biet, M., Giraud, F., and Lemaire-Semail, B. (2007).
Squeeze film effect for the design of an ultrasonic tac-
tile plate. IEEE transactions on ultrasonics, Ferro-
electrics and Frequency control, 54(12):2678–2688.
Brewer, D. J., Meyer, D. J., Peshkin, M. A., and Col-
gate, J. E. (2016). Viscous textures: Velocity de-
pendence in fingertip-surface scanning interaction. In
2016 IEEE Haptics Symposium (HAPTICS), pages
265–270. IEEE.
Cingel, D. and Piper, A. M. (2017). How parents engage
children in tablet-based reading experiences: An ex-
ploration of haptic feedback. In Proceedings of the
2017 ACM Conference on Computer Supported Coop-
erative Work and Social Computing, pages 505–510.
ACM.
Culbertson, H., Schorr, S. B., and Okamura, A. M. (2018).
Haptics: The present and future of artificial touch sen-
sation. Annual Review of Control, Robotics, and Au-
tonomous Systems, 1:385–409.
Dargahi, J. and Najarian, S. (2004). Human tactile percep-
tion as a standard for artificial tactile sensing—a re-
view. The International Journal of Medical Robotics
and Computer Assisted Surgery, 1(1):23–35.
Friesen, R. F., Klatzky, R. L., Peshkin, M. A., and Col-
gate, J. E. (2018). Single pitch perception of multi-
frequency textures. In 2018 IEEE Haptics Symposium
(HAPTICS), pages 290–295. IEEE.
Guest, S., Dessirier, J. M., Mehrabyan, A., McGlone, F., Es-
sick, G., Gescheider, G., Fontana, A., Xiong, R., Ack-
erley, R., and Blot, K. (2011). The development and
Investigating the Semantic Perceptual Space of Synthetic Textures on an Ultrasonic based Haptic Tablet
51

validation of sensory and emotional scales of touch
perception. Attention, Perception, & Psychophysics,
73(2):531–550.
Holliins, M., Faldowski, R., Rao, S., and Young, F. (1993).
Perceptual dimensions of tactile surface texture: A
multidimensional scaling analysis. Perception & psy-
chophysics, 54(6):697–705.
Hollins, M., Bensma
¨
ıa, S., Karlof, K., and Young, F. (2000).
Individual differences in perceptual space for tactile
textures: Evidence from multidimensional scaling.
Perception & Psychophysics, 62(8):1534–1544.
Kalantari, F., Grisoni, L., Giraud, F., and Rekik, Y. (2016).
Finding the minimum perceivable size of a tactile el-
ement on an ultrasonic based haptic tablet. In Pro-
ceedings of the 2016 ACM on Interactive Surfaces and
Spaces, pages 379–384. ACM.
Kalantari, F., Gueorguiev, D., Lank, E., Bremard, N., and
Grisoni, L. (2018a). Exploring fingers’ limitation of
texture density perception on ultrasonic haptic dis-
plays. In International Conference on Human Haptic
Sensing and Touch Enabled Computer Applications,
pages 354–365. Springer.
Kalantari, F., Lank, E., Rekik, Y., Grisoni, L., Giraud, F.,
Rateau, H., Rekik, Y., Lank, E., Grisoni, L., Vezzoli,
E., et al. (2018b). Determining the haptic feedback
position for optimizing the targeting performance on
ultrasonic tactile displays. In IEEE Haptics Sympo-
sium (HAPTICS 2018), San Fransisco, United States.
Levesque, V., Oram, L., MacLean, K., Cockburn, A.,
Marchuk, N. D., Johnson, D., Colgate, J. E., and
Peshkin, M. A. (2011). Enhancing physicality in touch
interaction with programmable friction. In Proceed-
ings of the SIGCHI Conference on Human Factors in
Computing Systems, pages 2481–2490. ACM.
Messaoud, W. B., Bueno, M.-A., and Lemaire-Semail,
B. (2016). Textile fabrics texture: from multi-level
feature extraction to tactile simulation. In Inter-
national Conference on Human Haptic Sensing and
Touch Enabled Computer Applications, pages 294–
303. Springer.
Mullenbach, J., Shultz, C., Colgate, J. E., and Piper, A. M.
(2014). Exploring affective communication through
variable-friction surface haptics. In Proceedings of the
SIGCHI Conference on Human Factors in Computing
Systems, pages 3963–3972. ACM.
Okamoto, S., Nagano, H., and Ho, H.-N. (2016). Psy-
chophysical dimensions of material perception and
methods to specify textural space. In Pervasive Hap-
tics, pages 3–20. Springer.
Okamoto, S., Nagano, H., and Yamada, Y. (2013). Psy-
chophysical dimensions of tactile perception of tex-
tures. IEEE Transactions on Haptics, 6(1):81–93.
Picard, D., Dacremont, C., Valentin, D., and Giboreau, A.
(2003). Perceptual dimensions of tactile textures. Acta
psychologica, 114(2):165–184.
Rao, A. R. and Lohse, G. L. (1996). Towards a texture nam-
ing system: Identifying relevant dimensions of tex-
ture. Vision Research, 36(11):1649–1669.
Samur, E., Colgate, J. E., and Peshkin, M. A. (2009). Psy-
chophysical evaluation of a variable friction tactile in-
terface. In Human vision and electronic imaging XIV,
volume 7240, page 72400J. International Society for
Optics and Photonics.
Tiest, W. M. B. and Kappers, A. M. (2006). Analysis of hap-
tic perception of materials by multidimensional scal-
ing and physical measurements of roughness and com-
pressibility. Acta psychologica, 121(1):1–20.
Vezzoli, E., Vidrih, Z., Giamundo, V., Lemaire-Semail,
B., Giraud, F., Rodic, T., Peric, D., and Adams, M.
(2017). Friction reduction through ultrasonic vibra-
tion part 1: Modelling intermittent contact. IEEE
transactions on haptics, 10(2):196–207.
Wilson, G. and Brewster, S. A. (2017). Multi-moji: Com-
bining thermal, vibrotactile & visual stimuli to expand
the affective range of feedback. In Proceedings of the
2017 CHI Conference on Human Factors in Comput-
ing Systems, pages 1743–1755. ACM.
HUCAPP 2020 - 4th International Conference on Human Computer Interaction Theory and Applications
52
