
A Low Cost Electronic Nose with a GMM-UBM Approach for Wood
Species Verification
Naren Mantilla-Ramirez
1
, Homero Ortega-Boada
1 a
, Milton Paja-Sarria
2 b
and Alexander Sep
´
ulveda-Sep
´
ulveda
1 c
1
Escuela de Ingenier
´
ıas El
´
ectrica, Electr
´
onica y de Telecomuniciones (E3T), Universidad Industrial de Santander,
Bucaramanga, Colombia
2
Facultad de Ingenier
´
ıas, Universidad Santiago de Cali, Cali, Colombia
Keywords:
Wood Identification, Timber Identification, Chemical Sensor Arrays, GMM-UBM, Gaussian Mixture Models,
Universal Background Model.
Abstract:
Deforestation endangers some vulnerable wood species. Although there are effective timber species identifi-
cation methods, they are typically expensive and time-consuming, they must be carried out by experts and they
are not applicable to places far from main cities. In contrast, we propose to use electronic noses to identify
timber species, e.g. during their transportation process, from the volatile compounds that timbers emanate. In
the present work, it is proposed a method for timber species detection from their aromas. The measurements of
the volatile compounds are made by an array of 16 chemical sensors, whose curves are the inputs to a pattern
recognition system. Detection is performed by using Gaussian mixture modeling with Universal Background
Model. In contrast to previous works, in this work, we apply a new approach to the problem of timer species
detection; furthermore, the sample collection conditions are closer to those found in real situations; and, the
number of samples used is larger and more varied. We found an EER (equal error rate) of 24.18% for cedar
verification and an EER of 33.62% for 4-timber species verification.
1 INTRODUCTION
Deforestation occurs all around the globe, but espe-
cially in tropical countries like Colombia, where il-
legal logging is one of its main causes. Due to this
process, and due to the increasing timber demand,
particular tree species that can be found in wild areas
are threatened. Despite efforts to protect the countrys
natural resources, Colombian entities still struggle to
combat illegal logging. In fact, deforestation rates in
Colombia remain notably high, especially in recent
years. In this regard, a common procedure carried by
the police, consists on stopping a truck transporting
timber in order to ask the driver for a letter of safe
passage. Then, the timber cargo is verified; however,
appropriate monitoring instruments are required in or-
der to detect timber from vulnerable and prohibited
tree species.
Among different wood identification strategies,
a
https://orcid.org/0000-0003-0343-8625
b
https://orcid.org/0000-0003-4288-1742
c
https://orcid.org/0000-0002-9643-5193
looking at macroscopic features such as color, texture
and odour, stands out because they can be used to es-
tablish whether a wood is correctly labeled (Wheeler
and Baas, 1998), which is highly convenient when an-
alyzing large volumes of timber. Using these macro-
scopic features, by part of trained personnel, is the
most common way of timber identification in Colom-
bia, but it is done empirically and subjectively.
There are also precise methods based on taxo-
nomic and genetic analyzes, in which wood species
samples are compared at using genetic sequencing
techniques (Hanssen et al., 2011; Yu et al., 2016).
Although the reliability of these tests is almost 100%,
they are expensive, delayed and they must be carried
out by experts. Other used techniques involve differ-
ent spectroscopic (Rana et al., 2008; Cabral et al.,
2012) and imaging (Dickson et al., 2017) analyzes,
but they still require support from experts and a con-
siderable amount of time. All previously mentioned
approaches are effective techniques, but they do not
still meet the requirements to be applied in suburban
and rural regions away from major cities (Kalaw and
Sevilla, 2018).
Mantilla-Ramirez, N., Ortega-Boada, H., Paja-Sarria, M. and Sepúlveda-Sepúlveda, A.
A Low Cost Electronic Nose with a GMM-UBM Approach for Wood Species Verification.
DOI: 10.5220/0008978003330341
In Proceedings of the 9th International Conference on Pattern Recognition Applications and Methods (ICPRAM 2020), pages 333-341
ISBN: 978-989-758-397-1; ISSN: 2184-4313
Copyright
c
2022 by SCITEPRESS – Science and Technology Publications, Lda. All rights reserved
333

As an alternative approach, it has been pro-
posed to analyze volatile compounds emitted by wood
species by using strategies such as gas chromatogra-
phy (Fedele et al., 2007; M
¨
uller et al., 2006; Rinne
et al., 2002), but this approach is expensive as well.
On the other hand, a less expensive and practical
option is to use electronic noses (e-nose) (Kalaw and
Sevilla, 2018; Wilson, 2012). E-nose systems have
been used in a growing number of applications, for
example in food industry (Shi et al., 2017), air quality
analysis (Capelli et al., 2014), explosives (Guo et al.,
2017), and narcotics detection, among others (San-
tos and Lozano, 2015). It has also been proposed
these devices to be used for timber species identi-
fication from the volatile compounds that they em-
anate (Cordeiro et al., 2016; Kalaw and Sevilla, 2018;
Wilson, 2012).
In particular, the authors in (Garneau et al., 2004)
analyzed three different species of Pinaceae family
by using electronic noses; where, Principal Compo-
nent Analysis (PCA) was performed, showing ob-
servable differences between the species. The data
set was composed by 30 smell-prints acquired from
wood samples of the three conifer species. Later in
(Wilson et al., 2005), the authors claim to have used
neural networks as a mechanism to identify wood
species, where identification rates between 94% and
99% were obtained. Regarding the dataset, two sam-
ples per tree, belonging to 13 − 30 trees of 12 dif-
ferent wood species, were taken. Another study car-
ried out in Brazil (Cordeiro et al., 2016), classifica-
tion with electronic noses for two pairs of woods was
performed: (a) mahogany vs Spanish-cedar; and, (b)
Brazilian walnut vs black-cinnamon. The calculated
relative responses from the electronic nose were used
as input data for principal component analyses (PCA),
showing satisfactory results. However, details about
data set composition is not provided. Finally, the au-
thors in (Kalaw and Sevilla, 2018) used gas sensors
measurements to analyze the separability of five tim-
ber species in the Philippines. The authors reported
separable clusters at first glance when features ob-
tained by principal component analysis (PCA) were
used.
Notwithstanding the good results reported in pre-
viously mentioned studies, the experiments were per-
formed by using a reduced amount of samples and
in controlled conditions, far from practical situations.
This work aims to advance in this regard and present
an approach which can work in a less controlled en-
vironment, moving the experiment away from ideal
conditions. In Colombia, the extraction of wood
occurs mainly in remote regions of difficult access,
which hinders the constant presence of experts, the
transportation of wood samples and the installation of
specialized equipment. Therefore, a solution adapt-
ing to practical conditions is required. In particular,
in present work we use timber samples after trans-
portation procedures, instead of wood material. The
reason to do this is because the aromas are very fresh,
strong, and without major interference when working
with wood material, quite the opposite occurs in tim-
ber identification.
In addition to this, previous research in this area
report results in identification tasks instead of ver-
ification. The main difference between identifica-
tion and verification tasks, is that the former case
is a N-class classification problem, whilst later one
is a binary classification problem. This is a widely
discussed topic, specially in speaker recognition re-
search (Doddington et al., 2000). Verification authen-
ticates an individual timber sample by comparing it
with one specific biometric reference stored in the
database, while identification compares it with all the
bio-metrics stored in the database. As far as we know,
this is the first work in which timber species detection
procedure is performed by the smell, from a biometric
verification point of view.
This paper proposes just that. Here, we propose
a method for timber species verification from their
aromas. Timber samples were collected from wood
deposits in the “Gran Santander” region in Colom-
bia, making data collection closer to practical situa-
tions. The measurements of the volatile compounds
were made by using an array of 16 chemical sensors,
whose curves are the inputs to a pattern recognition
based system. Data pre-processing is performed using
Principal Component Analysis (PCA) (Jolliffe, 2011)
and, the detection is carried out by using Gaussian
mixture modeling with Universal Background Model
(Reynolds et al., 2000).
2 METHOD
2.1 Electronic Nose System
Figure 1 shows the building blocks for an e-nose sys-
tem (Ruiz Jim
´
enez, 2018). The chemical phase cor-
responds to the sensing of volatile compounds by the
gas sensors array. In electronic phase, electrical sig-
nals are acquired and conditioned in order to obtain a
temporal matrix representation of the sensed sample.
Finally, this data is processed by pattern recognition
algorithms in order to detect the tree species of timber
material.
There are different types of gas sensors, classified
according to their size, sensitivity, application, and
ICPRAM 2020 - 9th International Conference on Pattern Recognition Applications and Methods
334
Che
Volatile
Conditioning
Sensors
Array
Signal
Conditioning
Pattern
Recognition
and analysis
Chemical Phase Electronic Phase Software
Volatile
compounds
Identified
odor
Figure 1: Typical E-NOSE general scheme. Adapted from
(Ruiz Jim
´
enez, 2018).
technology. Sensors based on metal oxide semicon-
ductor films are the most common. They are com-
posed by n-type metal oxide crystals, such as tin(IV )
oxide (SnO
2
, aka stannic oxide). These sensors sensi-
tivity varies with temperature, so they usually have
a heating element controlled by an electric current
for the sake of keeping the temperature in a constant
value. Also, before being used for the first time, the
sensors must go through a preheating stage (Figaro,
2005). Despite these inconveniences, these sensors
are preferred because they have stable characteristics
over time and do not require frequent maintenance
processes (Ghasemi-Varnamkhasti et al., 2019).
Regarding the many electronic noses available in
the literature, there are commercial electronic noses,
whose sensors consist of nonconducting organic poly-
mers. Several types have been used such as the Cyra-
nose 320 (Garneau et al., 2004) and the Aromascan
A32S (Wilson et al., 2005). However, this type of
devices do not meet the research needs, because it
has fixed, unmodifiable and non-customized sensor
arrays.
On the other hand, customized e-noses have been
used, for example: in (Kalaw and Sevilla, 2018), an 8-
chemical sensors array with resistive principles based
on carbon nanotubes was used; and in (Cordeiro et al.,
2016), a 4-conductive polymer sensors array with re-
sistive principle was utilized. However, the manufac-
ture of sensors is out of the scope of present work.
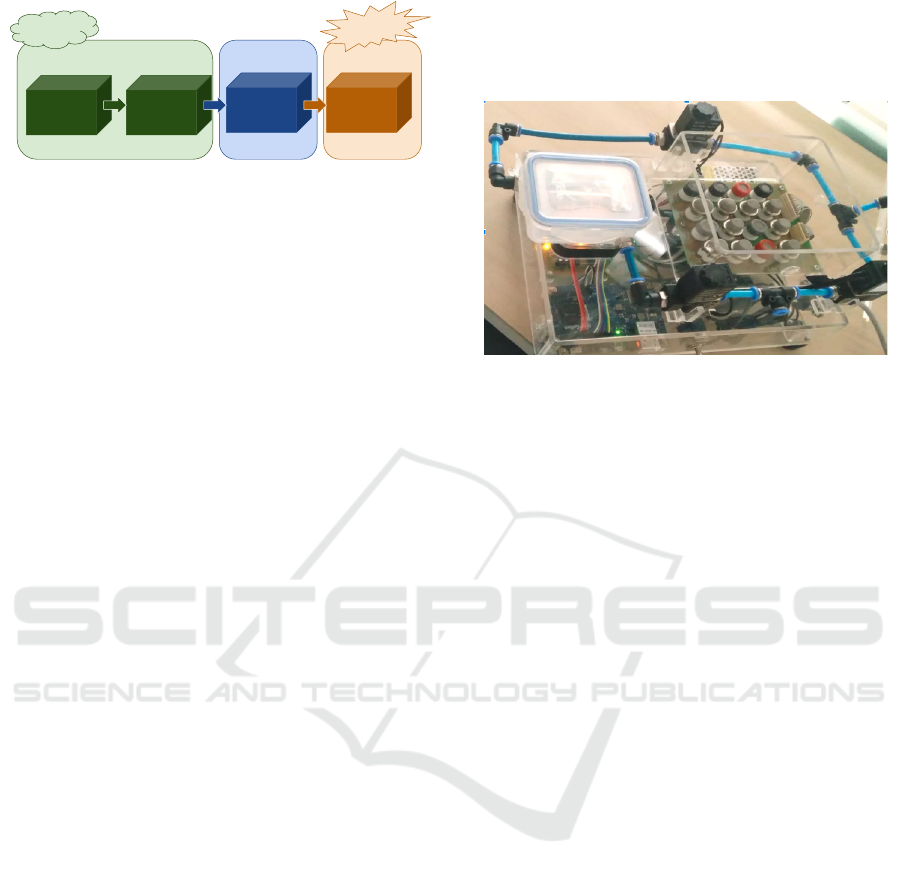
As an alternative to the aforementioned, the elec-
tronic nose used in herein corresponds to a proto-
type developed in Universidad Industrial de San-
tander (Ruiz Jim
´
enez, 2018), as shown in Fig. 2. It
was developed under the DIY (do it yourself, do it
yourself) culture, which allows to conduct research
at different scales and at a low cost. It is com-
posed by a 4 × 4 matrix array sensor. The signal
conditioning and acquisition process is carried out
by using an Intel Galileo Generation 1 acquisition
board (Ruiz Jim
´
enez, 2018). This prototype has semi-
conductor metal oxide sensors, which vary their elec-
trical resistance due to the chemical reaction that oc-
curs when gases make contact with the sensors. These
sensors belong to the manufacturing houses Figaro
Engineering and Hanwei Electronics, which are char-
acterized by their ability to detect low gas concentra-
tions and by their low cost. Table 1 lists the sensors
used in the prototype.
Figure 2: E-NOSE prototype developed by UIS
in (Ruiz Jim
´
enez, 2018).
2.2 Data Collection Procedure
In this work, a total of 309 samples (woodblocks) of
different wood species were taken from wood tim-
ber stocks of different cities in the Gran Santander
region in Colombia (Bucaramanga, Lebrija, Socorro,
San Gil, Pamplona, and Ccuta).
Before taking samples and perform all the mea-
surement experiment, it was necessary to develop two
previous tasks: e-nose preparation and sample prepa-
ration. First, the e-nose is turned on for one hour
so that the sensors reach their steady-state operation
in the corresponding environment. Later, each sam-
ple (woodblock) is prepared by brushing it 20 times
with a wooden brush, and the resulting material is dis-
carded to eliminate possible contamination by contact
with another sample, or interference with other ele-
ments. Then perform the following procedure as de-
scribed below for each wood sample:
• Brush the sample 20 more times and take approx-
imately 1 cm
3
of the resulting wood chip.
• Sense (sniff) the sample with the e-nose. As a
result, 16 response curves, corresponding to the
conductance variations of each sensor in the ma-
trix array, are obtained. This group of curves is
known as the smell-print of the wood sample.
• Let the sensors rest during 5 minutes, allowing
the entry of airflow generated by a fan, in order
to avoid previous trials interfere with the current
trial.
Each response curve was taken at a sampling pe-
riod of 270 ms, following three steps. First, the sen-
sors react to air for 100 samples; then, the correspond-
ing wood chips are placed inside sensors chamber
A Low Cost Electronic Nose with a GMM-UBM Approach for Wood Species Verification
335
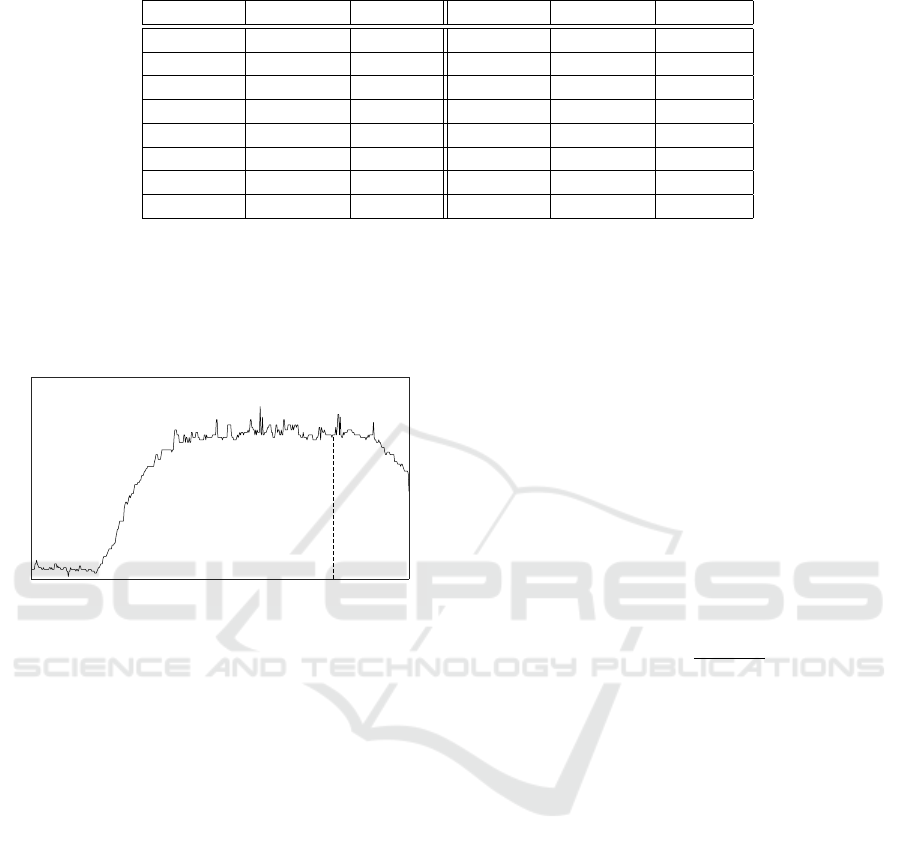
Table 1: Sensors in the E-NOSE prototype.
SENSOR BRAND REF SENSOR BRAND REF
1 HANWEI MQ-2 9 FIGARO TGS-832
2 HANWEI MQ-3 10 HANWEI MQ-6
3 HANWEI MQ-4 11 FIGARO TGS-823
4 HANWEI MQ-6 12 FIGARO TGS-816
5 HANWEI MQ-7 13 FIGARO TGS-822
6 HANWEI MQ-8 14 FIGARO TGS-813
7 HANWEI MQ-135 15 FIGARO TGS-826
8 HANWEI MQ-9 16 HANWEI MQ-3
during 300 samples; finally, the wood chips are re-
moved and the sensors are exposed to the air again
with residual air for additional 100 samples. In figure
3, it is shown an example curve response of one of the
sensors.
Phase 1 Phase 2 Phase 3
Conductance
Samples at 3.7 Hz
100 400 500
Figure 3: The different stages of the response are shown.
Phase 1, first 100 frames, where the base reading is done.
Phase 2, frames from 101 to 400, where sensors capture the
smell of the wood chip sample. Phase 3, frames from 401 to
500, where sensors begin to return to their reference state.
To reduce the electronic noise effect in the acqui-
sition system, a filtering process is carried out using
an fifth-order median filter for each sensor response
curve. It allows to reduce outliers influence on the
measurement process.
2.3 Feature Extraction
In this paper, two strategies were used for the feature
extraction stage. In the first, heuristic parameters de-
scribing the behavior of each curve were calculated
as reported in recent works. Second case scenario,
the recognition process is performed on the raw data.
2.3.1 Heuristic Parameters
Different features can be estimated from the response
curve of the conductance value of each sensor. In pre-
vious works, it is reported the use of the maximum
and minimum values, and, area under the curve as
features (Yan et al., 2015). Another way is to use
strategies that involve a transient analysis of the sen-
sor’s response (Rodriguez-Lujan et al., 2014; Rana
et al., 2008). Finally there is a third way, where a pre-
defined model is adjusted using available data (data
driven model) (Carmel et al., 2003). In the present
work the following features were estimated:
• G
0
, initial conductance value, mean of the first
100 samples of the total response.
• G
f
, final conductance value, mean of the last 50
samples of the phase 2 of the total response.
• G
max
, maximum conductance value.
• G
min
, minimum conductance value.
• B, gain coefficient; and A, pole location, corre-
sponding to an adjusted first-order auto-regressive
model:
H(z) =
Bz
−1
1 + Az
−1
. (1)
In previously reported research works, principal
component analysis (PCA) is typically used to decor-
relate variables and reduce dimensionality and then
avoid over-fitting (Akbar et al., 2016; Cordeiro et al.,
2016). PCA analysis allows to reduce the dimension-
ality by applying a linear transformation that maps
the data into a new space, where the new variables
are uncorrelated. The new dimensions are sorted by
the amount of variance they describe, from highest
to lowest, concentrating the largest amount of vari-
ance in the first components (Jolliffe, 2011). In this
way, by taking a few main components it is possible
to represent most the variability present in the original
data. Herein, after pilot experiments, we uses 90% as
the level of variance to be represented by the p PCA
components.
2.3.2 Full Time Series
For these experiments, we consider each of the N =
16 sensors as a single characteristic, resulting in a fea-
ture vector of dimension N. Furthermore, we include
the first s = 400 samples of each curve response. By
ICPRAM 2020 - 9th International Conference on Pattern Recognition Applications and Methods
336

using the first s samples, it is not necessary to reduce
the dimension, because we are using almost all the in-
formation to estimate the GMM model, i.e., 400 fea-
ture vectors of length 16 per timber block.
2.4 GMM-UBM Approach for Timber
Species Detection
The aim of this work is to support authorities in their
fight against illegal and selective timber species log-
ging. In this regard, an identification approach typi-
cally uses a closed set to classify which among N pos-
sibilities is most probable. On the other hand, species
verification may be a better approach to make the er-
ror rate drops. Verification procedures allow deter-
mining whether a sample belongs to a class by having
enough enrolled samples from that species.
A Universal Background Model (UBM) is a con-
cept taken from biometrics that, in this case, corre-
sponds to timper species-independent model, repre-
senting the universe or expected overall evaluation
conditions. Regarding the training data for the UBM,
selected samples should reflect the expected alter-
native hypothesis to be encountered during recogni-
tion. The verification task can be summarized in test-
ing whether a sample corresponds to the analyzed
class or another unknown class (alternative hypoth-
esis). In this case, the impostor hypothesis (any other
class) is modeled by the Universal Background Model
(UBM) (Reynolds et al., 2000; Doddington et al.,
2000).
In this work, two verification tasks were per-
formed: first, one class (cedar) vs the universal model,
thus individuals belonging the rest of species are in-
cluded in the UBM model; and second, each of four
particular classes (cedar, moncoro, pine and sapan) vs
the universal model, therefore, these 4 model are not
included in the UBM model. In table 2, there is a
description of the number of individuals per class.
The UBM models a probability density function
(PDF) that represents the properties of the reference
smell-print species population. In that sense, the
doubtful smell-print is compared with respect to the
UBM as well as a PDF model of the a particular
timber species. In such case, there are two models:
timber species model (λ
s
) and Reference UBM (λ
0
).
When passing the observations corresponding to the
intercepted signal X two probability values, p(X |λ
s
)
and p(X |λ
0
), are obtained, with which Likelihood
Ratio (LR) is built. However, it is common to use
the Log Likelihood Ratio (LLR),
L(X ) = log p(X |λ
s
) − log p(X |λ
0
). (2)
As the value L(X ) increases, the evidence that the
doubted smell-print correspond to the species we are
looking for becomes stronger.
For PDF modelling, the well known Gaussian
mixture model is preferred. The use of Gaussian mix-
ture models is motivated by their capability to model
arbitrary densities (Kinnunen and Li, 2010; Reynolds
and Rose, 1995). A GMM is composed of a finite
mixture of multivariate Gaussian components and the
set of parameters denoted by λ. It is characterized by
a weighted linear combination of C unimodal Gaus-
sian densities by the function:
p(o
|
λ ) =
C
∑
i=1
α
i
N (o, µ
i
, Σ
i
), (3)
where o is a D-dimensional observation or feature
vector, α
i
is the mixing weight (prior probability)
of the i-th Gaussian component, and N (·) is the D-
variate Gaussian density function with mean vector µ
i
and covariance matrix Σ
i
. The popular expectation-
maximization (EM) algorithm is used for maximizing
the likelihood with respect to a given data. The in-
terested reader is referred to (Bishop, 2006; Reynolds
et al., 2000; Kinnunen and Li, 2010) for more com-
plete details.
3 RESULTS
In order to measure the performance of the proposed
timber species detection system, the DET (Detection
Error Trade-off) curves and the EER (Equal Error
Rate) value are used. DET curves plots False Rejec-
tion Rate (FRR, in the Y-axis) versus False Accep-
tance Rate (FAR, in the X-axis), where the curve that
is closest to the left bottom corner of the graph cor-
responds to the system having the best performance
(Martin et al., 1997).
The verification experiments included 309 sam-
ples from at least 18 wood species, as shown in ta-
ble 2. First, 67 cedar samples were clustered in a
class, and 180 samples from other species were used
to fit the UBM with a 4-Gaussian mixture model. The
rest of the samples were used for validation: 17 cedar
samples and 45 impostors. We called cedar detec-
tion to this experiment. In the second experiment,
which we named 4-species detection, 159 wood sam-
ples were clustered into four classes (67 cedar sam-
ples, 37 moncoro samples, 21 pine samples, and 34
sapan samples). Again, samples of the other species
(86 samples) were used to fit the UBM with a 4-
Gaussian mixture model. The rest of the samples
were used for validation: 17 cedar samples, 10 mon-
coro samples, 6 pine samples, 9 sapan samples and
A Low Cost Electronic Nose with a GMM-UBM Approach for Wood Species Verification
337

Table 2: Samples per species used in this work.
Wood Species Scientific Name Number of wood blocks
Cedar Cedrela odorata 84
Moncoro Cordia gerascanthus 47
Pine Retrophyllum rospigliosii 27
Sapan Clathrotropis brunnea 43
Others
Tabebuia aurea, Zanthoxylum rhoifolium, Fraxinus
uhdei, Anacardium excelsum, Simarouba amara,
Cariniana pyriformis, Ficus spp., Quercus humboldtii,
Guarea guidonia, Coffea arabica, Alchornea
triplinervia, Corymbia citriodora, Swietenia
macrophylla, and others unknown.
108
22 impostors. For the first, as well as for the sec-
ond experiment, the PDF of each class representing a
particular timber species is modeled by a 4 Gaussian
mixture model. The EER value is estimated by using
a cross-validation procedure of 5-sets; where 80% of
timber samples corresponds to the training set, whilst
the remaining samples (20%) were used for valida-
tion. Each verification problem (one class vs. UBM,
and four clases vs. UBM) were analyzed from two
scopes: first, by using traditional feature extraction
methods followed by PCA dimensionality reduction;
and second, considering the full time series of the 16
curves.
3.1 Cedar Detection
In the first set of experiments, we apply a feature
extraction procedure, and six values were calculated
from each of the 16 curves. This process results in
a 96-dimensional feature vector for each sample, that
is, an X
309×96
matrix. In previously reported works,
principal component analysis (PCA) is typically used
to reduce the dimension and avoid over-fitting (Ak-
bar et al., 2016; Cordeiro et al., 2016). In the case
of this application, five principal components were
used to represent approximately 90% of the variance
in the original data. On the other hand, the validation
samples were compared against a single model of the
known class (cedar) and the UBM. In this way, it is
verified whether the analyzed sample belongs to the
cedar class or not. The verification with one class,
applying PCA, showed a classification error rate of
38.49% with a standard deviation of 7.02%. Figure 4
depicts the DET curve for this experiment.
Next, we consider the signal acquired by each of
the 16 sensors as a characteristic, forming a feature
16-dimensional feature vector. Then, each of the 400
samples obtained is considered as a frame, thus our
representation of a wood block smell-print is a 16 ×
400 matrix.
The results of the cedar class verification proce-
5 7 10 15 20 30 40 50 60
False Positive Rate (FPR) [%]
5
7
10
15
20
30
40
50
60
False Negative Rate (FNR) [%]
Figure 4: DET (Detection Error Trade-off) curve for one
class verification with Principal Component Analysis.
dure vs. the UBM, using the full time series, showed
a classification error rate of 24.18% with a standard
deviation of 7.71%. A DET (Detection Error Trade-
off) curve is shown in Figure 5.
3.2 4-Species Detection
The validation samples were compared with the four
models of the known classes (Cedar, moncoro, pine,
and sapan) and the UBM, and the LLR values are cal-
culated. In this way, it is verified whether the analyzed
sample belongs to one of the four known classes or
not. The verification with four classes, applying PCA,
showed a classification error rate of 47.72% with a
standard deviation of 3.79%. In Figure 6, it is shown
a DET (Detection Error Trade-off) curve.
Considering each of the 16 curves response as a
time series, we apply the verification procedure. The
results of the verification with four classes, using the
full time series, showed a classification error rate of
ICPRAM 2020 - 9th International Conference on Pattern Recognition Applications and Methods
338

5 7 10 15 20 30 40 50 60
False Positive Rate (FPR) [%]
5
7
10
15
20
30
40
50
60
False Negative Rate (FNR) [%]
Figure 5: DET (Detection Error Trade-off) curve for one
class verification with all data.
5 7 10 15 20 30 40 50 60
False Positive Rate (FPR) [%]
5
7
10
15
20
30
40
50
60
False Negative Rate (FNR) [%]
Figure 6: DET (Detection Error Trade-off) curve for four
class verification with Principal Component Analysis.
33.62% with a standard deviation of 4.14%. A DET
curve is shown in Figure 7.
In Table 3, it is presented a summary of the Equal
Error Rates (EER) for the experiments.
Table 3: Summary of Equal Error Rate for the experiments
carried out.
Target
Detection
Analysis
Mean
EER
Standard
deviation
Cedar PCA 38.49% 7.02%
Cedar Full series 24.18% 7.71%
4-species PCA 47.72% 3.79%
4-species Full series 33.62% 4.14%
5 7 10 15 20 30 40 50 60
False Positive Rate (FPR) [%]
5
7
10
15
20
30
40
50
60
False Negative Rate (FNR) [%]
Figure 7: DET (Detection Error Trade-off) curve for four
classes verification with all data.
4 DISCUSSION
The reported errors in this work are high, in con-
trast with high success rates reported in (Kalaw and
Sevilla, 2018; Cordeiro et al., 2016; Wilson, 2012).
However, it is important to take into account that
previous mentioned works use wood material, whose
aromas are fresh, strong and without major interfer-
ence. In addition, those reported works use controlled
conditions. By contrast, in this paper we use timber
samples, which are less fresh and have weaker aro-
mas. Although timber samples are more difficult to
classify, their conditions are closer to real situations
than those when using wood samples.
Furthermore, reference works performed wood
species identification tasks, which involves a limited
and closed number of species within which to clas-
sify a sample. On the other hand, we propose a ver-
ification procedure, more useful in practice, in which
a sample is compared with a reference model corre-
sponding to a species of interest. If a test sample does
not resemble the target class, it is said to belong to
another class; while in the identification processes, a
label of the defined classes must be assigned.
Wood species verification procedures are unusual,
less those approaches based on the aroma. Within the
search for information carried out for this work, there
are no reports about timber verification by smell. Our
proposal is to combine the use of electronic noses
and verification techniques, such as GMM-UBM, to
quickly determine whether a timber sample belongs
to a species of interest or not, based on its aroma. It
A Low Cost Electronic Nose with a GMM-UBM Approach for Wood Species Verification
339

is important to highlight the differences with data col-
lection methods reported in previous research works
related to the area, as well as the number of samples,
origin, species, pre-process, and previous storage of
the samples. The objective of this work is to ana-
lyze a greater dataset, with non-freshly sawn wood
samples and with non-rigorous storage conditions. It
allows establishing less distant from the real environ-
ment conditions for which the problem is sought to be
solved. With this being said, results within the scope
of this study are promising, as it shows that analyzed
signals contain important and discriminative informa-
tion for the task at hand.
Although it is used a larger number of samples
than in other reference works, the dataset is still non-
large enough. Furthermore, the approach of using a
verification scenario seems to be appropriate when
there is interest of targeting specific species in an en-
vironment where there could be some non-identified
species which are hard to label. In addition to this, it
would be necessary to explore other feature extrac-
tion techniques, for example, by exploring spectral
information using different time-frequency represen-
tations, and multi-channel approaches such as those
used in electroencephalogram (EEG) signal analysis.
As could be notice in the results presented herein, the
PCA approach performs worst that using the time se-
ries directly. It is also better to verify whether a sus-
picious sample belongs to a single species or not.
5 CONCLUSIONS AND FUTURE
WORK
It was proposed a method for smell-based wood
species detection by using a low cost electronic nose,
which is formed by an array of 16 chemical sen-
sors. Verification was carried out by using Gaussian
mixture modeling with Universal Background Model.
Verification procedures are a better option in practical
scenarios than identification procedures. As far as we
know, our work is the first approach that made use
of smell-prints from a biometric approach for wood
species detection .
Those wood samples used in state-of-the-art
works are fresh and then with still strong and intense
aroma. By contrast, we use timber samples that, al-
though are drier and have a weaker aroma, they rep-
resent in a better way the actual scenarios of illegal
logging. As a result, error rates are higher than re-
sults reported in the literature (Cordeiro et al., 2016;
Wilson, 2012; Kalaw and Sevilla, 2018).
Finally, there is no information about which are
those appropriate chemical sensors for this specific
application. Therefore, it is suggested, as future work,
to perform an analysis of volatile compounds that
compounds the aromas of the different wood/timber
species.
ACKNOWLEDGEMENTS
We are grateful to professor Iv
´
an Porras for his valu-
able comments in early stages of the experiment. This
work was financed in part by the research project
Plataforma IoT para el desarrollo de servicios in-
teligentes de apoyo al monitoreo ambiental–1971,
VIE- Universidad Industrial de Santander; and the
other part by E3T-Universidad Industrial de San-
tander, http://www.uis.edu.co.
REFERENCES
Akbar, M. A., Ait Si Ali, A., Amira, A., Bensaali, F., Be-
nammar, M., Hassan, M., and Bermak, A. (2016).
An empirical study for pca- and lda-based feature re-
duction for gas identification. IEEE Sensors Journal,
16(14):5734–5746.
Bishop, C. M. (2006). Pattern recognition and machine
learning. springer.
Cabral, E. C., Simas, R. C., Santos, V. G., Queiroga, C. L.,
Da Cunha, V. S., De S
´
a, G. F., Daroda, R. J., and
Eberlin, M. N. (2012). Wood typification by Venturi
easy ambient sonic spray ionization mass spectrome-
try: The case of the endangered Mahogany tree. J.
Mass Spectrom., 47(1):1–6.
Capelli, L., Sironi, S., and Del Rosso, R. (2014). Elec-
tronic Noses for Environmental Monitoring Applica-
tions. Sensors, 14(11):19979–20007.
Carmel, L., Levy, S., Lancet, D., and Harel, D. (2003).
A feature extraction method for chemical sensors in
electronic noses. Sensors and Actuators B: Chemical,
93(1):67 – 76. Proceedings of the Ninth International
Meeting on Chemical Sensors.
Cordeiro, J. R., Li, R. W. C., Takahashi,
´
E. S., Rehder, G. P.,
Ceccantini, G., and Gruber, J. (2016). Wood iden-
tification by a portable low-cost polymer-based elec-
tronic nose. RSC Adv., 6(111):109945–109949.
Dickson, A., Nanayakkara, B., Sellier, D., Meason, D.,
Donaldson, L., and Brownlie, R. (2017). Fluorescence
imaging of cambial zones to study wood formation in
Pinus radiata D. Don. Trees - Structure and Function,
31(2):479–490.
Doddington, G. R., Przybocki, M. A., Martin, A. F., and
Reynolds, D. A. (2000). The NIST speaker recog-
nition evaluation - overview, methodology, systems,
results, perspective. Speech Communication, 31(2-
3):225–254.
Fedele, R., Galbally, I. E., Porter, N., and Weeks, I. A.
(2007). Biogenic VOC emissions from fresh leaf
ICPRAM 2020 - 9th International Conference on Pattern Recognition Applications and Methods
340

mulch and wood chips of Grevillea robusta (Aus-
tralian Silky Oak). Atmos. Environ., 41(38):8736–
8746.
Figaro (2005). General information for TGS sensors.
Garneau, F. X., Riedl, B., Hobbs, S., Pichette, A., and
Gagnon, H. (2004). The use of sensor array technol-
ogy for rapid differentiation of the sapwood and heart-
wood of Eastern Canadian spruce, fir and pine. Holz
als Roh - und Werkstoff, 62(6):470–473.
Ghasemi-Varnamkhasti, M., Mohammad-Razdari, A.,
Yoosefian, S. H., Izadi, Z., and Rabiei, G. (2019).
Selection of an optimized metal oxide semiconduc-
tor sensor (mos) array for freshness characterization
of strawberry in polymer packages using response sur-
face method (rsm). Postharvest Biology and Technol-
ogy, 151:53 – 60.
Guo, L., Yang, Z., and Dou, X. (2017). Artificial Olfactory
System for Trace Identification of Explosive Vapors
Realized by Optoelectronic Schottky Sensing. Adv.
Mater., 29(5):1–8.
Hanssen, F., Wischnewski, N., Moreth, U., and Magel,
E. A. (2011). Molecular identification of Fitzroya cu-
pressoides, Sequoia sempervirens, and Thuja plicata
wood using taxon-specific rDNA-ITS primers. IAWA
J., 32(2):273–284.
Jolliffe, I. (2011). Principal component analysis. Springer.
Kalaw, J. M. and Sevilla, F. B. (2018). Discrimi-
nation of wood species based on a carbon nan-
otube/polymer composite chemiresistor array. Holz-
forschung, 72(3):215–223.
Kinnunen, T. and Li, H. (2010). An overview of text-
independent speaker recognition: From features to su-
pervectors. Speech communication, 52(1):12–40.
Martin, A., Doddington, G., Kamm, T., Ordowski, M., and
Przybocki, M. (1997). The det curve in assessment
of detection task performance. Technical report, Na-
tional Inst of Standards and Technology Gaithersburg
MD.
M
¨
uller, K., Haferkorn, S., Grabmer, W., Wisthaler, A.,
Hansel, A., Kreuzwieser, J., Cojocariu, C., Rennen-
berg, H., and Herrmann, H. (2006). Biogenic carbonyl
compounds within and above a coniferous forest in
Germany. Atmos. Environ., 40:81–91.
Rana, R., M
¨
uller, G., Naumann, A., and Polle, A. (2008).
FTIR spectroscopy in combination with principal
component analysis or cluster analysis as a tool to dis-
tinguish beech (Fagus sylvatica L.) trees grown at dif-
ferent sites. Holzforschung, 62(5):530–538.
Reynolds, D. A., Quatieri, T. F., and Dunn, R. B. (2000).
Speaker verification using adapted gaussian mixture
models. Digital signal processing, 10(1-3):19–41.
Reynolds, D. A. and Rose, R. C. (1995). Robust
text-independent speaker identification using gaussian
mixture speaker models. IEEE transactions on speech
and audio processing, 3(1):72–83.
Rinne, H. J. I., Guenther, A. B., Greenberg, J. P., and
Harley, P. C. (2002). Isoprene and monoterpene fluxes
measured above Amazonian rainforest and their de-
pendence on light and temperature. Atmos. Environ.,
36(14):2421–2426.
Rodriguez-Lujan, I., Fonollosa, J., Vergara, A., Homer, M.,
and Huerta, R. (2014). On the calibration of sensor
arrays for pattern recognition using the minimal num-
ber of experiments. Chemometrics Intellig. Lab. Syst.,
130:123–134.
Ruiz Jim
´
enez, L. F. (2018). Detecci
´
on de los insec-
tos de la subfamilia Triatominae basado en narices
electr
´
onicas. Technical report, Universidad Industrial
de Santander.
Santos, J. P. and Lozano, J. (2015). Real time detec-
tion of beer defects with a hand held electronic nose.
Proceedings of the 2015 10th Spanish Conference on
Electron Devices, CDE 2015, pages 1–4.
Shi, H., Zhang, M., and Adhikari, B. (2017). Advances of
electronic nose and its application in fresh foods: A
review. Crit. Rev. Food Sci. Nutr., 8398:1–11.
Wheeler, E. A. and Baas, P. (1998). Wood identification-a
review. IAWA journal, 19(3):241–264.
Wilson, A. D. (2012). Application of a Conductive Poly-
mer Electronic-Nose Device to Identify Aged Woody
Samples. The Third International Conference on Sen-
sor Device Technologies and Applications, pages 77–
82.
Wilson, A. D., Lester, D. G., and Oberle, C. S. (2005).
Application of conductive polymer analysis for wood
and woody plant identifications. For. Ecol. Manage.,
209(3):207–224.
Yan, J., Guo, X., Duan, S., Jia, P., Wang, L., Peng, C., and
Zhang, S. (2015). Electronic nose feature extraction
methods: A review. Sensors, 15(11):27804–27831.
Yu, M., Liu, K., Zhou, L., Zhao, L., and Liu, S. (2016).
Testing three proposed DNA barcodes for the wood
identification of Dalbergia odorifera T. Chen and Dal-
bergia tonkinensis Prain. Holzforschung, 70(2):127–
136.
A Low Cost Electronic Nose with a GMM-UBM Approach for Wood Species Verification
341
