
Lost and Found: Predicting Airline Baggage At-risk of Being Mishandled
Herbert van Leeuwen
1
, Yingqian Zhang
2 a
, Kalliopi Zervanou
2 b
,
Shantanu Mullick
2
, Uzay Kaymak
2 c
and Tom de Ruijter
3
1
Jheronimus Academy of Data Science, The Netherlands
2
School of Industrial Engineering, Eindhoven University of Technology, The Netherlands
3
KLM, The Netherlands
Keywords:
Baggage Transfer Process Model, Baggage At-risk Prediction, Gradient Boosting Machine.
Abstract:
The number of bags mishandled while transferring to a connecting flight is high. Bags at-risk of missing their
connections can be processed faster; however, identifying such bags at-risk is still done by simple business
rules. This work researches a general model of baggage transfer process and proposes a Gradient Boosting
Machine based prediction model for identifying the bags at-risk. Our prediction model is compared to the
current rule based method and a benchmark using logistic regression. The results show that our model offers
an increase in accuracy coupled with a marked increase in precision and recall when identifying bags that are
transferred unsuccessfully.
1 INTRODUCTION
The increase in airline passengers has put pressure
on the aviation industry infrastructure and processes,
especially in baggage management (SITA, 2018),
where a serious problem raised is mishandled bag-
gage, namely checked baggage that is delayed, dam-
aged, pilfered, lost, or stolen (SITA, 2018) and in
particular bags mishandled during connecting flight
transfer. Within this context, applications, such as
digital baggage tracking, not only facilitate baggage
tracing, but also create an opportunity for data-driven
operation support and priority shunting, where bag-
gage with short connection time are processed faster
(SITA, 2018). However, such solutions do not fully
address the problem because the process for transfer-
ring baggage is complex and involves a large degree
of uncertainty stemming from different factors, such
as arrival or departure punctuality of the aircraft, re-
assignment of aircraft aprons, changes in connection
times, availability of resources, customs checks, and
breakdowns of baggage handling systems. As a con-
sequence bags mishandled during the transfer process
account for about 47 percent of all mishandled bag-
gage worldwide (SITA, 2018).
a
https://orcid.org/0000-0002-5073-0787
b
https://orcid.org/0000-0001-9036-354X
c
https://orcid.org/0000-0002-4500-9098
Solutions typically involve ad-hoc interventions in
the baggage transfer process based on an estimation
of whether a bag will miss its connecting flight. This
throws up a major challenge, namely identifying such
bags at risk. For this purpose, digital baggage tracking
data could be used for developing a decision support
system (DSS) to identify bags in the transfer process
that are at risk of an unsuccessful transfer.
In this paper, we develop such a DSS in collab-
oration with an airline operating one of the biggest
transfer hubs in the world, processing approximately
10 million transfer baggage per year with a rate of
mishandled baggage of about 20 bags for every thou-
sand passengers and respective rectification costs of
more than 50 million euros a year. Based on Wirth
and Hipp (2000), we create a general model of the
baggage transfer process by systemically gathering
domain knowledge, using a combination of human
expert interviews and process observation. Subse-
quently, based on this process model and related lit-
erature, we extract a set of relevant features for a
machine learning model that predicts whether a bag
will have an unsuccessful transfer before the airplane
lands at the airport. In order to evaluate the im-
provement in the identification of unsuccessful bag-
gage transfers, we compare our model with the cur-
rent rule based method of identification used by hu-
man experts. In addition, we illustrate the motivation
for our complex model by comparing it with a logis-
172
van Leeuwen, H., Zhang, Y., Zervanou, K., Mullick, S., Kaymak, U. and de Ruijter, T.
Lost and Found: Predicting Airline Baggage At-risk of Being Mishandled.
DOI: 10.5220/0008977801720181
In Proceedings of the 12th International Conference on Agents and Artificial Intelligence (ICAART 2020) - Volume 2, pages 172-181
ISBN: 978-989-758-395-7; ISSN: 2184-433X
Copyright
c
2022 by SCITEPRESS – Science and Technology Publications, Lda. All rights reserved

tic regression model. The results show that our model
offers an increase in accuracy coupled with a marked
increase in precision and recall when identifying bags
that are transferred unsuccessfully.
The contribution of this paper lies in (i) the imple-
mentation of a machine learning technique in a unique
operational setting and assessment of its effectiveness
compared to conventional decision rule methods; (ii)
the development of a general baggage transfer process
model which can be used for the extraction of similar
features from baggage processes at other transfer hubs
facing the same challenge and may eventually allow
for comparative studies and data source acquisition
for the airline baggage management domain.
In the remainder of this paper, we first discuss re-
lated work on baggage handling, in Section 2. Then,
in Section 3, we present our formalised transfer bag-
gage model and the features resulting from the analy-
sis of this process and our data set. In Section 4, we
discuss the three models we experimented with in this
work, a model following the current business rules, a
logistic regression model and a Light-GBM model.
We finally conclude with an overview of our observa-
tions and results.
2 RELATED WORK
Current research reveals that most mishandled bag-
gage results from the transfer process (Alsyouf et al.,
2014; SITA, 2018). Work by Alsyouf et al. (2018)
shows that interventions in staff training, working
hours and conveyor system improvements may reduce
the problem. Despite these insights into causes and
possible improvements, these approaches focus in the
handling system, rather than the transfer baggage pro-
cess and its inherent uncertainty, a gap that our work
is attempting to address.
Beyond transfer baggage, other aspects of the bag-
gage handling system have been researched and im-
proved with innovations, such as new RFID tags (Ara-
bia, 2014), robotic loading of baggage and integrated
baggage handling systems (Faas, 2018), computer vi-
sion applications detecting baggage suitability (Gar-
ret, 2015), and use of autonomous baggage vehi-
cles (Smith, 2017; Vanderlande, 2019). These de-
velopments may improve the baggage handling per-
formance but they are costly and take time to im-
plement, whereas limited research currently exists in
approaches addressing mishandled bags issues using
existing infrastructure and resources. An example of
such an approach is a simulation study by Wuisman
(2016) aimed at identifying a better system feed in
strategy relating to short and long connection bag-
gage. Nevertheless, such approaches do not address
the uncertainty in the transfer process that leads to
mishandled bags.
Also, there has been recent research related to
airport operations management (Atkin et al., 2019).
However, they focus on other areas of airport opera-
tions related to gate assignment (Dijk et al., 2019), air-
craft landing and take-off coordination (Sam
`
a et al.,
2019), and design of baggage storage systems (Yalcin
et al., 2019). However, these papers do not speak to
the problem we are addressing.
Related research in similar logistics problems,
such as estimation of travel time has been shown to re-
duce transport cost and increase service quality (Lin,
Hong-en, 2005; Wei and Lee, 2007). Furthermore, the
road geometry, i.e., the route, has a significant impact
on the travel time (Lin, Hong-en, 2005; Wei et al.,
2003), while in situations with unstable traffic con-
ditions complex prediction models are essential (van
Grol et al., 1999; Tang et al., 2016).
In this paper, we propose a new technique to pre-
dict unsuccessful transfers of baggage with the use
of machine learning that permits us to deal with the
uncertainty inherent in the transfer baggage process.
We borrow from research related to the travel time
prediction that offers us several relevant features and
suggest the use of sophisticated modeling techniques.
Due to the absence of data on travel time of baggage
through the airport, we frame our problem as a classi-
fication algorithm to predict unsuccessful transfer of
baggage.
3 TRANSFER BAGGAGE
PROCESS AND FEATURE
EXTRACTION
In this section, we first develop a formalised gen-
eral transfer baggage process model following the
methodology of Wirth and Hipp (2000) for domain
knowledge elicitation. Subsequently, based on this
process model, we extract the features for our predic-
tion model.
3.1 Transfer Baggage Process
The transfer process consists of two main parts, (i) the
incoming and (ii) the outgoing transfer process.
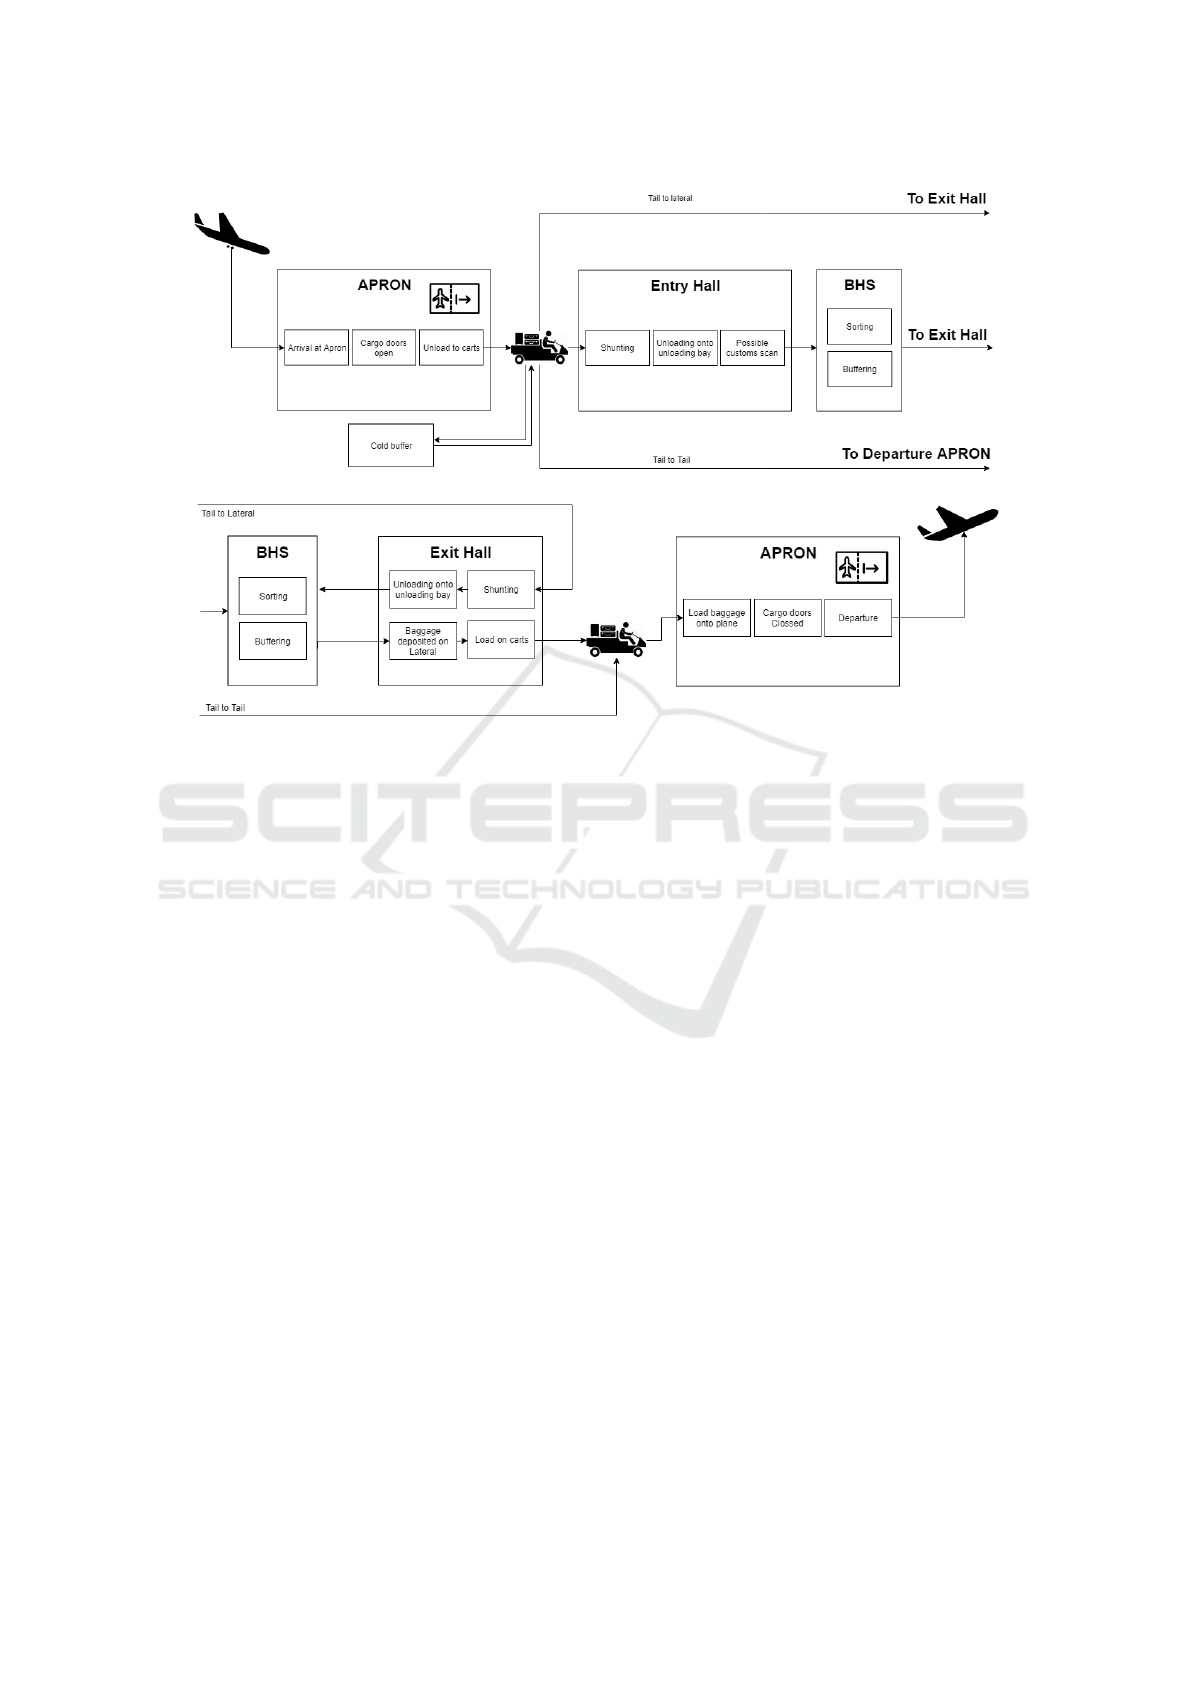
Figure 1a shows a detailed view of the incom-
ing transfer baggage process. After landing, the air-
plane arrives at the aprons, where aircraft are parked,
(un)loaded, refueled, or boarded. Apron Services
begins unloading the baggage. Then Baggage Ser-
Lost and Found: Predicting Airline Baggage At-risk of Being Mishandled
173
(a)
(b)
Figure 1: Incoming (a) and outgoing (b) transfer baggage flows.
vices loads the baggage onto separate carts depend-
ing on the airport baggage flow destination. The stan-
dard transfer flow goes from the apron to the entry
hall where baggage is shunt according to priority and
eventually loaded into the baggage handling service
(BHS), which is a conveyor system that sorts, buffers,
and transports the bags to the exit hall where the bag-
gage can be loaded on the aircraft.
Although the physical process starts with the ar-
rival of the plane, the decision process starts thirty
minutes before the plane lands. The baggage flow
controller (BFC) may consider some of the incoming
baggage to be at risk of an unsuccessful transfer based
on business rules. The BFC use their judgement to al-
ter the route of a bag flagged to be at risk.
The baggage route typically consists of the entry
point into the BHS (entry hall and unloading bay), and
the exit point from the BHS (exit hall and lateral, i.e.,
loading conveyor). The BFC may intervene in two
ways to change the baggage route; (i) a tail-to-tail in-
tervention entails that the baggage is directly trans-
ported to the apron of the outgoing flight, whereas
(ii) a tail-to-lateral intervention implies that the BFC
assigns the exit hall as entry hall for such baggage,
thereby reducing the time in the BHS. These inter-
ventions have a financial cost attached to them.
Figure 1b illustrates the main baggage flows of the
outgoing transfer baggage process. In the standard
transfer flow, the baggage is transferred from the en-
try hall, to the BHS, to the exit hall and to the apron,
whereas baggage in the tail-to-lateral flow is to be
shunted and unloaded directly in the exit hall instead
of the entry hall, where the BHS sorts and deposits
the baggage on the lateral. The processing time for
baggage following this tail-to-lateral flow is signifi-
cantly shorter. Subsequently, the baggage is loaded
onto carts and transferred to the apron by riders.
3.2 Feature Extraction
For building our prediction model, we collected his-
torical operational data from transfer baggage ser-
vices, spanning a 14 month period, from January 1st,
2018 to March 1st, 2019, where the last two months,
starting January 1st, 2019 are used for testing. The 48
in total identified features relate to two main aspects,
(i) process level features (ii) bag level features.
3.2.1 Process Level Features
These are features describing the overall state of the
BHS at the moment of handling. For this reason,
the month and hour of the day can be used as prox-
ies for several influences on the process. The month
and hour of the day are circularly encoded as de-
scribed in (1) and (2), where sin
time
and cos
time
stand
ICAART 2020 - 12th International Conference on Agents and Artificial Intelligence
174

Table 1: Class distribution in data sets.
Class No. instances Percentage
Training set
Normal bags 8.869.014 96.36%
Mishandled bags 334.789 3.64%
Test set
Normal bags 1.347.516 96.33%
Mishandled bags 44.059 3.17%
for the temporal value that is circularly encoded and
cardinality
time
, stands for the number of time units
we consider, e.g. days for a month unit, or hours for
a day unit. This circular encoding encapsulates the
circularity of time, thus making sure that the value of
December is closer to January than to September and
that the value of 12 am is closer to 1 pm (London,
2016).
sin
time
= sin(
2 ∗ π ∗ x
cardinality
time
) (1)
cos
time
= cos(
2 ∗ π ∗ x
cardinality
time
) (2)
The number of bags being processed by the BHS
at a specific time impacts the system’s performance.
In addition, Wei and Lee (2007) find that traffic data
can predict travel time. Because such data were not
available, we use the number of transfer passengers
and the number of transfer bags as a proxy for traffic
flow. Unfortunately, the data related to the workforce,
e.g., the number of baggage handling personnel at a
given time, could not be reliably extracted from our
data. For this reason, these features could not be used.
3.2.2 Bag Level Features
For every bag, the target label, normal or mishandled
is extracted from the data warehouse. As can be ob-
served in Table 1, the distribution of classes in the
data set is not balanced in both the train and test sets.
During training this class imbalance is dealt with (cf.
Sec.4).
Because data relating to customs checks and the
physical baggage dimensions are not available, we
use the incoming and outgoing outstations as prox-
ies for the type of baggage, the chance of customs
checks, and the load compliance of the outstations.
We also extract the inter-handler feature, namely the
airline code in the flight number.
From the scheduled and actual arrival and depar-
ture times, we extract several features: arrival delay,
scheduled connection time, and connection time ad-
justed for arrival delay. All three of these features are
created by subtracting the relevant timestamps from
each other. For arrival delay, we use the exact time
of delay (available post-hoc) which is not available
at the time when the BFC predicts a baggage may
not make the transfer successfully. However, our data
provider confirms that reasonably accurate estimation
of arrival delay is generally available.
With the extracted connection times and the flight
numbers, the connection type can be determined us-
ing some rules. First, if the scheduled connection time
is less than 90 minutes, the baggage is designated as
short-connection baggage and is given priority dur-
ing shunting and offloading. Second, based on the
the flight number, the bags are assigned as intercon-
tinental or European connection flights. The process
differs for these two types because most container-
ized baggage is intercontinental baggage. Container-
ization also depends on plane type. For this reason,
we also extract the plane type (wide- or narrow body).
An important subgroup of features related to bag-
gage is its route within the airport, as also indicated
in related research in logistics travel time estimation
problems (Lin, Hong-en, 2005; Wei et al., 2003).
The simplest implementation of route features is
including the aprons and entry and exit halls as cate-
gorical features. However, the number of unique com-
binations of these would be so big that the number
of samples in each combination would be too small
for proper model training. For this reason, continuous
features are preferred, by relating route parts to pro-
cessing times. We identify thus four different route
parts for which we can calculate the processing time
using our data set:
• Time to offload baggage into BHS (Offloading):
The time it takes to unload the baggage from the
plane and load it into the BHS. This time encom-
passes several actions: unloading, driving to the
hall, shunting, waiting, and loading into the BHS.
• Time in BHS (BHS): Time between BHS entry and
exit.
• Time to load baggage into airplane from BHS
(Loading): Time between BHS exit and departure
apron of the plane. This encompasses the load-
ing onto baggage carts, driving to the apron, and
loading into the plane.
• Time to open cargo doors (Cargo doors): The dif-
ference in time between the actual time of bag-
gage arrival and the opening of the airplane cargo
doors.
These processing times are extracted by subtracting
timestamps from each other. The processing times
differ depending on the assigned aprons and halls but
also depending on the time of day.
Combining these processing times should give an
unambiguous indication if a bag has made the trans-
fer. However, in reality, this data includes cases with
Lost and Found: Predicting Airline Baggage At-risk of Being Mishandled
175

negative loading time and cases with very long load-
ing times. In reality, not every bag loaded into the
system will make it in time to the lateral, or might be
wrongly sorted, or the flight might be delayed. Such
outliers in our processing times were filtered out.
Another issue related to these route times arises
from the fact that the moment at which we need
to predict the success of baggage transfer, typically
30 minutes before plane landing, the exact values of
these features are not yet known. For this reason, we
use the route processing times in the training set to
estimate the respective times in the planned route for
the test set (Lin, Hong-en, 2005).
Many factors influence the route of the baggage
and speed at which baggage services process bag-
gage. For example for the loading time, these factors
are the exit hall, the departure apron, connection type
(i.e., short connection and Europe or intercontinental
flights), and the hour of the day. For this reason, we
calculate an estimate of the processing time for each
unique combination of these factors. For an estima-
tion of a combination to be calculated, the combina-
tion has to occur more than 200 times. Thus, a single
batch of bags from a flight cannot set the estimate for
a combination. This number is based on the maxi-
mum quantity of bags from a single flight in the data
set. If a combination does not meet that threshold,
the median processing time of that process part is im-
puted by the pipeline before modeling. The median is
used rather than the mean because of the outlying val-
ues in the data set, so our estimation is less sensitive
to the lower and higher values still in the data set.
Table 2: Comparison of actual processing times and estima-
tions, Mean of Actual (A), Mean of the estimation (E) and
the mean absolute error (MAE).
Sub process Mean (A) Mean (E) MAE
Offloading 42.561 35.381 17.899
BHS 53.131 29.170 36.692
Loading 98.148 94.417 33.046
Cargo doors 1.949 1.877 0.946
The estimated processing times are compared to
the actual processing times in Table 2 using the mean
absolute error (MAE). The MAE values are high
when compared to the mean, indicating that this is
a rough estimate. We consider that this is due to our
occurrence threshold which filters out a lot of extreme
and incidental cases.
In addition, we check the relationships between
the individual features and the mishandled bag la-
bels. For the numerical features, the point biserial
correlation coefficients are used (Tate, 1954). For the
categorical features, we use the crammer’s V that is
a measure of association between two nominal vari-
ables, giving a value between 0 and 1 (Cramer, 1946).
The results are shown in Table 3 and Table 4, respec-
tively. Although logically the features should indicate
the chance of mishandled baggage, the correlations
metrics do not show any particularly predictive fea-
tures, implying that a more complex model is needed
to model the underlying complexities of the process.
Table 3: Categorical feature descriptions with Cramer V.
Feature Cramer V
Connection type 2.60E-01
LegTypeInbound 3.74E-02
OutStationIn 7.72E-02
AircraftTypeIn 5.10E-02
InBodyType 3.83E-02
GateCodeIn 4.98E-02
Entryhall 3.54E-02
LegTypeOutbound 5.58E-02
OutStationOut 8.09E-02
AircraftTypeOut 5.98E-02
OutBodyType 5.54E-02
GateCodeOut 6.22E-02
Exit hall 4.11E-02
Interhandeler clustered 3.25E-02
gate hall entry 8.59E-02
hall combination 6.14E-02
hall gate exit 1.44E-01
weekend 4.30E-04
season 1.06E-02
Holiday 4.88E-03
Night 2.15E-02
4 EXPERIMENTS AND RESULTS
For predicting whether a bag has been unsuccessfully
transferred, we train three models: a business rule
model, a logistic regression model, and a light gra-
dient boosting machine (Light-GBM) model. In this
section, we discuss these models, and compare their
prediction results.
We first prepare all features using a pipeline,
which treats the various data types differently:
• Numeric features are standardized by removing
the mean and scaling to unit variance.
• Categorical features are encoded according to the
model. For logistic regression we use one-hot
encoding whereas for Light-GBM we use ordi-
nal encoding (encoding strings as integers ranging
from 0 to [the number of unique values - 1]).
• Boolean features do not need to be prepossessed
as all models can handle them.
In order to address the class imbalance in our data
set, as illustrated in Table 1, we implement and com-
pare two sampling techniques: random oversampling
ICAART 2020 - 12th International Conference on Agents and Artificial Intelligence
176

Table 4: Numerical feature descriptions with point biserial correlation.
Feature Corr P value
Arrival Delay (min) 1.33E-01 < 1E-293
Departure Delay (min) -3.68E-03 6.22E-29
Scheduled connection time (min) -1.08E-01 <1E-293
Adjusted connection time (min) -1.30E-01 <1E-293
Est. Time to cargo doors open (min) 8.25E-02 <1E-293
Est. Offloading time (min) -3.93E-02 <1E-293
Est. BHS time (min) 8.71E-02 <1E-293
Est. Loading time (min) -1.23E-01 <1E-293
Month of year 9.16E-04 0.005476
Month of year circular (sin) -3.49E-03 3.57E-26
Month of year circular (cos) 9.17E-04 0.005392
Departure Weekday 3.12E-03 2.58E-21
Departure Weekday circular (sin) -2.24E-03 1.1E-11
Departure Weekday circular (cos) -9.25E-03 2.8E-173
Departure Hour of day -4.33E-02 <1E-293
Departure Hour of day circular (sin) 4.60E-02 < 1E-293
Departure Hour of day circular (cos) -1.99E-02 <1E-293
Arrival Weekday 3.12E-03 3.31E-21
Arrival Weekday circular (sin) -2.15E-03 6.97E-11
Arrival Weekday circular (cos) -9.28E-03 2.6E-174
Arrival Hour of day 2.16E-02 0
Arrival Hour of day circular (sin) -1.08E-02 3.1E-235
Arrival Hour of day circular (cos) -2.45E-02 < 1E-293
Total Pax 3.32E-03 8.06E-24
Transfer Pax 3.50E-03 2.37E-26
Total Bax 6.44E-03 5.18E-85
Transfer Bax 6.45E-03 2.56E-85
and random undersampling. Random oversampling
samples instances from the underrepresented class at
random until both classes are distributed evenly in
the data set, while random undersampling reduces
the over-represented class by removing instances ran-
domly until the classes are balanced. Both of these
sampling techniques have drawbacks. Oversampling
can lead to overfitting while undersampling can lead
to information loss (He and Garcia, 2009).
We evaluate the models using Overall Accuracy
metric, Recall of the class of unsuccessfully trans-
ferred bags, Precision of the class of unsuccessfully
transferred bags, and F1 score (i.e. the weighted har-
monic average of both recall and precision). These
metrics were deemed appropriate for our use case,
because it is essential to correctly identify as many
mishandled bags as possible without overgenerating
baggage at-risk predictions (Nguyen and Armitage,
2008; Fawcett, 2006). The model’s scores are op-
timized, by adjusting the classification threshold for
assigning a bag to the class of unsuccessfully trans-
ferred bags, to maximize the F1 score on the training
set. We also compare the models by inspecting the
distribution of predicted probabilities. The prediction
distribution of a proper classification model would be
a concave histogram with a peak on the left-hand side
indicating many predictions on the class of success-
fully transferred bags and a much smaller peak on the
right-hand side representing a small number of un-
successfully transferred bags. In addition, one would
expect, a low “valley” between the peaks to indicate a
limited number of ambiguous predictions.
4.1 Business Rule Model
The business rule model formalizes the current hu-
man experts method of identifying baggage at-risk.
The current method identifies these bags by applying
a set of rules based on the connection time between
the incoming and outgoing flight. Our business rule
model simulates the method of the BFCs by applying
their rules on the data. All transfer bags with a sched-
uled connection time of fewer than 55 minutes are im-
mediately assigned to a tail-to-tail intervention. Fur-
thermore, the BFC compares the adjusted connection
time with expected baggage processing times. How-
ever, currently the baggage processing time expecta-
tion differs per BFC.
The results of the rule-based model described in
Algorithm 1 are illustrated in Table 5. These show
that F1 score is just above 40% in both the test and
train sets. The performance of the business rule-based
model is good, considering its simplicity. However,
the number of false positives for the mishandled bag-
gage class is high, as also illustrated in the confusion
matrix depicted in Table 6, thus indicating that the
BFC examines more baggage than necessary.
Lost and Found: Predicting Airline Baggage At-risk of Being Mishandled
177
Algorithm 1: Business rule model.
Data: Data frame containing Bag ID and the
Adjusted connection time
Result: Returns list of probabilities for each
bag of becoming mishandled
initialization;
for each instance do
if Adjusted connection time < 60 then
Assign 100% probability;
else
Assign 0% probability;
end
end
Return Probabilities;
Table 5: Business rule model results.
Training set
Accuracy Score 0.957039
Recall score 0.436077
Precision score 0.414049
F1 score 0.424778
Test set
Accuracy score 0.960504
Recall score 0.437609
Precision Score 0.389777
F1 score 0.412310
Table 6: Confusion matrix of business rule model on test set
- MB: mishandled baggage.
Predicted Predicted
non-MHB MHB
Actual non-MHB 1294091 20517
Actual MHB 53322 23536
4.2 Logistic Regression
Logistic regression models are popular in different
fields because of their simplicity, ease of interpreta-
tion, and robustness (Kleinbaum and Klein, 2010).
We use the logistic regression model as a benchmark
for the complexity of the classification problem, since
it generally does not perform well for complex multi-
dimensional prediction problems. The logistic regres-
sion model was trained on all available features. We
present here the model trained with the undersampled
data set, because it had the best performance. After
training, the threshold for assigning an instance to the
mishandled baggage class, is optimised using the F1
score. The final results, with the optimal threshold
0.75, are illustrated in Table 7. The logistic regression
model performs worse than the business rule model in
both precision and recall. Closer examination of the
impact of individual features on predicted probabil-
Table 7: Logistic regression model results (using undersam-
pling & threshold optimised for F1).
Training set
Accuracy Score 0.944211
Recall score 0.403952
Precision score 0.301097
F1 score 0.345022
Test set
Accuracy score 0.956478
Recall score
0.313894
Precision Score 0.313126
F1 score 0.313510
ities in terms of logistic regression coefficient mea-
sure shows that continuous features, such as the ad-
justed connection time, which intuitively would have
the most significant impact on the probability of a bag
becoming mishandled has a low impact on the predic-
tion result, while categorical features with limited al-
ternative values have a more significant coefficient.
Given that the business rule model performs better
merely using the adjusted connection time, more fea-
tures logically adding information about the process
should have performed better. However, these results
indicate that logistic regression does not properly in-
corporate these features. For this reason, these results
indicate a need for a model that may capture the un-
derlying process of baggage transfer.
4.3 Light-GBM
Light-GBM is an improvement upon the Gradient
Boosting Decision Tree (GBDT), which provides
state-of-the-art performances for categorical predic-
tions (Friedman, 2001), and thus appropriate for pre-
dicting unsuccessfully transferred baggage. How-
ever, implementing GBDT with big data can be time-
consuming, and for our decision support system we
needed (i) a fast, easy to implement model for com-
plex interactions between variables describing the
process, and (ii) a model compatible with the exist-
ing software infrastructure of our data provider. For
this reason, we adopted the Light-GBM method pro-
posed by Ke et al. (2017), and used its Scikit-learn
implementation in Python.
To further optimize the performance of the model
we used the random-search algorithm. Bergstra and
Bengio (2012) showed randomized search to be more
efficient than grid-search and manual search. In Ta-
ble 8, an overview is provided of the parameters op-
timized to maximize the F1 score. The implemen-
tation of random-search used also incorporates strat-
ified k-fold validation to prevent overfitting. Only
three folds are used to minimize the computational
power needed.
ICAART 2020 - 12th International Conference on Agents and Artificial Intelligence
178
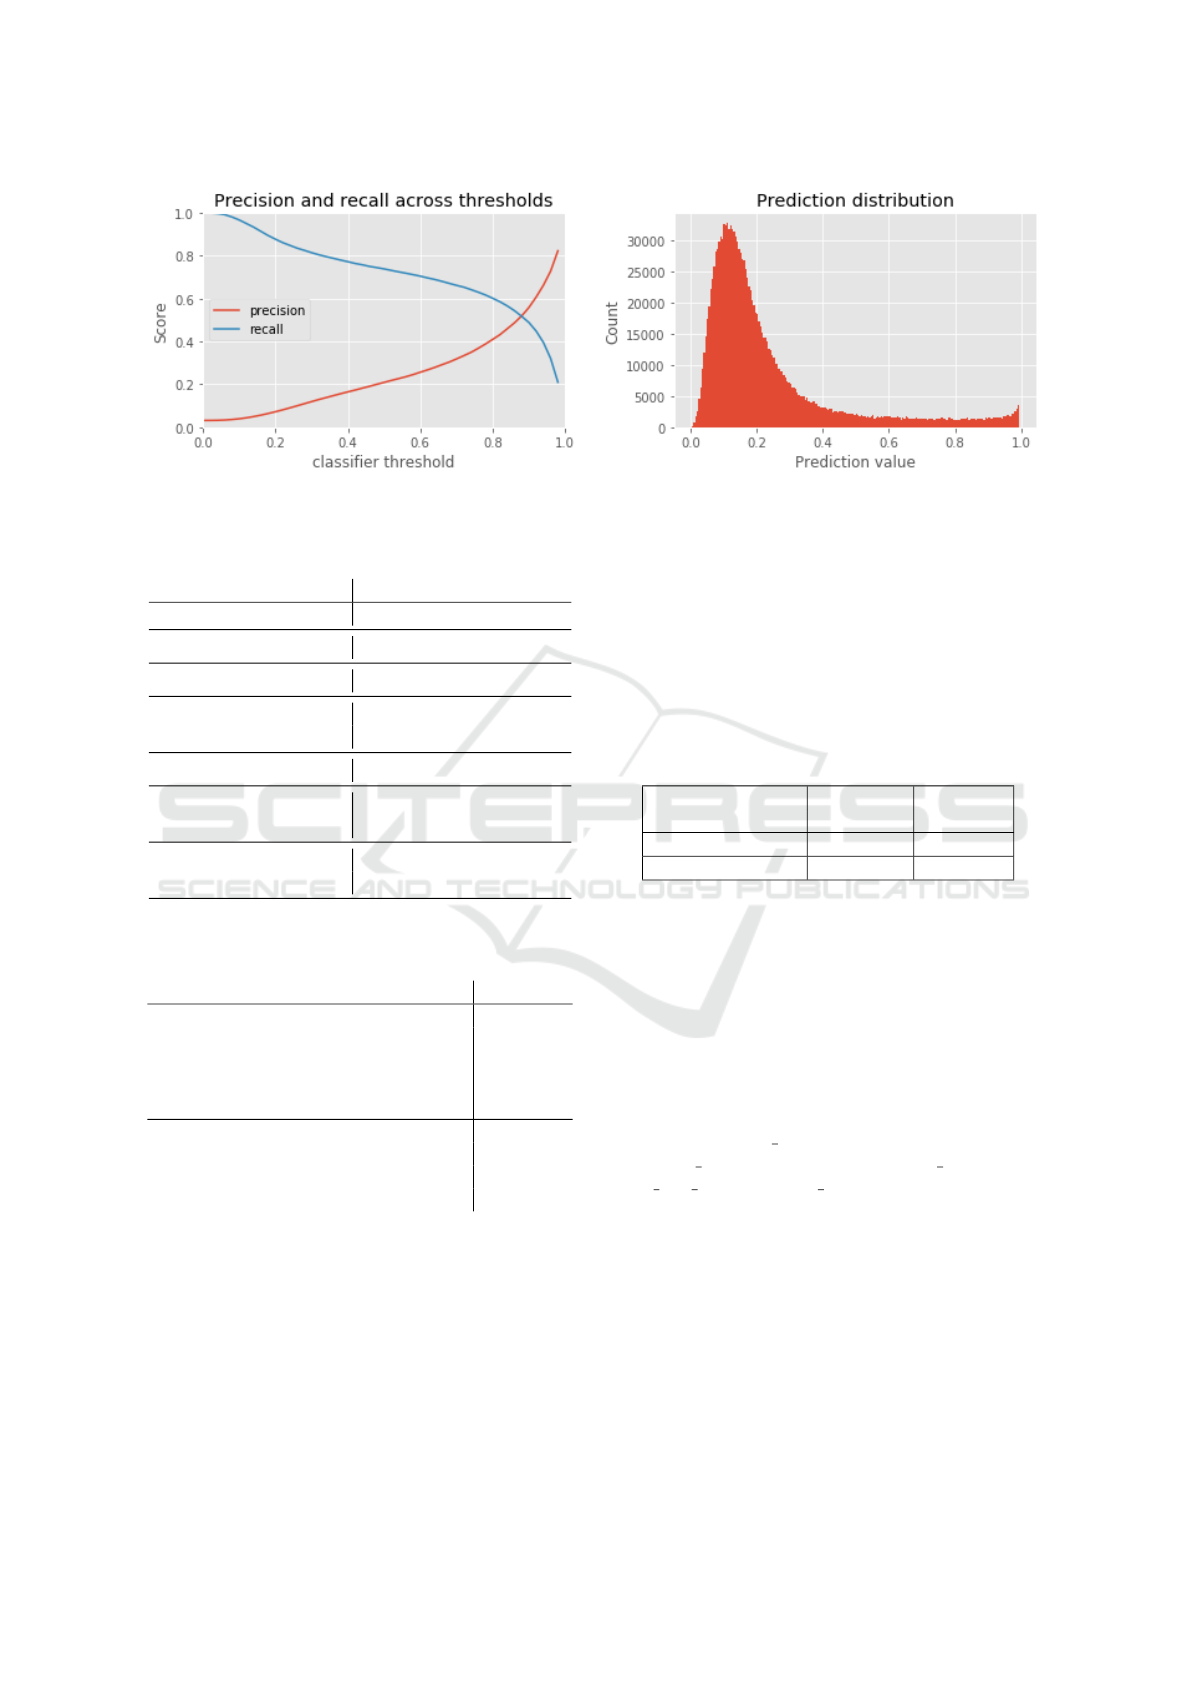
Figure 2: Prediction and recall over threshold; Prediction distribution for Light-GBM.
Table 8: Hyperparameters tuned in the Light-GBM models
(Microsoft Corporation, 2019).
Parameter Values
Number of estimators Range from 100 - 500
Number of leaves Range from 6 - 50
Min child samples Range from 100 - 500
Min child weight 1e-5, 1e-3, 1e-2, 1e-1,
1, 1e1, 1e2, 1e3, 1e4
Learning Rate 0.01, 0.1, 0.2, 0.3, 0.4, 1
Regularisation alpha 0, 1e-1, 1, 2, 5, 7,
10, 50, 100
Regularisation lambda 0, 1e-1, 1, 5,
10, 20, 50, 100
Table 9: Results for Light-GBM model (using oversampling
& optimal hyperparameters).
Training set
Accuracy Score 0.967760
Recall score 0.540973
Precision score 0.558704
F1 score 0.549696
Test set
Accuracy score 0.969334
Recall score 0.520351
Precision Score 0.515540
F1 score 0.517934
The model presented here is the Light-GBM
model with oversampled training set because it had
the highest performance of the random-searched
models. We train the Light-GBM model on all avail-
able features; then the threshold is optimized for F1
score and set to 0.9. The evaluation results are illus-
trated in Table 11. The Light-GBM model scores are
higher in every aspect compared to both the business
rule model and the logistic regression model. The
higher scores on the training set do imply some over-
fitting on the training set. Despite this slight over-
fitting, the F1 score of 52% is the highest for this
model. Both recall and precision scores are above
50%. Thus the model identifies more mishandled
bags while misidentifying less than the other models.
The confusion matrix for the test set in Table 10 leads
to the same conclusion.
Table 10: Confusion matrix for Light-GBM with optimized
threshold of 0.9 - MB: mishandled baggage.
Predicted Predicted
non-MHB MHB
Actual non-MHB 1326608 20805
Actual MHB 21351 22702
The prediction distribution in Figure 2 has the ex-
pected concave shape with a high peak on the left,
indicating many predictions with a low probability of
becoming mishandled and a small peak on the right
for the identified mishandled bags. This discrepancy
in peak sizes is expected because of the imbalanced
nature of the problem.
We investigate the feature importance in terms of
information gain. The top 10 features are: Adjusted
connection time, Scheduled connection time, OutSta-
tionOut, Hall-gate exit, ArriveDelay, OutStationIn,
estimated offloadingtime, estimated loadingtime,
gate hall entry, and hall combination. The adjusted
connection time is the main feature in terms of infor-
mation gain. This is expected due to the business rule
model. Compared to the adjusted connection time,
the other features have relatively little information
gain. However, most of the top 10 features relate
to the route through the airport. Especially the
features relating to the loading and unloading process
have high information gain. These features were
expected to have higher information gain because
they describe the sub-process creating the highest
number of mishandled bags.
Lost and Found: Predicting Airline Baggage At-risk of Being Mishandled
179

Table 11: Results for Light-GBM model (using oversam-
pling & optimal hyperparameters).
Critical instances of test set
Accuracy Score 0.898529
Recall score 0.565709
Precision score 0.506751
F1 score 0.534609
When we compare cases identified by the Light-
GBM and business rule models, we observe that the
Light-GBM model identifies 91% of the cases iden-
tified by the business rule model successfully. Fur-
thermore, the Light-GBM classifies 29% more cases
correctly compared to the business rule model while
having a significantly higher precision.
4.3.1 Performance on Critical Subgroup
To further analyze the performance of our model, we
evaluate its performance on the critical subgroup of
bags, known as short connection bags, namely bag-
gage with an adjusted connection time between 40-90
minutes.
1
In this critical subgroup of short connection bag-
gage, the mishandled bags are a larger percentage of
the total bags, namely 13% instead of 3% of bags. As
depicted in the results in Table 11 in this baggage sub-
group, our model performs slightly poorer in compar-
ison with the entire data set. In Figure 3 illustrating
the probability distribution of predictions for this sub-
group it can be observed that the model for this group
is a lot more ambiguous. This ambiguity is to be ex-
pected due to the importance of the adjusted connec-
tion time and because most mishandled bags are real-
ized in this subgroup. Therefore it becomes harder to
distinguish between the two classes and consequently
achieves lower performance scores. Nevertheless, this
model still comfortably outperforms the business rule
model.
Based on these results, we can conclude that the
features extracted using the generalized view of the
baggage process are predictive, especially the fea-
tures relating to the problematic parts of the baggage
process. Furthermore, we can conclude that a com-
plex model will identify more mishandled bags with
higher accuracy than the rule-based identification pro-
cess would. It is possible to intervene more precisely
using a machine learning model.
As discussed in Section 3.1, the BFC assesses the
risk of transfer baggage missing its connection un-
til 30 minutes before the plane lands and adjusts the
baggage route accordingly. At this stage, our model
1
The minimum connection time served by transfer bag-
gage services is 40 minutes.
Figure 3: Probability distribution of predictions on critical
subgroup.
can be implemented to supply the BFC with a prob-
ability of a non-successful baggage transfer. Our
model’s improved recall and precision in the iden-
tification of baggage at-risk, may assist the human
expert, the BFC in making more focused route in-
terventions. Moreover, as opposed to human expert
judgments, computer models are generally more con-
sistent in applying weights (Karelaia and Hogarth,
2008). Thus, baggage with a high probability of be-
coming mishandled would be more consistently con-
sidered for intervention and the intervention associ-
ated costs also reduced. At a later stage such interven-
tions could be automated and incorporate the transfer
baggage risk estimations and associated costs in rela-
tion to changes in the flight schedule.
5 CONCLUSION
We have shown that it is possible to improve the
identification of bags that are at risk of not mak-
ing their transfer connection using machine learning
techniques. The proposed Light-GBM model per-
forms better than the current identification business
rule based method in both precision and recall. The
results demonstrate how the current machine learn-
ing models can be used to increase the effectiveness
of baggage flow coordination by acting more targeted
due to better and more precise identification.
We discuss some areas of future work. A more
fine grained analysis of the baggage transfer process
can be done by including more complex features re-
lated to the route and processing time in the model.
In addition, some airports may also capture some in-
formation related to the baggage transfer process as
short unstructured texts. In such cases, recent NLP
methods, e.g. (Paalman et al., 2019), can be used to
extract information from these texts, which can sub-
sequently be incorporated as additional features in the
model.
ICAART 2020 - 12th International Conference on Agents and Artificial Intelligence
180

REFERENCES
Alsyouf, I., Humaid, F., and Al Kamali, S. (2014). Mishan-
dled baggage problem: Causes and improvement sug-
gestions. In Industrial Engineering and Engineering
Management (IEEM), 2014 IEEE International Con-
ference on, pages 154–158. IEEE.
Alsyouf, I., Kumar, U., Al-Ashi, L., and Al-Hammadi, M.
(2018). Improving baggage flow in the baggage han-
dling system at a UAE-based airline using lean Six
Sigma tools. Quality Engineering, 30(3):432–452.
Arabia, T. (2014). Lost luggage is history. Travel & Tourism
News Middle East, pages 1–2.
Atkin, J., Hoogeveen, H., and Stolletz, R. (2019). Airport
operations management. OR Spectrum, 41(3):613–
614.
Bergstra, J. and Bengio, Y. (2012). Random search for
hyper-parameter optimization. Journal of Machine
Learning Research, 13:281–305.
Cramer, H. (1946). Mathematical methods of statics.
Princeton Mathematical Series, University Princeton,
Princeton.
Dijk, B., Santos, B. F., and Pita, J. P. (2019). The recov-
erable robust stand allocation problem: a gru airport
case study. OR Spectrum, 41(3):615–639.
Faas, R. (2018). Case Study 70 MB: Amsterdam Airport
Schiphol. Technical report.
Fawcett, T. (2006). An introduction to ROC analysis. Pat-
tern Recognition Letters, 27(8):861–874.
Friedman, J. H. (2001). Greedy function approximation: A
gradient boosting machine. The Annals of Statistics,
29(5):1189–1232.
Garret, R. L. (2015). Baggage-scanning system minimizes
lost luggage. SITA Baggage report, 85:80–81.
He, H. and Garcia, E. (2009). Learning from Imbalanced
Data. IEEE Transactions on Knowledge and Data En-
gineering, 21(9):1263–1284.
Karelaia, N. and Hogarth, R. M. (2008). Determinants of
Linear Judgment: A Meta-Analysis of Lens Model
Studies. Psychological Bulletin, 134(3):404–426.
Ke, G., Meng, Q., Finley, T., Wang, T., Chen, W., Ma, W.,
Ye, Q., and Liu, T.-Y. (2017). LightGBM: A highly
efficient gradient boosting decision tree. In Guyon, I.,
Luxburg, U. V., Bengio, S., Wallach, H., Fergus, R.,
Vishwanathan, S., and Garnett, R., editors, Advances
in Neural Information Processing Systems 30, pages
3146–3154. Curran Associates, Inc.
Kleinbaum, D. G. and Klein, M. (2010). Logistic Regres-
sion – A Self-Learning Text. Statistics for Biology and
Health. Springer-Verlag New York.
Lin, Hong-en, A P Taylor, M. Z. R. (2005). A Review
of Travel-Time Prediction in Transport and Logistics.
Proceedings of the Eastern Asia Society for Trans-
portation Studies, 5(March):1433 – 1448.
London, I. (2016). Encoding cyclical continuous features -
24-hour time. https://ianlondon.github.io/.
Microsoft Corporation (2019). Parameters Tuning — Light-
GBM 2.2.4 documentation.
Nguyen, T. T. T. and Armitage, G. (2008). A survey of tech-
niques for internet traffic classification using machine
learning. IEEE Communications Surveys & Tutorials,
10(4):56–76.
Paalman, J., Mullick, S., Zervanou, K., and Zhang, Y.
(2019). Term based semantic clusters for very short
text classification. In Proceedings of the International
Conference Recent Advances in Natural Language
Processing 2019. Association for Computational Lin-
guistics (ACL).
Sam
`
a, M., D’Ariano, A., Palagachev, K., and Gerdts, M.
(2019). Integration methods for aircraft scheduling
and trajectory optimization at a busy terminal ma-
noeuvring area. OR Spectrum, 41(3):641–681.
SITA (2018). Air Transport Industry Insights - The Baggage
report. Technical report, Soci
´
et
´
e Internationale de
T
´
el
´
ecommunications A
´
eronautiques, Heathrowstraat
10, 1043 CH Amsterdam Netherlands.
Smith, J. (2017). GSE Technology Continues to Evolve.
Aviationpros.
Tang, J., Zou, Y., Ash, J., Zhang, S., Liu, F., and Wang,
Y. (2016). Travel time estimation using freeway point
detector data based on evolving fuzzy neural inference
system. PLoS ONE, 11(2).
Tate, R. F. (1954). Correlation between a discrete and a con-
tinuous variable. point-biserial correlation. The An-
nals of mathematical statistics, 25(3):603–607.
van Grol, R., Lindveld, K., Manfredi, S., and Danech-
Pajouh, M. (1999). DACCORD: On-line travel
time estimation/prediction results. In Proceedings of
Sixth World Congress on Intelligent Transport Systems
(ITS), Toronto, volume 37, pages 14–15.
Vanderlande (2019). FLEET - Vanderlande. Vander-
lande.com.
Wei, C., Lin, S., and Li, Y. (2003). Empirical validation
of freeway bus travel time forecasting. Transportation
Planning Journal, 32:651–679.
Wei, C. H. and Lee, Y. (2007). Development of freeway
travel time forecasting models by integrating different
sources of traffic data. IEEE Transactions on Vehicu-
lar Technology, 56(6 II):3682–3694.
Wirth, R. and Hipp, J. (2000). CRISP-DM: Towards a stan-
dard process model for data mining. In Proceedings of
the 4th international conference on the practical ap-
plications of knowledge discovery and data mining,
pages 29–39. Citeseer.
Wuisman, I. G. (2016). Simulating the performance of the
integral transfer baggage handling process at KLM.
Yalcin, A., Koberstein, A., and Schocke, K.-O. (2019). Mo-
tion and layout planning in a grid-based early baggage
storage system. OR Spectrum, 41(3):683–725.
Lost and Found: Predicting Airline Baggage At-risk of Being Mishandled
181
