
Fully Automated Volumetric Measurement of Malignant Pleural
Mesothelioma from Computed Tomography Images by Deep Learning:
Preliminary Results of an Internal Validation
Owen Anderson
1,3
, Andrew C. Kidd
2
, Keith A. Goatman
3
, Alexander J. Weir
3
, Jeremy Voisey
3
,
Vismantas Dilys
3
, Jan P. Siebert
1
and Kevin G. Blyth
2,4
1
School of Computing Science, University of Glasgow, 18 Lilybank Gardens, Glasgow, U.K.
2
Pleural Disease Unit, Queen Elizabeth University Hospital, 1345 Govan Road, Glasgow, U.K.
3
Canon Medical Research Europe, 2 Anderson Place, Edinburgh, U.K.
4
Institute of Infection, Immunity and Inflammation, University of Glasgow, 120 University Place, Glasgow, U.K.
Keywords:
Malignant Pleural Mesothelioma (MPM), Deep Learning (DL), Convolutional Neural Network (CNN),
Computed Tomography (CT), Image Segmentation.
Abstract:
Malignant Pleural Mesothelioma (MPM) is a cancer associated with prior exposure to asbestos fibres. Unlike
most tumours, which are roughly spherical, MPM grows like a rind surrounding the lung. This irregular shape
poses significant clinical and technical challenges. Accurate tumour measurements are necessary to determine
treatment efficacy, but manual segmentation is tedious, time-consuming and associated with high intra- and
inter-observer variation. In addition, uncertainty is compounded by poor differentiation in the computed
tomography (CT) image between MPM and other common features. We describe herein an internal validation
of a fully automatic tool to generate volumetric segmentations of MPM tumours using a convolutional neural
network (CNN). The system was trained using the first 123 CT volumetric datasets from a planned total of 403
scans. Each scan was manually segmented to provide the expert ground truth. Evaluation was by seven-fold
cross validation on a subset of 80/123 datasets that have full volumetric segmentations. The mean volume
of MPM tumour in these datasets is 405.1 cm
3
(standard deviation 271.5 cm
3
). Following three-dimensional
binary closing of the manual annotations to improve inter-slice consistency, the mean volume difference
between the manual and automatic measurements is 27.2 cm
3
, which is not significantly different from zero
difference (
p = 0.225
). The 95% limits of agreement between the manual and automated measurements
are between -417 and +363 cm
3
. The mean Dice overlap coefficient was 0.64, which is comparable with
inter-observer measurements reported elsewhere. To our knowledge, this is the first algorithm of its kind that
fully automates and evaluates measurement of the MPM tumour volume. The next step will be to evaluate the
method on the remaining unseen multi-centre evaluation set. Such an algorithm has possible future application
to pharmaceutical trials (where it offers a repeatable study end point) and to routine care (where it allows
tumour progression to be assessed rapidly to enhance therapeutic clinical decision making).
1 INTRODUCTION
Mesothelioma is a cancer associated with asbestos
exposure. Mesothelioma can occur in the abdomen
and testes, but the vast majority of cases (more than
90%) develop in the pleural space surrounding the
lungs (Attanoos and Gibbs, 1997) — this is known as
Malignant Pleural Mesothelioma (MPM).
The gold-standard measurement for any tumour
is volume, however surrogate metrics are often em-
ployed to reduce measurement time. For many tu-
mours, for example lung nodules, volume measure-
ment is straightforward because such tumours can be
assumed to be approximately spherical — an assump-
tion which is valid because, unimpeded, they tend to
grow isotropically. The assumption of sphericity un-
derpins the RECIST (Response Evaluation Criteria in
Solid Tumours) score (Schwartz et al., 2016), where
measurements of tumour diameter is sufficient to track
tumour development in response to treatment.
In contrast, however, MPM tumours develop like
a rind around the lungs, following the bounds of the
pleural cavity and adopting an irregular shape with a
high surface-to-volume ratio. To measure MPM, the
64
Anderson, O., Kidd, A., Goatman, K., Weir, A., Voisey, J., Dilys, V., Siebert, J. and Blyth, K.
Fully Automated Volumetric Measurement of Malignant Pleural Mesothelioma from Computed Tomography Images by Deep Learning: Preliminary Results of an Internal Validation.
DOI: 10.5220/0008976100640073
In Proceedings of the 13th International Joint Conference on Biomedical Engineering Systems and Technologies (BIOSTEC 2020) - Volume 2: BIOIMAGING, pages 64-73
ISBN: 978-989-758-398-8; ISSN: 2184-4305
Copyright
c
2022 by SCITEPRESS – Science and Technology Publications, Lda. All rights reserved

modified RECIST (or mRECIST) score is employed
(Byrne and Nowak, 2004). Rather than diameter, the
thickness of the tumour is measured at multiple loca-
tions perpendicular to the lung wall. The sum of these
thickness measurements at two time points are used
to generate an mRECIST report, that categorises the
tumour as either (Eisenhauer et al., 2009):
•
Complete Response (CR), indicating a disappear-
ance of all known disease;
•
Partial Response (PR), indicating a
30%
or more
decrease in the mRECIST score;
•
Stable disease/No change, indicating that no new
lesions have appeared, and the mRECIST score
has not significantly changed;
•
Progressive Disease (PD), indicating a
20%
or
more increase in the mRECIST score, or the ap-
pearance of new lesions.
The mRECIST score is known to exhibit poor intra-
and inter-annotator agreement (Yoon et al., 2016). One
component of this variability arises from ambiguities
in interpretation of the CT images, and another com-
ponent is from the highly heuristic nature of the mRE-
CIST scoring system.
Image Interpretation:
Labby et al. (Labby et al.,
2013) demonstrate that there is significant lack of con-
sistency among observers in area delineation of tu-
mours in single CT slices, a method of measurement
independent of the mRECIST score. They report a
95%
confidence interval between five observers span-
ning
311%
and
111%
for single time-point measure-
ments of baseline and response images respectively.
The research suggests that CT images of MPM are
inherently ambiguous and any measurements based on
such images are highly subjective.
Measurement Interpretation:
The heuristic and
sparse basis of the mRECIST score leads to noise
inherent to the measurement. A major component of
the variability between experts is the choice of sample
location, although Armato et al. (Armato et al., 2014)
demonstrate that even when experts are provided
with the coordinate locations at which to measure
tumour thickness, significant variation remains due to
choice of angle at which to make the one-dimensional
measurement.
The mRECIST measurement remains the clinical stan-
dard due to its feasibility — full volumetric tumour de-
lineations by multiple experts would result in the most
representative measurement of change (Frauenfelder
et al., 2011), but full three-dimensional delineation is
extremely time consuming.
1.1 Prior Work
The widely recognised inadequacy of current mesothe-
lioma measurements has resulted in development of a
number of algorithms, to automate or semi-automate
interpretation of CT images.
Chaisaowong et al. (Chaisaowong et al., 2013) de-
tect and delineate pleural thickening by modelling the
healthy pleura and differencing this with the CT im-
ages, followed by prediction refinement using a 3-D
Gibbs-Markov random field. Pleural thickening can
develop into MPM, and they report that this algorithm
could be used for early detection of the cancer. They
evaluate on 27 sites of pleural thickening, meaning it
is unclear whether the algorithm has the performance
required for the technically demanding application.
Sensakovic et al. (Sensakovic et al., 2011) aim to
segment a plural volume. They first segment the lung
parenchyma, then the hemi-thoracic cavity (with some
user input to inform the liver boundary delineation),
and based on this derive the pleural volume. They
report a median Jaccard index of 0.484 over 31 pa-
tients (which equates a Dice coefficient of 0.65), at
one time-point, providing analysis at the level of area
in randomly selected sub-sections of the 31 CT im-
ages, rather than across the totality of the CT images.
The median Jaccard index across the same subsections
when comparing three observers was 0.517 (equat-
ing a Dice coefficient of 0.68), a value similar to that
achieved by the semi-automated method.
Gudmundsson et al. (Gudmundsson et al., 2018)
describe their approach to segment plural thickening
from CT images in a fully automated fashion using
deep CNNs. First, the images are preprocessed to re-
move the patient couch and air from the CT image.
Following this, a U-Net is applied to delineate healthy
thoracic tissue from areas of pleural thickening, which
can include MPM tumour, plural effusion and pleural
plaques. The U-Net which is applied is a choice of
two, dependant on the laterality (left or right) of the
disease, which must be known in order to deploy the al-
gorithm. They report median Dice coefficients ranging
from 0.662 to 0.800 across two test sets (totalling 131
slices from 43 patients) and reference segmentations
of MPM tumour from three and five observers for the
two test sets. Across the same images, inter-observer
comparisons yielded median Dice coefficients ranging
from 0.648 to 0.814, similar to those achieved by the
automated method. Because the automated method
does not aim to differentiate MPM tumour from pleu-
ral fluid, the authors describe that 7 out of 15 outlier
slices where the algorithm over-predicts tumour area
contain pleural effusion.
Chen et al. (Chen et al., 2017) describe their
Fully Automated Volumetric Measurement of Malignant Pleural Mesothelioma from Computed Tomography Images by Deep Learning:
Preliminary Results of an Internal Validation
65

semi-automated approach for volumetric assessment
of mesothelioma from CT. The process depends on
20-30 seed points per slice, placed by an expert within
the area of MPM tumours, that are used to initialise a
random walk segmentation. The mean Dice coefficient
across 15 patients was reported to be 0.825.
Brahim et al. (Brahim et al., 2018) propose a semi-
automated volumetric method for MPM segmentation
based on identification of the thoracic cavity and sub-
sequent texture analysis to locate the tumoral regions.
Across 10 CT images, a Dice coefficient of 0.88 is
achieved.
The methods described by Chaisaowong et al.
(Chaisaowong et al., 2013) and Gudmundsson et al.
(Gudmundsson et al., 2018) aim to derive pleural thick-
ening, and Sensakovic et al. (Sensakovic et al., 2011)
semi-automate the delineation of a pleural volume.
A confounding factor in MPM development is pleu-
ral effusion. Differentiating MPM tumour from fluid
poses a technical challenge because the structures can
have overlapping values of Hounsfied Units in CT
images (Ng et al., 1999), however for quantitative
measurements of patient progression, e.g. tumour vol-
ume change, it becomes necessary for any automated
method to differentiate tumour from pleural effusion,
because the volume of fluid and tumour are unrelated.
This is explored in a later conference abstract (Gud-
mundsson et al., 2019).
The purpose of the current manuscript is to re-
port the preliminary findings of an ongoing effort to
develop a fully-automated method for volumetric seg-
mentation by deep learning. The data reported here are
the result of an internal validation in 108 patients (123
CT scans). To our knowledge there are, at present,
no other volumetric evaluations of a fully automated
system for the measurement of mesothelioma tumour
volume.
2 METHODOLOGY
A convolutional neural network was trained to segment
MPM tumour in CT datasets as part of a multi-centre,
retrospective cohort study funded by the Cancer Inno-
vation Challenge (Scottish Health Council). The study
will conclude in 2020 after analysis of 403 patients
with MPM previously recruited to two mesothelioma
research studies.
2.1 Data Selection
The automated system was trained and cross-validated
on 123 volumetric CT datasets from 108/403 subjects
recruited to the DIAPHRAGM and PRISM research
studies. All subjects had a confirmed histological
diagnosis of MPM.
DIAPHRAGM.
(Diagnostic and Prognostic Biomark-
ers in the Rational Assessment of Mesothelioma)
(Tsim et al., 2016) was a prospective, multi-centre,
observational study that recruited 747 patients over
3 years from 23 UK sites at first presentation of
MPM. A sub-group of 23/747 patients (who had
contemporaneous CT and MRI scans) were selected
for this study. All the images used from this study
were acquired pre-treatment. The MR images are
helpful in disambiguating confounding features in the
CT images.
PRISM.
(Prediction of ResIstance to chemotherapy
using Somatic copy number variation in Mesothe-
lioma) (Blyth et al., 2018) is an ongoing retrospective
cohort study, in which the primary objective is
to determine a genomic classifier that predicts
chemo-resistance in MPM. It involves retrieval of
tumour blocks and CT images before and after
chemotherapy in 380 patients with MPM from five
UK centres. 123 CT images from 85/380 PRISM
subjects are included in this study (43 images acquired
pre-treatment, and 80 images acquired post-treatment).
All of the CT volumes utilised in this project are
from centres across Glasgow. Images from the DI-
APHRAGM study were typically acquired earlier in
the patient care pathway than those from the PRISM
study. Consequently the tumour volumes tend to
be smaller and thinner in the DIAPHRAGM study
volumes. This difference is illustrated in figure 1,
that shows slices from a DIAPHRAGM and PRISM
dataset.
2.2 Seven-fold Cross-validation
The internal validation is in the form of
k
-fold cross
validation, where the value
k = 7
was chosen to max-
imise the amount of training data available for each
model, whilst providing robust group statistics for each
test set. The data splits during the seven-fold cross val-
idation were complicated by the sparse ground truth
segmentations, which although they were suitable for
training could not be used to measure volume accuracy.
The sparse datasets were included in the training sets
for all seven folds.
The training data was divided as follows. Of
the 123 annotated datasets, 80 were fully annotated
(pre-treatment) and 43 were sparsely annotated (post-
treatment). The 80 fully annotated datasets were ran-
domly assigned to seven folds, consisting of 11 or 12
BIOIMAGING 2020 - 7th International Conference on Bioimaging
66
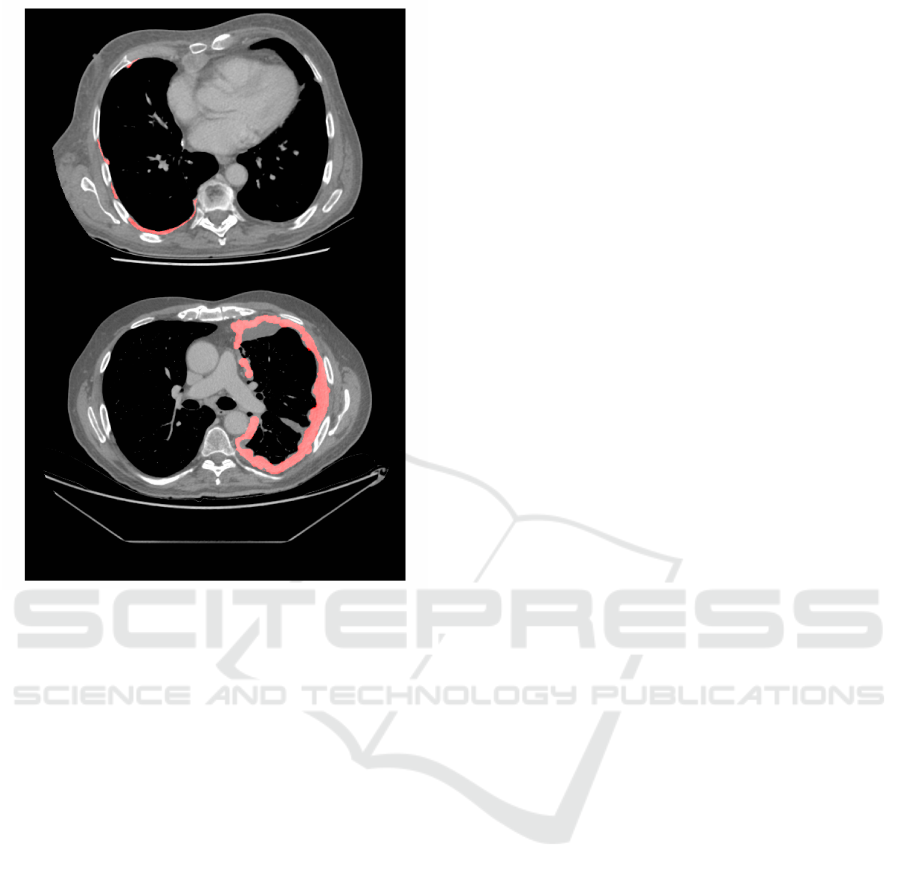
Figure 1: Two axial CT slices from two subjects in the
cohort, with manually derived MPM tumour segmentation
shown in red. Top: A slice from a CT image taken in the
DIAPHRAGM study. Bottom: A slice from a CT image
taken in the PRISM study. The unsegmented areas (in grey)
represent adjacent pleural fluid.
datasets per fold. During evaluation of each fold the re-
maining six folds were divided by a 30:70 split respec-
tively between a set used to select the best performing
model and determine the optimal model threshold, and
the training set (to which the 43 sparsely annotated
volumes were also added).
Since neighbouring slices in the CT images are
highly correlated, including all the slices in training
can lead to over-fitting to the datasets with more slices.
To counter this the fully segmented volumes are also
sparsely sampled during training, using 100 slices per
volume.
2.3 Ground Truth
2.3.1 Ground Truth Generation
In total 123 CT volumes were manually segmented by
a respiratory clinician with training in mesothelioma
identification and image analysis. The volumes were
annotated using Myrian software (Intrasense, Paris).
For 80 of the CT datasets every slice containing MPM
was annotated to provide a full segmentation of the
tumour. Since an interim analysis suggested that ad-
jacent slices are highly correlated a more sparse an-
notation was performed for 43 datasets, where only
every fifth slice was annotated. The sparse annotation
enabled more subjects to be included in the training
set, increasing the diversity of the training population
for considerably less effort. Since adjacent slices are
highly correlated, there is little disbenefit to training
with sparser slices. However, the sparse annotations
in these datasets mean these datasets were not suitable
to evaluate volume accuracy, and were not included in
the accuracy metrics.
2.3.2 Ground Truth Inter-slice Consistency
Processing
The manual annotation of the tumour was performed
in the axial plane. Interim results suggested this could
lead to inconsistencies between slices, where the dis-
continuous nature of the annotations when viewed in
the orthogonal sagittal and coronal planes contrasts
with the contiguous nature of the tumour when viewed
in the plane of annotation (figure 1). This between-
slice inconsistency can have a significant effect on
volumetric measurements.
For this reason inter-slice inconsistencies were re-
duced using a three-dimensional binary closing opera-
tion having an
11 × 11 × 11
voxel structuring element.
In addition to reducing inter-slice inconsistency, holes
in the MPM tumour smaller than five voxels in diame-
ter will be closed. The downside to this processing is
that genuine holes in the tumour drawn by the annota-
tor will be removed.
2.4 Convolutional Neural Network
Architecture
A Convolutional Neural Network (CNN) with a U-Net
architecture (Ronneberger et al., 2015) was trained for
mesothelioma segmentation — similar to the method
proposed by Gudmundsson et al. (Gudmundsson et al.,
2018). Specifically, our network arcutechture is a mod-
ified 2-D U-Net which consumes three consecutive
axial slices at a time, and returns the segmentation of
the central slice. The encoder portion of the U-Net
employs a VGG classifier, which has been pre-trained
on the ImageNet challenge data (Jia Deng et al., 2009)
— the three consecutive axial slices are fed into what
were the red, blue and green colour channels of the
pre-trained network. CT image intensities input to
the network are clipped to [-1050, +1100] Hounsfield
Units, and normalised to range [-1, +1]. All network
activations are rectified linear units, aside from the
Fully Automated Volumetric Measurement of Malignant Pleural Mesothelioma from Computed Tomography Images by Deep Learning:
Preliminary Results of an Internal Validation
67
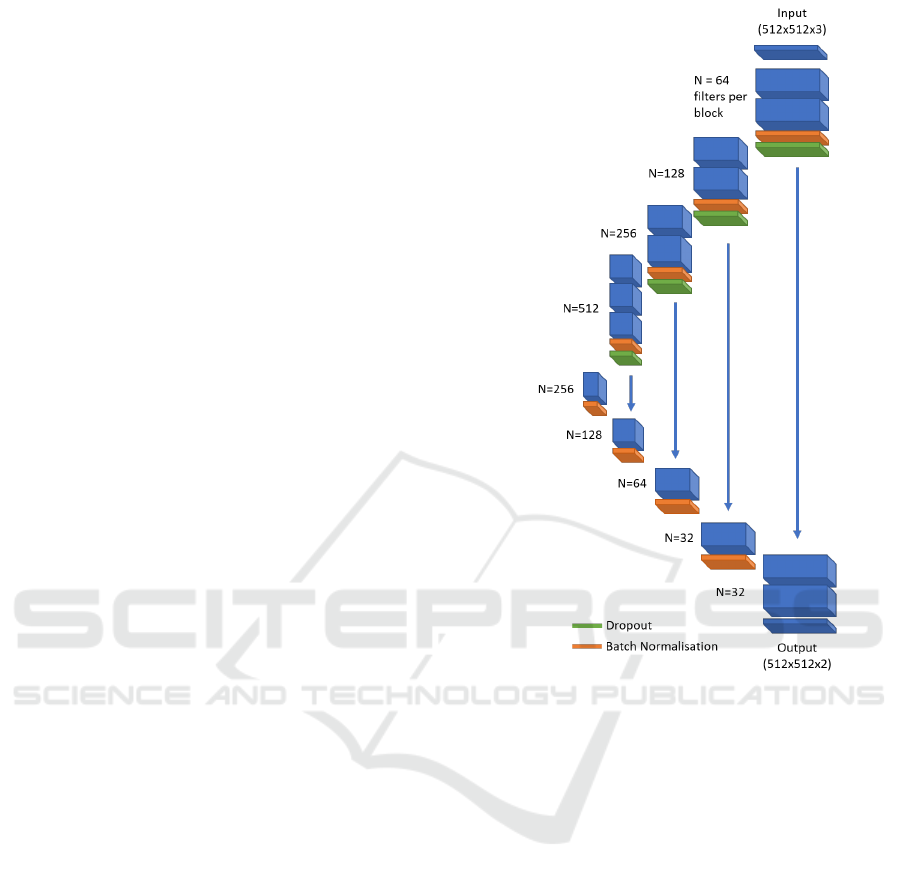
ultimate layer of the network, for which a softmax
activation is used. The algorithm is shown schemati-
cally in figure 2, and was implemented using the Keras
framework (Chollet, 2015).
The raw output of the model is a predicted prob-
ability of MPM tumour for every voxel in the input
CT volume. To evaluate total volume measurements,
this output is binarised by applying a threshold. The
threshold which results in the best performance varies
slightly between models — different training datasets
have varying levels of complexity, leading to models
which predict in varying probability ranges, specific
to each model. After the model has converged, the
images in the internal validation set are used to deter-
mine the optimal algorithm threshold. Across these
subjects, the threshold was optimised to provide the
highest mean Dice coefficient between the binarised
prediction and ground truth annotation.
The Adam optimiser is used, with a cyclic learn-
ing rate (Smith, 2017), where the learning rate (
lr
)
has been set to oscillate between
lr = 0.0001
and
lr = 0.003
, with a full cycle duration of one epoch.
The algorithm consumes three axial slices, at their
original resolution (which is typically within the range
0.71 mm to 1.34 mm). Dropout (with a rate of 0.2)
(Srivastava et al., 2014) and batch normalisation (Ioffe
and Szegedy, 2015) are used at the locations illustrated
in figure 2. For our experiments, the batch size was set
to 8 slices (with context) per batch, allowing the model
with 10,019,874 parameters to train on the available
GPU.
Categorical cross-entropy was selected for the ob-
jective function, despite being a binary classification
task. The output of the network is therefore two chan-
nels: one representing tumour, and the other represent-
ing background. This objective function was selected
to improve convergence over that achieved using bi-
nary cross-entropy. Due to the random ordering of
the slices during training, the first few batches may be
predominantly tumour negative. In this case binary
cross-entropy tends to result in weights at the decoder
rapidly tending towards zero, at which point conver-
gence halts as gradients no longer propagate through
the network. In contrast, by using categorical cross-
entropy, a non-zero signal is always required in one of
the two output channels, regardless of the class balance
of that example slice. This decreases the likelihood
that weights will tend to zero in the early stages of
training, increasing the repeatability of experiments
between runs and folds of analysis.
The network is trained for 30 epochs, after which
the best model is selected based on the average voxel-
level accuracy for the internal validation set.
Figure 2: A schematic of the U-Net model architecture. The
blue boxes represent a stack of convolutional filters, with
the number of filters per stack shown to the left of each box.
All filters have a dimensionality of
3 × 3
. Green and orange
boxes represent dropout and batch normalisation layers re-
spectively. The blue arrows represent skip connections by
feature concatenation.
2.4.1 Tumour Volume
At the validation stage, the algorithm is used to predict
MPM tumour presence for every slice of the CT vol-
umes in the validation set, to generate a full volumetric
segmentation of the tumour. The tumour volume is
calculated as follows:
M(x, y, z) =
(
1 if P(x, y, z) > t
0 else,
(1)
where
M
describes a mask image of same dimension-
ality as the input CT image, with each voxel assigned
a binary value of one to indicate MPM tumour and
zero elsewhere.
M
is calculated by evaluating the
probability map (
P(x, y, z)
) with respect to the optimal
threshold,
t
. These binary maps are then converted
into measurements of tumour volume (
V
) by summing
BIOIMAGING 2020 - 7th International Conference on Bioimaging
68
across the CT image, and multiplying by the voxel
volume of the CT image,
V = S
x
S
y
S
z
X
∑
x=0
Y
∑
y=0
Z
∑
z=0
M(x, y, z), (2)
where
S
x
,
S
y
and
S
z
denote the voxel sizes in x,y and z
respectively.
2.5 Validation Metrics
Since only images from a single time point are avail-
able for each study subject in this preliminary eval-
uation we are unable to evaluate the volume change
accuracy. Instead, segmentation accuracy and absolute
volume correspondence between the algorithm and the
manual observer are evaluated here.
2.5.1 Agreement (Bland-Altman)
Volumetric agreement between the manual and auto-
mated volumetric segmentations was determined us-
ing Bland-Altman analysis (Martin Bland and Altman,
1986). This plots the difference between the two mea-
surements versus the mean of the two measurements.
The following statistics were derived from this analy-
sis:
1.
The mean difference (or bias) between the two
measurement methods
2.
A test whether the mean difference between the
two measurement methods is significantly different
from zero. This was determined using a two-sided
paired
t
-test (MATLAB statistics toolbox, Math-
works, Natick).
3.
The 95% limits of agreement (Martin Bland and
Altman, 1986).
4.
A test whether the difference between the mea-
surement methods increases (or decreases) as the
tumour volume increases. This was determined
from the slope of a least squares regression fit to
the points in the Bland-Altman plot. Specifically
it tests whether the slope is statistically different
from a zero gradient, based on a
t
-statistics (MAT-
LAB statistics toolbox, Mathworks, Natick).
2.5.2 Region Overlap (Dice)
Whilst volumetric agreement is important, as it is the
physical property of interest, alone it does not guaran-
tee that given identical volumes the same two regions
have been delineated, indeed it does not prove they
even intersect. To determine the overlap between the
manual and automated regions the Dice score was cal-
culated (the Dice coefficient is equivalent to the F1
score).
3 RESULTS
The prediction time using the algorithm on the full
resolution CT datasets was approximately one minute
per volume, using an Nvidia 1080Ti graphics process-
ing unit (GPU), 32 GB of RAM and a 12-core Intel
Xeon CPU (3.40 GHz). Manual annotation time varied
between subjects, taking approximately 2.5 hours per
volume.
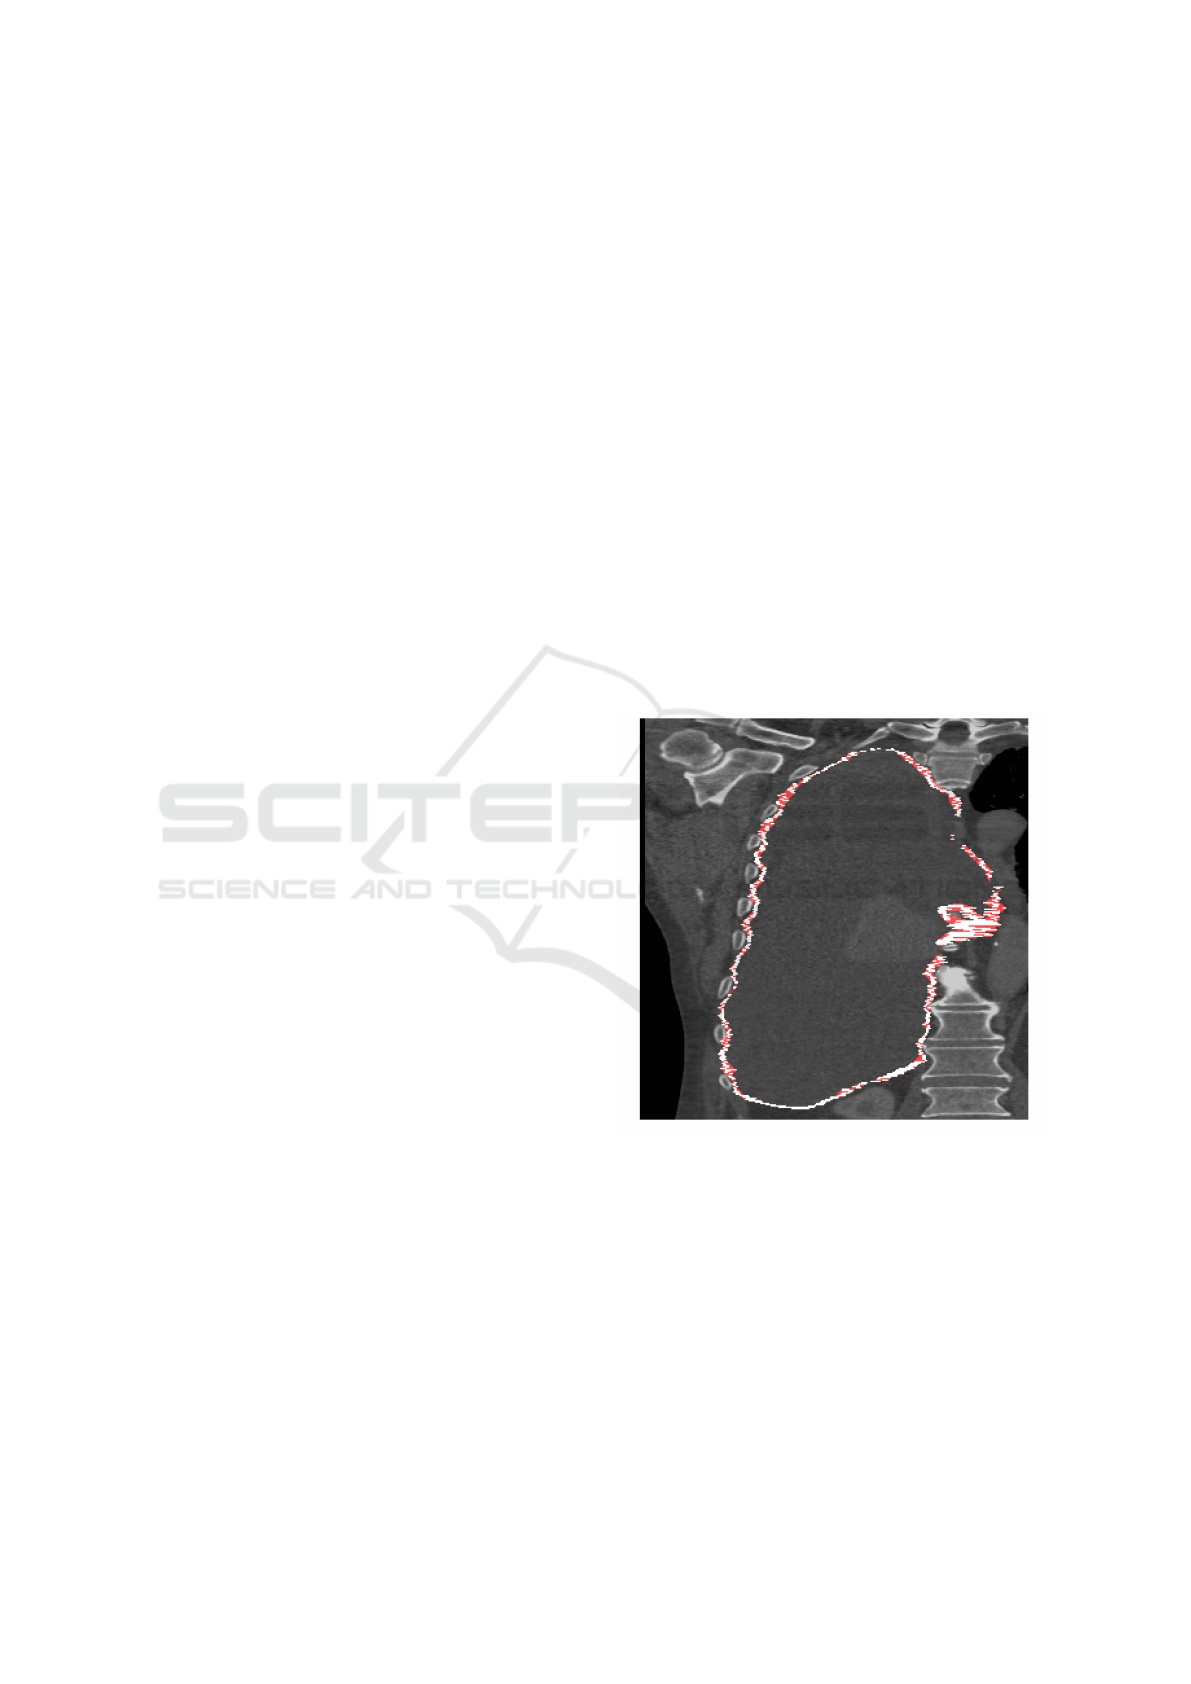
3.1 Inter-slice Consistency Processing
As described in section 2.3.2, three-dimensional binary
closing was proposed to improve inter-slice manual
segmentation consistency. Figure 3 shows a typical
binary closing result, highlighting the additional vox-
els added by the closing operation. Note how, at least
visually, the closed version appears more contiguous
and physically more plausible. Following closing the
detected plural volume in the cohort increases from
301.1 cm
3
(standard deviation 263.9 cm
3
) to 514.7 cm
3
(standard deviation 336.1 cm
3
).
Figure 3: A CT coronal view of a subject with MPM, show-
ing the right lung. The white annotation indicates the loca-
tion of tumour, as drawn by an expert annotator in the axial
plane, which follows the bounds of the pleural cavity, sur-
rounding a region of pleural effusion. Red shows the regions
which are closed by a binary closing operation.
3.2 Volumetric Agreement
The mean predicted volume for the cohort over the
seven-fold analysis was 547.2 cm
3
(standard deviation
290.9 cm
3
).
Fully Automated Volumetric Measurement of Malignant Pleural Mesothelioma from Computed Tomography Images by Deep Learning:
Preliminary Results of an Internal Validation
69
3.2.1 Raw Manual Annotations
The mean tumour volume in the raw manual segmen-
tations is 405.1 cm
3
(standard deviation 271.5 cm
3
),
which is significantly lower than the automatically de-
tected volume. Figure 4 shows a Bland-Altman plot
representing how the volume error varies with tumour
volume. Here the manual measurement is the raw
ground truth annotation (i.e. without the binary clos-
ing operation to increase consistency between slices).
A minor, though statistically significant, trend is ob-
served where the volume error increases slightly with
tumour volume (
p < 0.001
). This indicates that the
algorithm, on average, tends to over-segments the tu-
mour compared with the raw ground truth.
3.2.2 Closed Manual Annotations
Following binary closing the mean tumour volume of
the manual segmentations increased to 574.4 cm
3
(stan-
dard deviation 327.1 cm
3
). Figure 5 shows the Bland-
Altman plot using the closed annotations, indicating
a mean difference of -27.2 cm
3
, which is not signifi-
cantly different from zero mean difference (
p = 0.225
).
The upper and lower 95% limits of agreement are [-
414.2, +360.5] cm
3
, respectively. For ease of compari-
son to other methods, the results are equivalent to 95%
limits of agreement which span 129.2% of the total
tumour volume.
In figure 5 four of the measurement differences are
outliers, i.e. outside of the 95% limits of agreement:
one represents under-segmentation compared with the
ground truth, while the other three represent over-
segmentations. Inspection of the under-segmentation
case found that the MPM tumour in this image is un-
usually thick compared with the other images in the
training cohort. It is likely the algorithm fails to gen-
eralise to this degree of thickening, previously un-
seen during training. For the remaining three outliers,
where the algorithm over-segments with respect to the
ground truth, inspection finds extremely narrow tu-
mour in these images. The algorithm often identifies
the bulk of the tumour mass (where it is thicker and
more visible), but does not propagate the tumour into
the rind-like surface which, although narrow, encloses
a significant proportion of the lung surface area. This
is potentially where the slice-based nature of the ap-
proach limits performance. A fully 3D CNN approach
may offer higher accuracy in such cases.
3.3 Region Overlap (Dice Score)
Analysis of the Dice coefficient shows significant vari-
ation between subjects (presumably reflecting the fact
that some datasets are simply more difficult to segment
0 250 500 750 1000 1250 1500
Mean of both measurements
-800
-600
-400
-200
0
200
400
600
800
1000
Difference between measurements
Figure 4: Bland-Altman analysis of the algorithm-annotator
agreement for tumour volume measurements, across
80
sub-
jects. The central dashed line indicates a mean difference
of
142.2
cm
3
over-segmentation by the algorithm. Outer
dashed lines indicate upper and lower 95% limits of agree-
ment of [−224.1, +508.5] cm
3
respectively.
0 200 400 600 800 1000 1200 1400 1600 1800
Mean of both measurements
-1200
-1000
-800
-600
-400
-200
0
200
400
600
800
Difference between measurements
Figure 5: Bland-Altman analysis of the algorithm-annotator
agreement for tumour volume measurements across
80
sub-
jects, using cleaned ground truth. The central dashed line in-
dicates a mean difference of
−27.2
cm
3
under-segmentation
by the algorithm. Outer dashed lines indicate upper and
lower 95% limits of agreement of [
−414.2
,
+360.5
] cm
3
respectively.
than others) and between analysis folds (i.e. some mod-
els work better than others, depending on the combina-
tion of datasets used to train them). The mean overall
Dice coefficient is 0.64 (standard deviation 0.12) us-
ing the binary closed ground truth. In comparison,
the Dice score is 0.55 (standard deviation also 0.12)
versus the raw ground truth, confirming higher voxel-
wise correspondence following binary closing to im-
prove inter-slice consistency. The standard deviation
reflects the wide range of tumour shapes and volumes
in this dataset (c.f. section 2.1). Figure 6 shows the
ground truth and predicted tumour for a subject from
the PRISM sub-cohort.
BIOIMAGING 2020 - 7th International Conference on Bioimaging
70
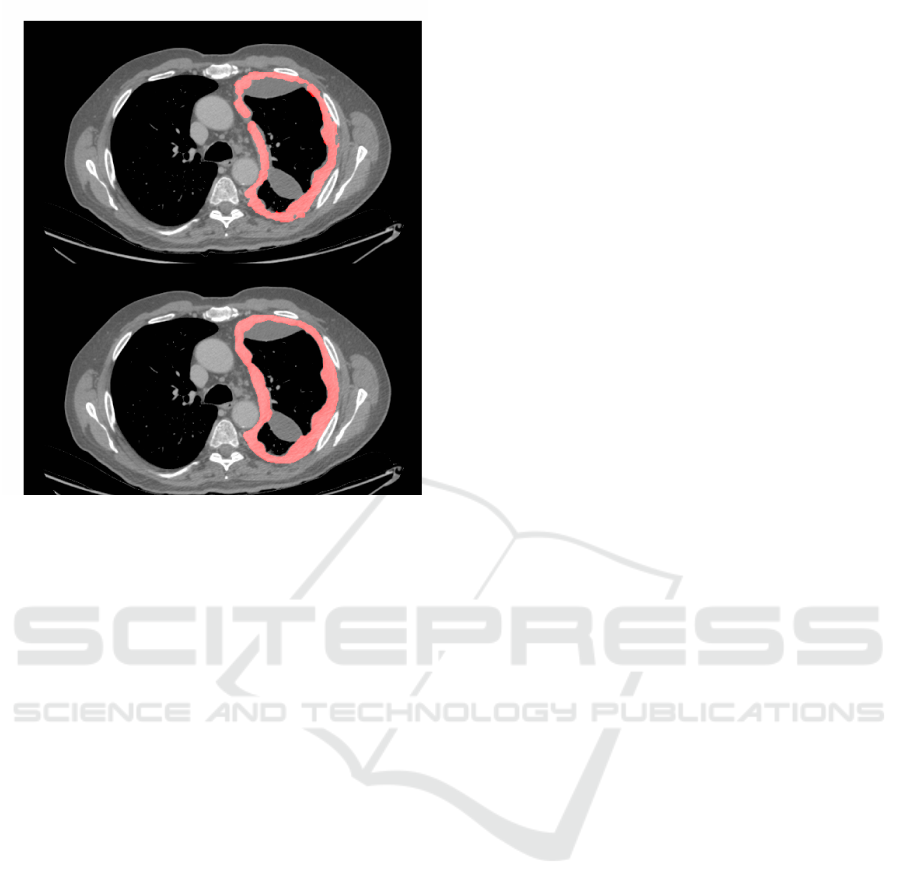
Figure 6: A CT slice from a subject positive for MPM. Top:
Image overlaid with the ground truth segmentation (in red).
Bottom: The corresponding predicted segmentation from
one of the seven-fold models.
4 DISCUSSION
Accurate measurements of MPM tumour volume could
benefit both routine care and clinical trials. Although
there is currently no curative treatment, accurate mea-
surements could support clinicians in finding the most
effective therapy for each patient. Used as a robust
treatment response metric, volumetric measurements
could also enable smaller and/or more powerful clini-
cal trials.
However, manual measurements suffer from poor
repeatability and/or are time consuming and tedious to
perform. Even volumetric measurements suffer both
aleatoric and epistemic uncertainty. Aleatoric uncer-
tainty arises from the intrinsic uncertainty inherent
in the task. For mesothelioma segmentation a major
source of uncertainty stems from the unusually high
surface-to-volume ratio of the tumour. Placement of
edge points is inherently uncertain, and long, narrow
regions have a large proportion of edge voxels. For
example, an uncertainty of only half a voxel in the
edge delineation of the tumour can result in a total
tumour volume error as high as 60% (based on an
analysis of the tumour shapes in this cohort). Uncer-
tainty also arises from ambiguous structures within the
CT images, that appear very similar to mesothelioma.
However, this feature ambiguity is also a source of
epistemic uncertainty, since with more knowledge and
experience it may be possible to disambiguate the con-
founding features based on knowledge, for example,
by inference based on the known likelihood of a certain
feature occurring in a particular location. It is clear
that a substantial amount of the annotation process is
based on the annotator’s experience and knowledge of
how the tumour manifests. This could be expressed
as a complex set of prior probabilities, given the in-
formation contained in the image, the knowledge that
the image contains a mesothelioma tumour, and the
characteristics of such tumours.
It is perhaps remarkable that, given such a chal-
lenging task, such promising algorithm performance
can be achieved. This is exactly the kind of application
where deep learning algorithms can demonstrate their
strengths.
4.1 Principal Findings
The principal findings of this study are:
1.
Following three-dimensional binary closing of the
manual annotations to improve inter-slice consis-
tency, there is no significant mean volume differ-
ence between the manual and automatic measure-
ments.
2.
The 95% limits of agreement between the manual
and automated measurements are between -417
and +363 cm
3
.
3. The mean Dice overlap coefficient was 0.64.
4.2 Critical Analysis
Chen et al. achieve a Dice coefficient of 0.825, using
a semi-automated approach requiring human placed
candidate points. This is higher than our mean Dice
coefficient of 0.64. Some of this difference may arise
from the fully-automated nature of our approach, but
we also note that on some of our image datasets we
achieve similarly high Dice scores. Some images
are intrinsically more difficult to annotate than others,
whether manually or automatically, and agreement will
depend on the disease characteristics in the cohort. For
example, Sensakovic et al. (Sensakovic et al., 2011)
found a median Dice coefficient of 0.68 between three
manual observers, when annotating random slices of
CT images from 31 subjects. Generally, it is easier
to annotate images containing larger MPM tumour
volumes, where a higher Dice coefficient is more eas-
ily achieved due to the lower surface-to-volume ratio.
Although these provide interesting comparisons, we
can draw only limited conclusions without a truly like-
for-like comparison of the two methods, tested on the
same cohort.
Fully Automated Volumetric Measurement of Malignant Pleural Mesothelioma from Computed Tomography Images by Deep Learning:
Preliminary Results of an Internal Validation
71

Labby et al. (Labby et al., 2013) report relative
95% limits of agreement between five observers span-
ning 311% for area measurement of MPM tumours,
across 31 subjects. Although we report volumetric
measurement, the 95% limits of agreement in this
evaluation span just 129.2%. However, we note that
this is only comparing against a single observer; the
same observer used to train the model. Labby et al.
also includes figures showing how different observers
consistently annotate differently, i.e. some observers
consistently segment less tumour than others.
For the task of MPM segmentation, where the dis-
ease characteristics can vary dramatically between sub-
jects, time-points and observers, performance of an
algorithm depends heavily on the training and testing
cohort. An increased variance between subjects means
that a large and diverse test set is required to truly es-
tablish whether any automated method can generalise
to unseen cases. A potential limitation of this work
is that we have demonstrated the performance of the
algorithm on 80 subjects which have not undergone
treatment for the disease, all from imaging centres
based in Glasgow, annotated by a single observer. Al-
though this is an unusually large cohort for which to
have full volume annotation of MPM tumour, we ex-
pect that a large, independent and varied test set by
multiple observers is still necessary to truly determine
the performance of this algorithm.
4.3 Future Work
The automated algorithm will shortly be evaluated on
the remaining unseen evaluation datasets, acquired
from multiple institutions (only 123/403 datasets were
used in the internal validation). This evaluation will
determine whether the algorithm performance exceeds
that of the current clinical standard mRECIST scor-
ing system. Cross-validation can only tell us so much
about the performance of an algorithm. The future
external validation will also provide a more realis-
tic and unbiased assessment of its performance using
data from multiple independent centres not involved
in training the algorithm. In addition, inter- and intra-
observer repeatability measurements for these subjects
will provide further context for the performance of this
algorithm.
5 CONCLUSIONS
We have performed an internal validation to explore
the utility of a deep learning approach for fully auto-
mated measurements of MPM in CT images. Binary
closing was found to improve the inter-slice consis-
tency of manual annotations. Following binary closing
there was no significant mean difference between the
manual and automated measurements. To our knowl-
edge, this is the first volumetric evaluation of a fully
automated system to segment pleural volume. The
next step will be to evaluate the method on the re-
maining unseen multi-centre evaluation set. Such an
algorithm has possible future application to pharma-
ceutical trials (where it offers a repeatable study end
point) and to routine care (where it allows tumour pro-
gression to be assessed rapidly to enhance therapeutic
clinical decision making).
REFERENCES
Armato, S. G., Nowak, A. K., Francis, R. J., Kocherginsky,
M., and Byrne, M. J. (2014). Observer variability in
mesothelioma tumor thickness measurements: Defin-
ing minimally measurable lesions. Journal of Thoracic
Oncology.
Attanoos, R. L. and Gibbs, A. R. (1997). Pathology of
malignant mesothelioma. Histopathology, 30(5):403–
418.
Blyth, K., Kidd, A., Winter, A., Baird, W., Dick, C., Hair, J.,
Bylesjo, M., Lynagh, S., Sloan, W., Cowell, G., Noble,
C., Smith, A., Westwood, P., Hopkins, T., Williams, N.,
Walter, H., King, A., and Fennell, D. (2018). An update
regarding the Prediction of ResIstance to chemotherapy
using Somatic copy number variation in Mesothelioma
(PRISM) study. Lung Cancer.
Brahim, W., Mestiri, M., Betrouni, N., and Hamrouni, K.
(2018). Malignant pleural mesothelioma segmentation
for photodynamic therapy planning. Computerized
Medical Imaging and Graphics.
Byrne, M. J. and Nowak, A. K. (2004). Modified RECIST
criteria for assessment of response in malignant pleural
mesothelioma. Annals of Oncology.
Chaisaowong, K., Akkawutvanich, C., Wilkmann, C., and
Kraus, T. (2013). A fully automatic probabilistic 3D
approach for the detection and assessment of pleural
thickenings from CT data. In Computational Intelli-
gence in Medical Imaging.
Chen, M., Helm, E., Joshi, N., Gleeson, F., and Brady, M.
(2017). Computer-aided volumetric assessment of ma-
lignant pleural mesothelioma on CT using a random
walk-based method. International Journal of Computer
Assisted Radiology and Surgery.
Chollet, F. (2015). Keras.
Eisenhauer, E. A., Therasse, P., Bogaerts, J., Schwartz, L. H.,
Sargent, D., Ford, R., Dancey, J., Arbuck, S., Gwyther,
S., Mooney, M., Rubinstein, L., Shankar, L., Dodd, L.,
Kaplan, R., Lacombe, D., and Verweij, J. (2009). New
response evaluation criteria in solid tumours: Revised
RECIST guideline (version 1.1). European Journal of
Cancer.
Frauenfelder, T., Tutic, M., Weder, W., G
¨
otti, R. P., Stahel,
R. A., Seifert, B., and Opitz, I. (2011). Volumetry: An
BIOIMAGING 2020 - 7th International Conference on Bioimaging
72

alternative to assess therapy response for malignant
pleural mesothelioma? European Respiratory Journal.
Gudmundsson, E., Straus, C., Li, F., Kindler, H., and Armato,
S. (2019). P1.06-04 Deep Learning-Based Segmen-
tation of Mesothelioma on CT Scans: Application to
Patient Scans Exhibiting Pleural Effusion. Journal of
Thoracic Oncology.
Gudmundsson, E., Straus, C. M., and Armato, S. G. (2018).
Deep convolutional neural networks for the automated
segmentation of malignant pleural mesothelioma on
computed tomography scans. Journal of Medical Imag-
ing.
Ioffe, S. and Szegedy, C. (2015). Batch normalization: Ac-
celerating deep network training by reducing internal
covariate shift. In Proc. Int. Conf on Machine Learn-
ing (ICML), volume 37 of Proceedings of Machine
Learning Research, pages 448–456.
Jia Deng, Wei Dong, Socher, R., Li-Jia Li, Kai Li, and Li
Fei-Fei (2009). ImageNet: A large-scale hierarchical
image database. In 2009 IEEE Conference on Com-
puter Vision and Pattern Recognition.
Labby, Z. E., Straus, C., Caligiuri, P., Macmahon, H., Li, P.,
Funaki, A., Kindler, H. L., and Armato, S. G. (2013).
Variability of tumor area measurements for response as-
sessment in malignant pleural mesothelioma. Medical
Physics.
Martin Bland, J. and Altman, D. G. (1986). Statistical Meth-
ods for Assessing Agreement Between Two Methods
of Clinical Measurement. The Lancet.
Ng, C. S., Munden, R. F., and Libshitz, H. I. (1999). Malig-
nant pleural mesothelioma: The spectrum of manifes-
tations on CT in 70 cases. Clinical Radiology.
Ronneberger, O., Fischer, P., and Brox, T. (2015). U-Net:
Convolutional Networks for Biomedical Image Seg-
mentation. Medical Image Computing and Computer-
Assisted Intervention.
Schwartz, L. H., Liti
`
ere, S., De Vries, E., Ford, R., Gwyther,
S., Mandrekar, S., Shankar, L., Bogaerts, J., Chen, A.,
Dancey, J., Hayes, W., Hodi, F. S., Hoekstra, O. S.,
Huang, E. P., Lin, N., Liu, Y., Therasse, P., Wolchok,
J. D., and Seymour, L. (2016). RECIST 1.1 - Update
and clarification: From the RECIST committee. Euro-
pean Journal of Cancer.
Sensakovic, W. F., Armato, S. G., Straus, C., Roberts, R. Y.,
Caligiuri, P., Starkey, A., and Kindler, H. L. (2011).
Computerized segmentation and measurement of ma-
lignant pleural mesothelioma. Medical Physics.
Smith, L. N. (2017). Cyclical learning rates for training
neural networks. In IEEE Winter Conference on Appli-
cations of Computer Vision.
Srivastava, N., Hinton, G., Krizhevsky, A., Sutskever, I., and
Salakhutdinov, R. (2014). Dropout: A Simple Way to
Prevent Neural Networks from Overfitting. Journal of
Machine Learning Research, 15:1929–1958.
Tsim, S., Kelly, C., Alexander, L., McCormick, C., Thomson,
F., Woodward, R., Foster, J. E., Stobo, D. B., Paul, J.,
Maskell, N. A., Chalmers, A., and Blyth, K. G. (2016).
Diagnostic and Prognostic Biomarkers in the Rational
Assessment of Mesothelioma (DIAPHRAGM) study:
Protocol of a prospective, multicentre, observational
study. BMJ Open.
Yoon, S. H., Kim, K. W., Goo, J. M., Kim, D. W., and Hahn,
S. (2016). Observer variability in RECIST-based tu-
mour burden measurements: A meta-analysis. Euro-
pean Journal of Cancer, 53:5–15.
Fully Automated Volumetric Measurement of Malignant Pleural Mesothelioma from Computed Tomography Images by Deep Learning:
Preliminary Results of an Internal Validation
73
