
Goal-based Evaluation of Text Mining Results in an Industrial Use Case
Jens Drawehn, Matthias Blohm, Maximilien Kintz and Monika Kochanowski
Fraunhofer Institute for Industrial Engineering IAO, Nobelstraße 12, 70569 Stuttgart, Germany
monika.kochanowski@iao.fraunhofer.de
Keywords:
Text Mining, Feature Extraction, Artificial Intelligence, Evaluation.
Abstract:
Artificial intelligence boosted the interest in text mining solutions in the last few years. Especially in non-
English-speaking countries, where there might not be clear market leaders, a variety of solutions for different
text mining scenarios has become available. Most of them support special use cases and have strengths and
weaknesses in others. In text or page classification, standard measures like precision, recall, sensitivity or
F1-score are prevalent. However, evaluation of feature extraction results requires more tailored approaches.
We experienced many issues on the way to benchmarking feature extraction results from text, like whether
a result is correct, partly correct, helpful or useless. The main contribution of this work is a method for
designing a tailored evaluation procedure in an individual text extraction benchmark for one specific use case.
In this context, we propose a general way of mapping the common CRISP-DM process to particularities of
text mining projects. Furthermore, we describe possible goals of information extraction, the features to be
extracted, suitable evaluation criteria and a corresponding customized scoring system. This is applied in detail
in an industrial use case.
1 INTRODUCTION
How does artificial intelligence help to deal with
the loads of documents a company receives every
day? Text mining solutions have become available
in great number and with different features (Evel-
son, B. and Sridharan, S. and Perdoni, R., 2019;
Davis et al., 2019; Capterra Inc., 2019; PAT Research,
2019). However, choosing the right solution for one
case is not a trivial task. Especially in non-English-
speaking countries, there might be no clear market
leaders. The solutions differ in set-up effort, strengths
and weaknesses and of course in price. For choosing
and customizing a solution, typical software selection
projects are the right choice. In the case of choosing a
text mining solution, evaluating the results of feature
extraction tasks is crucial.
In text or page classification, standard measures
from data science can be applied for giving an
overview of the outcome. For feature extraction tasks
like entity recognition, the question whether a result
is helpful, detrimental, useful or useless is more diffi-
cult to answer, depending on the application scenario.
Therefore, it is necessary to define tailored measures
for evaluating the outcome of feature extraction solu-
tions for text documents in order to choose the right
product. As a basis the standard measures like preci-
sion, recall, sensitivity and F1-score are used and ap-
plied to the goals of a specific data extraction result.
However, these measures show limits when it comes
to evaluating feature extraction results. The main con-
tribution of this paper is a method for goal-based eval-
uation of feature extraction results from text while
comparing various approaches for information extrac-
tion. We apply the method to an industrial use case,
which we use to evaluate the method.
This paper is structured as follows: Section 2 ex-
plains our general approach for mapping the common
CRISP-DM process (Chapman et al., 2000) to text
mining. Section 3 references related work in the field
of feature extraction tasks from unstructured text. In
Section 4 we apply the described method in an indus-
trial use case. Finally, Section 5 gives a conclusion
and outlook.
2 METHODOLOGY
CRISP-DM is a well-established methodology for
data mining. Our text mining approach is structured
accordingly to this model as described in Chapman
et al. (2000). The focus on the evaluation of text min-
ing results is outlined for each step in Figure 1.
Drawehn, J., Blohm, M., Kintz, M. and Kochanowski, M.
Goal-based Evaluation of Text Mining Results in an Industrial Use Case.
DOI: 10.5220/0008973801830191
In Proceedings of the 9th International Conference on Pattern Recognition Applications and Methods (ICPRAM 2020), pages 183-191
ISBN: 978-989-758-397-1; ISSN: 2184-4313
Copyright
c
2022 by SCITEPRESS – Science and Technology Publications, Lda. All rights reserved
183
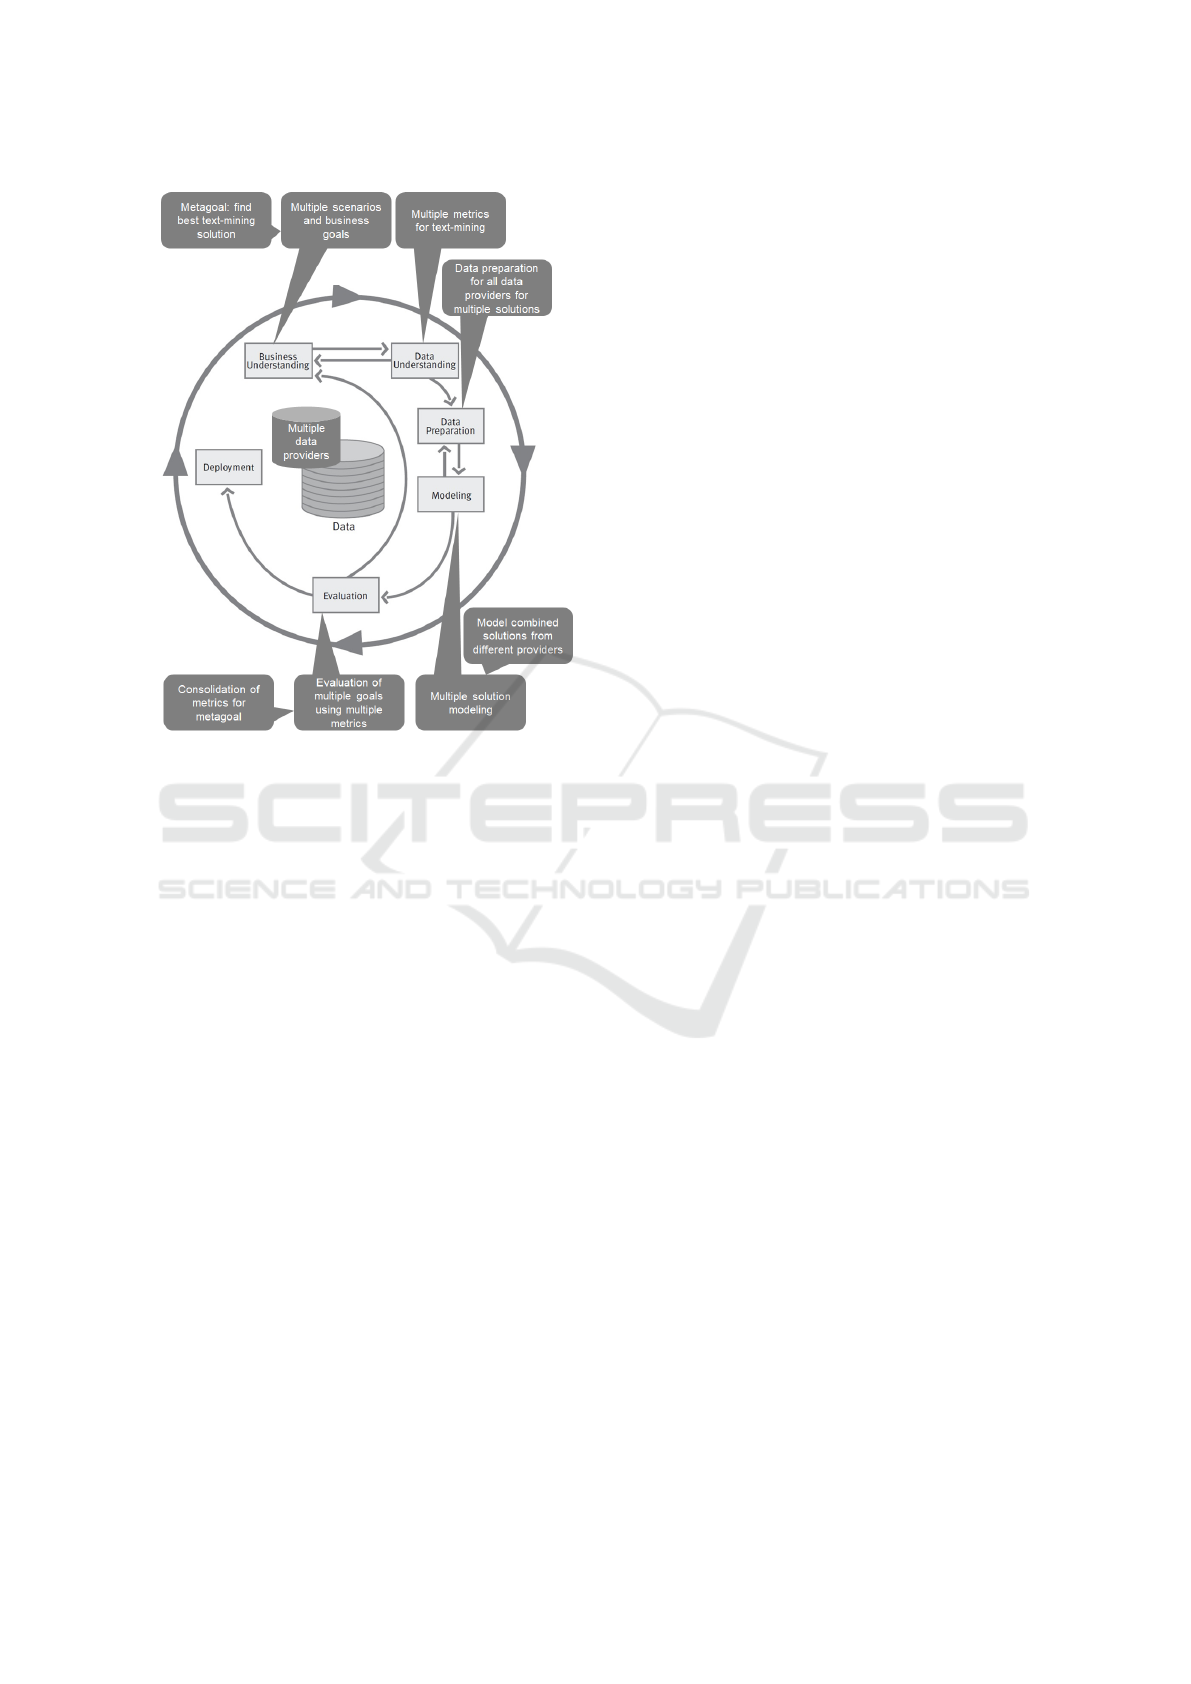
Figure 1: Contributions of this paper inside CRISP-DM as
in Chapman et al. (2000).
In the first phase of Business Understanding a
metagoal is defined: finding the best text-mining
solution. This contains multiple feature extraction
tasks, which support different scenarios and business
goals. In many text mining projects, incoming docu-
ments are classified and features are extracted. Subse-
quently, this information is used to support and/or op-
timize the appropriate business process to fulfill a cer-
tain business goal. Different kinds of improvements
such as process automation, decision support and as-
sistance functions are possible. These determine the
features to be extracted and the demand on quality of
the extracted features. In this work we structure the
goals and the features accordingly.
Data Understanding comprises inspecting the
documents to be processed with regard to file for-
mat and resolution, thus ensuring that the documents
can be processed correctly by the text mining solu-
tions. Another issue to be considered is the type of
content that provides orientation on what text mining
approaches are suitable. Depending on the use case,
part of the data understanding is the analysis of possi-
ble feature extraction results, therefore preparing the
definition of metrics on these results.
In the next phase of Data Preparation, the docu-
ments are prepared to be processed by the text mining
solutions. Typical steps are file format conversions
and (if this is not done by the text mining solutions
themselves) content preparation tasks such as contrast
optimization and deskewing. Another task is the com-
pilation of a test set of documents that can be used
later to evaluate the extraction results.
The tasks of the Modeling Phase are usually car-
ried out by the providers of the text mining solutions.
In the industrial use case described later on, multiple
providers exist, therefore it is possible to improve the
results by combination of feature extraction results in
an optimization steps after the evaluation phase.
For the Evaluation of feature extraction results,
standard measures like precision, recall and F1-score
exist. While such measures are suitable to evaluate
the efficiency of feature extraction methods in gen-
eral, they do not reflect the particular requirements
and the objectives of a certain usage scenario. We
introduce custom metrics for the multiple goals as de-
fined in the phase of business understanding. Further-
more, a consolidation of these metrics is considered
for finding the overall best text mining solution refer-
ring to the metagoal.
As a result of the described course of action, the
achieved knowledge about tools, features, documents
and usage scenarios can be used to iterate through the
phases of CRISP-DM (Chapman et al., 2000) and to
redefine artifacts if necessary to get improved results,
for example by combining text mining solution, fine
tuning single solutions, refine the scenarios etc.
The phase of Deployment is out of scope for this
paper.
3 RELATED WORK
The procedure of our use case is based on the CRISP-
DM methodology described in Chapman et al. (2000).
Other work in the area of text mining that orients itself
on CRISP-DM was done for example by Carnerud
(2014), who described this process with the goal of
topic modeling for large conference proceeding pa-
pers. During the phase of data preparation, which
may include processing of large scanned document
files with many pages, automated document seg-
mentation mechanisms like those of Wiedemann and
Heyer (2017) may provide helpful preliminary work
in order to facilitate the following data extraction
tasks.
Nadeau and Sekine (2007) provide an overview of
different standard evaluation metrics for named en-
tity recognition (NER) tasks: The CONLL scoring
protocol (Tjong Kim Sang and De Meulder, 2003)
only counts exact matches, while the advanced ACE
(Doddington et al., 2004) evaluation also considers
more complex cases like partial matches or wrong
ICPRAM 2020 - 9th International Conference on Pattern Recognition Applications and Methods
184
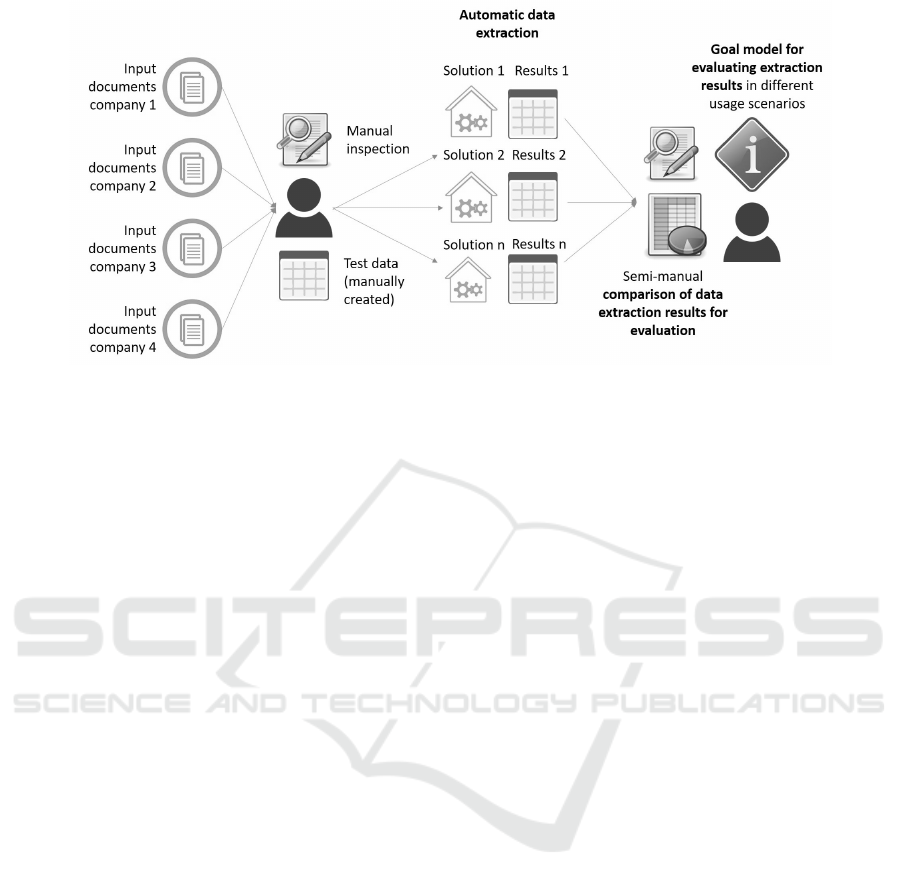
Figure 2: Information flow in our industrial use case with four companies and three provider solutions.
type classification of found entities. In MUC (Mes-
sage Understanding Conference) events (Grishman
and Sundheim, 1996), which generally target infor-
mation extraction tasks, a system’s performance is
evaluated based on two axes: whether the system is
able to find the correct text match of an entity and
whether it is able to assign the correct type to the
found entity. For time-based expressions like date of
incidence in our scenarios, the TIMEX2 (Ferro et al.
(2005)) standard may be useful.
These metrics or other variations of standard pre-
cision and recall, as introduced by Manning et al.
(2008), may serve as suitable performance indicators
for many cases. A weighted F-measure, as it was in-
troduced by Chinchor (1992), allows to regulate im-
pacts of precision and recall results on the computed
F-score depending on the corresponding goals and
scenarios.
More work that defines evaluation metrics cus-
tomized for text mining was done by Suominen et al.
(2009), that define for example an extended metric for
precision and recall that is able to express partly cor-
rect values as well. Furthermore, the work of Esuli
and Sebastiani (2010) shows one way to properly as-
sess the overlaps between predicted and true result en-
tities. Similar to our case, Jiang et al. (2016) differen-
tiate between correct full matches and partly correct
matches that may not have the exact expected entity
boundaries but still provide useful information. They
also show how multiple NER systems can be com-
bined to form ensembles.
As shown by former works like that of Onan et al.
(2016), combining the outputs of different tools may
indeed increase the quality of text mining results. Es-
pecially in the field of information extraction for med-
ical documents there has been a lot of recent research,
such as the work of Singhal et al. (2016), that investi-
gates how multiple modern machine learning models
can work together efficiently in order to form power-
ful ensembles. Furthermore, approaches like that of
Hamon and Grabar (2013), who used both rule-based
and machine learning techniques at the same time for
extracting ingredient names in recipe documents, al-
ready show the great potential of such hybrid tech-
niques. However, evaluation of (combined) feature
extraction results is not trivial.
To the best of our knowledge, there exist no stan-
dard evaluation measures usable for all kinds of data
extraction tasks in general. Instead, the definition of
correct and incorrect results strongly depends on spe-
cific feature declaration and the respective problem
context and therefore requires customized evaluation
plans like the method proposed in this work.
4 APPLICATION IN AN
INDUSTRIAL USE CASE
4.1 Description of Use Case
The industrial use case deals with reports describing
incidents and their implications and is a joint project
with four participating insurance companies. Its main
objective or metagoal as described in Section 2 is to
evaluate text mining solutions. Figure 2 shows the
information flow in this project, beginning with input
documents from all participants among the companies
and ending in a tailored evaluation task for all three
solutions.
The reports originate from outside the compa-
nies, mainly in paper form, which are scanned and
standard OCR (Optical Character Recognition) tech-
niques such as Tesseract OCR (Google, 2019) are ap-
Goal-based Evaluation of Text Mining Results in an Industrial Use Case
185

Table 1: Importance of Features for Usage Scenarios.
Feature Scenario 1 (Black Box Processing) Scenario 2 (Provide Document Index)
author name values should be correct incorrect values acceptable
date of incident values must be correct values should be correct
cause of incident incorrect values acceptable incorrect values acceptable
all features missing values acceptable missing values acceptable
plied. We used three text mining solutions imple-
menting different approaches to extract features that
are necessary for further processing. Tool 1 and 2
are rule based and use rule languages such as UIMA
RUTA (Apache Software Foundation, 2019) to extract
feature values. The main effort is the creation of these
rules. Tool 3 applies a machine learning approach.
The main effort is annotating the correct feature val-
ues for numerous documents.
While the reports contain numerous features, we
describe our approach here by means of the three fea-
tures author name, date of incident and cause of in-
cident. Even though the document class and the fea-
tures to be extracted are consistent, the usage scenar-
ios of the four companies are different. While not ex-
ploring the usage scenarios in detail, we identified the
intended purpose and evaluated the results based on
the company-specific goals. Based on the results of
the individual tools, we created additional results by
combining result values of different tools.
4.2 Business Understanding
We identified the objectives of each participating
company and the specific demands on quality of the
extracted data. We found that we can sum up the ob-
jectives of all companies by defining two usage sce-
narios: 1 black box processing and 2 provide docu-
ment index. In both scenarios, the goal is to extract
the three features mentioned in the last section. The
result of the multiple scenarios and business goals is
shown in an overview in Table 1 and described in the
following.
The objective of scenario 1 is to use the extracted
features for subsequent black box processing. To
avoid errors in the follow-up process, features with an
effect on control flow (such as date of incident) should
have little or no incorrect results, whereas missing
values are less critical. In other words, it is better
to accept a smaller percentage of documents with ex-
tracted feature values, as long as the values are cor-
rect. For other features that have no controlling ef-
fect (such as author name) or that serve as additional
information (such as the detailed cause of incident),
it could be better to have more extracted values by
accepting a certain rate of incorrect values. Missing
values are acceptable for all three features in this sce-
nario, since it is easy to identify the respective docu-
ments and add the missing values manually if needed.
In scenario 2 provide document index, the ex-
tracted features enable users to access the document
content quickly and easily. Since we assume the users
to have the necessary skills to recognize incorrect val-
ues and to deal with them, incorrect values are accept-
able. As in scenario 1, missing values are acceptable
here as well.
4.3 Data Understanding
In both scenarios the documents were available as
multi page documents in the TIFF format with a res-
olution of 200 dpi. Each document contains reports
plus additional pages such as cover letters and invoice
documents. All documents have content of mixed
type (running text, tables, pictures and form sections)
and the layouts are heterogeneous.
As described above, the features to be extracted
from the reports are author name, date of incident and
cause of incident. Author name is of data type string
and we expect the author name to be present in all
reports. Date of incident is of type date. The detailed
cause of incident is given in text form, but there may
be several causes for one single incident, thus the data
type of this feature is a set of strings. Date of incident
and cause of incident should be present in most (but
not in all) reports. It is obvious that multiple metrics
need to be defined for comparing the quality of the
feature extraction results of different tools, as partly
correct results etc. need to be considered.
4.4 Data Preparation
Because the report pages are scanned mostly in high
quality, only minor problems related to OCR occur.
Due to the amount of information, manual separa-
tion and page classification is very time consuming
and not possible in a real life setting. As a conse-
quence, the text mining solutions process the report
pages in the same way as the additional pages, which
may cause incorrect extraction results. Another chal-
lenge is mixed content, making it more difficult for
text mining solutions to deliver correct extraction re-
sults in special cases like feature values occurring in
a table.
ICPRAM 2020 - 9th International Conference on Pattern Recognition Applications and Methods
186

For evaluation purposes, a test set of 369 reports is
used. The correct values of all three features for these
documents are extracted manually. Author name is
present in 92% of the documents, date of incident in
90 % and cause of incident in 95 %. The average page
count of the test documents is 15.
4.5 Modeling
The modeling activities are carried out by the
providers of the text mining solutions and are based
on a small set of specially created example docu-
ments. Within these documents, the correct locations
of the features to be extracted are marked.
Details concerning the used tools, algorithms and
models are omitted here since they are not crucial for
our evaluation-focused approach.
4.6 Evaluation
Using the test set (see Section 4.4), it is easy to an-
swer the question if an extracted value is correct or
not. However, in many cases the extracted value is
not correct in the proper meaning of the word, but
nonetheless useful with respect to the goals of the us-
age scenario (see Table 1). Hence, a rating is needed
for useful results, taking into consideration the usage
goals. Incorrect but useful values may occur for sev-
eral reasons. One single document may contain dif-
ferent values for one feature, or character errors may
result from OCR.
To evaluate the results of the text mining solutions
in general, the prevalent measures precision, recall
and F1-score (Manning et al., 2008) are applied to
each individual feature. Precision is the percentage
of retrieved documents that are relevant. Here this
is the percentage of documents where a tool delivers
correct feature values relative to all documents where
the tool delivers any value. Recall is the percentage of
relevant documents that are retrieved. Here, this is the
percentage of documents where a tool delivers correct
feature values relative to all documents that contain
any value. F1-Score is the harmonic mean of preci-
sion and recall. It is often used as a standard measure
for evaluation.
For textual features, it is convenient to calculate
similarity between the correct values and the extracted
values using the Levenshtein distance. In cases where
a reference data set is available, the similarity mea-
sure is used to map the extracted values to the correct
values. For the feature author name, reference data
should be available. Therefore, extraction values for
author names that have a Levenshtein distance less or
equal to one to the correct value are considered as use-
ful. For the same reason, correct last names are useful.
Table 2 shows this rating.
For features of type date, ambiguities and vague-
ness are a challenge. One document may contain sev-
eral date values, as well as the extraction result for one
document may consist of several date values. Further-
more, a period of time (such as “beginning of Decem-
ber 2017”) may be given in a document and likewise
the extraction result may be a period. Table 3 shows
how extraction results are rated.
The last feature cause of incident is more vague
than the other features. It may appear at several
positions in continuous text and we expect no ex-
act matches for this feature. If causes are described
shortly using few keywords, it might be possible
to use rating functions (as for the other features).
For complex descriptions, a manual rating approach
seems reasonable. This feature and its rating is shown
in Table 4.
Tables 2, 3 and 4 show the usefulness of extrac-
tion values for both scenarios. Coming back to using
an evaluation based on standard measures, the extrac-
tion result can be True Positive (T P), False Positive
(FP), False Negative (FN) or True Negative (T N). In
contrast to classification problems, we have to distin-
guish two different types of FPs here. If a document
contains no feature value and a tool delivers a value
as extraction result, we denoted this as False Positive
Invented (FP
i
). The second type (denoted as False
Positive Missed, FP
m
) occurs when a document con-
tains a feature value and a tool delivers another value
that we rate as not useful. Considering the standard
definitions of precision and recall, we compute preci-
sion and recall as follows, using T P for “number of
T Ps” etc. in the formulas:
precision =
T P
T P + FP
i
+ FP
m
recall =
T P
T P + FN + FP
m
Note that the formula of recall differs from the stan-
dard formula since each FP
m
indicates a document
containing a value that should have been found (and
was not). According to our definition given earlier
in this section the number of documents that contain
any value for this feature is T P + FN + FP
m
. On the
other hand, the formula of precision is equivalent to
the standard one since FP = FP
i
+ FP
m
.
F1-score is then as usual:
F1 =
2 ∗ precision ∗ recall
precision + recall
Goal-based Evaluation of Text Mining Results in an Industrial Use Case
187

Table 2: Rating of extraction results for author name.
Situation in document Extraction result Rating for scenario 1 Rating for scenario 2
full name full name useful useful
full name last name useful useful
more than one name at least one useful name useful useful
one name more than one name, at least one useful useful useful
full name first name not useful not useful
Table 3: Rating of extraction results for date of incident.
Situation in document Extraction result Rating for scenario 1 Rating for scenario 2
one date correct date useful useful
one date incomplete date (year missing) not useful not useful
one date period with length one month or less, including correct date not useful useful
period date within period useful useful
one date more than one date, at least one correct not useful useful
more than one date at least one correct date not useful useful
Table 4: Rating of extraction results for cause of incident.
Situation in document Extraction result Rating for scenario 1 Rating for scenario 2
short description of cause (few keywords) all relevant keywords, nothing else useful useful
short description of cause (few keywords) all relevant keywords plus more irrelevant text useful useful
complex description complex description, matching partially manual rating required manual rating required
several different causes at least one correct cause useful useful
After rating all extraction results as T P, T N, FN, FP
i
and FP
m
, we calculate precision, recall and F1 for all
tools and all features. The next step is to identify the
best results with regard to the objectives of the two
scenarios. While highest F1 is considered the best re-
sult in general, in this setting we use a tailored result.
Using Table 1 the best result is defined as follows:
• Incorrect Values Acceptable:
max(F1
1
, F1
2
, ...F1
n
) with F1
i
being the F1
score of tool i
• Values should be Correct:
max(F1
1
, F1
2
, ...F1
n
) with F1
i
being the F1
score of tool i and precision
i
≥ 0.9 at the same
time
• Values must be Correct:
max(precision
1
, precision
2
, ... precision
n
) with
precision
i
being the precision score of tool i
where precision
i
≥ 0.9 and recall
i
≥ 0.35 at the
same time
These thresholds are defined analytically for the spe-
cific industrial use case and its goals. The intro-
duction and usage of a more flexible scoring sys-
tem, such as a weighted F-measure (Chinchor, 1992),
that allows to control the impact of detected FPs and
FNs for different scenarios, remains part of our fu-
ture work, which includes finding optimal weights
and thresholds.
4.7 Optimization
Table 5 shows the tools with the best results for each
feature and the achieved scores for precision, recall
and F1. Note that the combination of tools is already
part of the iteration phase in CRISP-DM. For exam-
ple, the tool combination C
1,2
combines the extrac-
tion results for date of incident of tools 1 and 2, using
only the coincident values of both tools. C
1,3
uses the
non-empty result values of tool 1 and, when tool 1
provides no value, the result values of tool 3.
As mentioned before we defined different values
to be useful for scenario 1 and 2 for feature date of
incident (see table 3), resulting in different values for
precision, recall and F1 for the same extraction re-
sults.
In comparison, Table 6 shows the results we
would have received with a standard correctness-
based evaluation that does not consider usefulness of
information but only whether the extracted features
match the expected values or not. As to expect, qual-
ity of all tools decreases for this scenario. Addi-
tionally, for this case tool 3 provides the overall best
score, while for scenario 2, tool 1 was the clear win-
ner with respect to usefulness. In this case, the result
in Table 6 is misleading, showing the importance of
using appropriate evaluation mechanisms that are tai-
lored to the specific use case scenario and its goals in
order to receive meaningful results (see Table 5).
4.8 Learnings
Finally we used the gained knowledge to iterate
through the phases of CRISP-DM.
In the first phase of Business Understanding, it
may be beneficial to redefine the scenarios, features
and their usage goals. In the presented use case the
scenarios were predetermined and were not changed
ICPRAM 2020 - 9th International Conference on Pattern Recognition Applications and Methods
188

Table 5: Best tools and their evaluation results - goal: usefulness (scenario 1 and 2).
Feature Scenario (Goal) Importance of feature Tool Precision Recall F1
author name 1 values should be correct 3 0.925 0.380 0.539
author name 2 incorrect values acceptable 1 0.725 0.604 0.659
date of incident 1 values must be correct C
1,2
0.987 0.450 0.619
date of incident 2 values should be correct C
1,3
0.949 0.784 0.859
cause of incident 1 and 2 incorrect values acceptable 1 0.820 0.720 0.767
Table 6: Best tools and their evaluation results - goal: correctness.
Feature Scenario (Goal) Tool Precision Recall F1
author name correctness 3 0.817 0.336 0.476
date of incident correctness C
1,3
0.910 0.753 0.824
cause of incident correctness 3 0.642 0.280 0.390
during the project. On the other hand, the gained
knowledge about the extraction results resulted in dif-
ferent usage goals. For instance, the objective of
black box processing requires high precision values
for features with an effect on the control flow. Thus,
the obtained precision values may trigger a change of
the usage goals, taking (or not) into account black
box processing. Such decisions, in turn, may result
in different feature definitions that are more suitable
to achieve the new goals.
With regard to Data Understanding, new knowl-
edge about the documents and their content can be
used to reconsider the feature definitions. Overall, we
observed the following peculiarities:
• unexpected missing values for feature author
name (assumed to be present in all documents)
• unexpected multiple values for feature author
name and date of incident
• incomplete or vague values (such as only last
name of author name or period for date of inci-
dent)
• reports with attached prior reports referring to the
same incident
To better suit the exceptional cases, a change of fea-
ture definitions is necessary. For example, we could
change the feature type of date of incident from (sin-
gle) date to period (start and end date). Such changes
would considerably increase the complexity of the ex-
traction task.
With regard to the Modeling Phase, it is possible
to improve the efficiency of extraction of the tools.
In case of Machine Learning approaches, this could
mean to provide more training data or to adapt and
change the machine learning algorithm. If the extrac-
tion approach is rule-based, one can try to detect sys-
tematic errors and to adapt the rule set.
When iterating trough the Evaluation Phase, the
rating functions and evaluation criteria should be re-
viewed and adapted if necessary. A reusable library
with evaluation functionality covering the following
subjects is part of future work:
• automatic matching/rating of time periods for
usual kinds of time periods to support further au-
tomatic rating of date features (rating overlapping
time periods as useful)
• rate date values close to the correct value as useful
(with maximum distance as parameter)
• matching of names using a reference database (if
available), resulting in exact values (full names)
that can be rated automatically
• development of rating functions for vague text
features using keyword-based approaches and
considering length of text
5 CONCLUSION AND OUTLOOK
In this work we have described in detail the evaluation
additions to the standard CRISP-DM process for data
mining applied for feature extraction results in a text
mining project. We have described the additional arti-
facts in each phase, spanning multiple business goals
and scenarios, and described how metrics are used for
evaluating not only correct, but also useful feature ex-
traction results. We have briefly described possible
optimizations to the process and given an outlook on
future work.
We have successfully applied the methodology to
our real-world industrial use case, which consists of
three commercial software solutions and real-world
documents from four companies. It showed that
a methodical approach for defining scenarios, goals
and criteria is necessary for project success. Sev-
eral iterations were necessary to achieve a common
understanding of the goals and challenges among
customers, implementers and solution providers. It
showed that distinguishing between scenarios, goals
Goal-based Evaluation of Text Mining Results in an Industrial Use Case
189

and criteria is crucial for successful communication
in the project.
The first definition of usage goals was based on in-
complete information about the characteristics of doc-
uments and features. The discussion of intermediate
results with the participants led to the development
of suitable feature definitions and usage goals. Based
on this we could refine the evaluation criteria and the
rating functions for extracted values. The customers
gave the feedback that the approach is suitable and
helpful in the described setting.
In the end, we achieved a common understanding
of the influencing factors of feature extraction scenar-
ios for text, how these factors affect the evaluation
results and what solutions (or what kind of solutions)
are suitable to extract what kind of features.
In the following, we give an outlook on which im-
provements can be made especially during the evalu-
ation phase of text mining projects.
First of all, introducing a form of weighted F1
score could prove as useful. Depending on the ap-
plication scenario it might be more important to find
less, but reliable results. This may take into account
a higher rate of FNs (like the feature date of incident
in our scenario 1). In contrast, for use cases similar to
scenario 2, it might be wiser to rather allow a higher
rate of FPs in the document than losing some impor-
tant information.
Although not concerning the three features se-
lected from our industrial use case in this work, hav-
ing to deal with highly imbalanced occurrences of
features within the document sets causes well-known
challenges. For example, features with a small set
of target classes (like yes/no), predicting always ’yes’
may achieve a high evaluation score when the target
values occur very uneven. Here using Cohen’s kappa
(Cohen, 1960) instead of F1 score seems to be a good
option and will be investigated in the future.
REFERENCES
Apache Software Foundation (2019). Uima ruta.
https://uima.apache.org/ruta.html.
Capterra Inc. (2019). Text mining software.
https://www.capterra.com.de/directory/30933/text-
mining/software.
Carnerud, D. (2014). Exploration of text mining methodol-
ogy through investigation of qmod-icqss proceedings.
In 17th QMOD-ICQSS Conference, Prague, Czech
Republic.
Chapman, P., Clinton, J., Kerber, R., Khabaza, T., Reinartz,
T., Shearer, C., and Wirth, R. (2000). Crisp-dm 1.0
step-by-step data mining guide. Technical report, The
CRISP-DM consortium.
Chinchor, N. (1992). Muc-4 evaluation metrics. In Pro-
ceedings of the 4th Conference on Message Under-
standing, MUC4 ’92, page 22–29, USA. Association
for Computational Linguistics.
Cohen, J. (1960). A coefficient of agreement for nominal
scales. Educational and Psychological Measurement,
20(1):37–46.
Davis, M., Emmott, S., Brethenoux, E., and Vashisth,
S. (2019). Market guide for text analytics.
https://www.gartner.com/en/documents/3892564.
Doddington, G., Mitchell, A., Przybocki, M., Ramshaw, L.,
Strassel, S., and Weischedel, R. (2004). The automatic
content extraction (ace) program-tasks, data, and eval-
uation. Proceedings of LREC, 2.
Esuli, A. and Sebastiani, F. (2010). Evaluating informa-
tion extraction. In Agosti, M., Ferro, N., Peters,
C., de Rijke, M., and Smeaton, A., editors, Multilin-
gual and Multimodal Information Access Evaluation,
pages 100–111, Berlin, Heidelberg. Springer Berlin
Heidelberg.
Evelson, B. and Sridharan, S. and Perdoni,
R. (2019). The Forrester Wave
TM
: AI-
Based Text Analytics Platforms, Q2 2018.
https://www.forrester.com/report/The+Forrester+
Wave+AIBased+Text+Analytics+Platforms+Q2+
2018/-/E-RES141340.
Ferro, L., Gerber, L., Mani, I., Sundheim, B., and Wilson,
G. (2005). Tides 2005 standard for the annotation of
temporal expressions. Technical report, MITRE.
Google (2019). Tessseract ocr.
https://opensource.google/projects/tesseract.
Grishman, R. and Sundheim, B. (1996). Message un-
derstanding conference-6: A brief history. In Pro-
ceedings of the 16th Conference on Computational
Linguistics - Volume 1, COLING ’96, pages 466–
471, Stroudsburg, PA, USA. Association for Compu-
tational Linguistics.
Hamon, T. and Grabar, N. (2013). Extraction of ingredient
names from recipes by combining linguistic annota-
tions and crf selection. In Proceedings of the 5th Inter-
national Workshop on Multimedia for Cooking &
Eating Activities, CEA ’13, pages 63–68, New York,
NY, USA. ACM.
Jiang, R., Banchs, R. E., and Li, H. (2016). Evaluating and
combining name entity recognition systems. In Pro-
ceedings of the Sixth Named Entity Workshop, pages
21–27, Berlin, Germany. Association for Computa-
tional Linguistics.
Manning, C. D., Raghavan, P., and Sch
¨
utze, H. (2008). In-
troduction to Information Retrieval. Cambridge Uni-
versity Press, New York, NY, USA.
Nadeau, D. and Sekine, S. (2007). A survey of named entity
recognition and classification. Lingvisticae Investiga-
tiones, 30.
Onan, A., Koruko
˘
glu, S., and Bulut, H. (2016). Ensem-
ble of keyword extraction methods and classifiers in
text classification. Expert Systems with Applications,
57:232 – 247.
PAT Research (2019). Top software for
text analysis, text mining, text analytics.
ICPRAM 2020 - 9th International Conference on Pattern Recognition Applications and Methods
190

https://www.predictiveanalyticstoday.com/top-
software-for-text-analysis-text-mining-text-
analytics/.
Singhal, A., Simmons, M., and Lu, Z. (2016). Text
mining for precision medicine: automating disease-
mutation relationship extraction from biomedical lit-
erature. Journal of the American Medical Informatics
Association, 23(4):766–772.
Suominen, H. et al. (2009). Performance Evaluation Mea-
sures for Text Mining. IGI Global, Hershey, PA, USA.
Tjong Kim Sang, E. F. and De Meulder, F. (2003). Intro-
duction to the CoNLL-2003 shared task: Language-
independent named entity recognition. In Proceed-
ings of the Seventh Conference on Natural Language
Learning at HLT-NAACL 2003, pages 142–147.
Wiedemann, G. and Heyer, G. (2017). Page stream seg-
mentation with convolutional neural nets combining
textual and visual features. CoRR, abs/1710.03006.
Goal-based Evaluation of Text Mining Results in an Industrial Use Case
191
