
Fools Rush In: Competitive Effects of Reaction Time in Automated
Trading
Henry Hanifan and John Cartlidge
a
Department of Computer Science, University of Bristol, Merchant Venturers Building, Woodland Road, Bristol, U.K.
Keywords:
Agent Based Modelling, Auctions, Automated Trading, Financial Markets, Simulation, Trading Agents.
Abstract:
We explore the competitive effects of reaction time of automated trading strategies in simulated financial mar-
kets containing a single exchange with public limit order book and continuous double auction matching. A
large body of research conducted over several decades has been devoted to trading agent design and sim-
ulation, but the majority of this work focuses on pricing strategy and does not consider the time taken for
these strategies to compute. In real-world financial markets, speed is known to heavily influence the design
of automated trading algorithms, with the generally accepted wisdom that faster is better. Here, we introduce
increasingly realistic models of trading speed and profile the computation times of a suite of eminent trading
algorithms from the literature. Results demonstrate that: (a) trading performance is impacted by speed, but
faster is not always better; (b) the Adaptive-Aggressive (AA) algorithm, until recently considered the most
dominant trading strategy in the literature, is outperformed by the simplistic Shaver (SHVR) strategy—shave
one tick off the current best bid or ask—when relative computation times are accurately simulated.
1 INTRODUCTION
As trading in financial markets has become in-
creasingly automated, the importance of speed is
paramount. Competition between automated trading
systems (ATS) looking to capitalise on fleeting op-
portunities ahead of rivals has resulted in a prolif-
eration of high frequency trading (HFT) algorithms
capable of executing many thousands of trades each
second (Duffin and Cartlidge, 2018). The effects of
ever-faster ATS (the so called race to zero) can be ob-
served in the dynamics of modern financial markets:
individual stocks now frequently exhibit ten percent
price swings in less than one tenth of a second (John-
son et al., 2013); flash crashes can cause whole mar-
kets to lose a trillion dollars in five minutes (Baxter
and Cartlidge, 2013); and when market-leading ATS’s
malfunction, the owners can be pushed to bankruptcy
in under an hour (Baxter and Cartlidge, 2013).
Yet, the literature on automated financial trading
agents is largely bereft of considerations of compu-
tational speed, with the majority of work focusing
on pricing strategies. One reason for this is largely
historical, with trading agent experiments tending to
follow Vernon Smith’s seminal design that helped
a
https://orcid.org/0000-0002-3143-6355
birth the field of experimental economics (Smith,
1962). Using human participants, Smith (1962) set
up a simple marketplace where traders took turns
to quote prices and execute trades in an open out-
cry style marketplace. To enable strict comparisons
with earlier work, later studies that introduced new
automated trading algorithms (e.g., ZIC (Gode and
Sunder, 1993); ZIP (Cliff, 1997); GD (Gjerstad and
Dickhaut, 1997); and AA (Vytelingum, 2006)) tended
to follow Smith’s original design. Although subse-
quent works have gradually introduced a series of
adaptations, such as the use of an order book (Das
et al., 2001), real-time experiments that include hu-
man and agent participants (Das et al., 2001; De
Luca and Cliff, 2011; De Luca et al., 2011; Cartlidge
and Cliff, 2012), and more realistic market dynam-
ics such as continuous replenishment of assignments
(De Luca et al., 2011; Cartlidge and Cliff, 2012) and
continuously varying equilibria (Cliff, 2019; Snashall
and Cliff, 2020), the time taken for agents to com-
pute their strategy has remained significantly under-
studied.
Several works have demonstrated that altering the
design of trading agent experiments can raise doubt
over how well previously established results trans-
late to real world markets. This had led several au-
thors to call for more experimental realism (e.g., De
82
Hanifan, H. and Cartlidge, J.
Fools Rush In: Competitive Effects of Reaction Time in Automated Trading.
DOI: 10.5220/0008973700820093
In Proceedings of the 12th International Conference on Agents and Artificial Intelligence (ICAART 2020) - Volume 1, pages 82-93
ISBN: 978-989-758-395-7; ISSN: 2184-433X
Copyright
c
2022 by SCITEPRESS – Science and Technology Publications, Lda. All rights reserved

Luca et al. (2011); Cartlidge and Cliff (2012, 2018);
Cliff (2019); Snashall and Cliff (2020)). Here, we
address that challenge by introducing minimal mod-
els of computation time (‘thinking’ time, or ‘reac-
tion’ time, of traders) into the standard experimen-
tal framework. Using an adaptation of the Bristol
Stock Exchange (for open source download, see BSE
(2012); for platform description, see Cliff (2018)), we
explore the competitive effects of computation speed
on a suite of reference trading algorithms available on
the platform: GVWY, SHVR, ZIC, ZIP, and AA.
Perhaps unsurprisingly, results demonstrate that
the relative speeds of trading strategies does affect
profitability. However, depending on the particular
strategies competing in the market, being faster is
not necessarily better. Further, we show that when
relative reaction times are accurately modelled, AA
– long considered the dominant trading agent strat-
egy in the literature – is beaten in static symmetric
markets by the simple non-adaptive trading strategy
SHVR. Given other recent evidence that AA’s domi-
nance is sensitive to the mixture of competing strate-
gies in the market (Vach, 2015; Cliff, 2019; Snashall
and Cliff, 2020), and the complexity of the market
dynamics (Cliff, 2019; Snashall and Cliff, 2020) this
result adds further support that AA is non-dominant
when markets are more realistically modelled.
The rest of the paper is organised as follows. In
Section 2 we review related work and introduce key
economic concepts and technical details of the trad-
ing agents used in these experiments. In Section 3 we
introduce three methods for modelling trader speed:
(i) fixed ordering, (ii) tournament ranking, and (iii)
speed proportional selection. Section 4 presents re-
sults from a series of experiments with homogeneous
markets (containing one trader type) and heteroge-
neous pair-wise balanced markets (containing two
trader types). In Section 5 we discuss the implications
of results and describe avenues for future work. Fi-
nally, Section 6 presents the conclusion that reaction
speeds matter, and therefore the research community
will benefit from future focus in this area.
2 BACKGROUND
2.1 Trading Agent Experiments
In the 1960s, Vernon Smith conducted a series of trad-
ing experiments with small groups of untrained hu-
man participants (i.e., students) to investigate compet-
itive market behaviours (Smith, 1962). He was able
to demonstrate that these simple simulations of finan-
cial markets produced surprisingly efficient equilibra-
Figure 1: Symmetric supply and demand schedules, show-
ing a market with n = 10 buyers (demand) and n = 10 sellers
(supply). Limit prices for buyers (maximum price to buy)
and sellers (minimum price to sell) are evenly distributed
over the interval [£0.10,£1.90], giving theoretical equilib-
rium price P
0
= £1.00 ± 0.10 and expected quantity trans-
acted Q
0
= n/2 = 5. Intra-marginal traders, to the left of
Q
0
, expect to transact. Extra-marginal traders do not.
tion behaviours, with trade prices quickly tending to
the theoretical equilibrium value predicted by the un-
derlying market supply and demand. Intriguingly,
three decades later, Gode and Sunder (1993) were
able to reproduce similar results, but this time using
‘zero intelligence’ (ZI) algorithmic traders that gen-
erate random quote prices. Despite their simplicity,
markets of ZIC traders (the letter C indicating traders
are constrained to not make a loss) were shown to
exhibit equilibration behaviours similar to that of hu-
mans, suggesting that intelligence is not necessary for
competitive markets to behave efficiently: the market
mechanism (the rules of the continuous double auc-
tion) performs much of the work.
However, Gode and Sunder’s (1993) result was
later shown to only hold when market demand and
supply are symmetric (i.e., when the magnitude of the
gradient—the price elasticity—of supply and demand
schedules are similar, such as the example shown in
Figure 1). For asymmetric markets, such as when the
supply curve is horizontal, ‘zero’ intelligence is not
enough to provide human-like levels of market effi-
ciency (Cliff, 1997). To account for this, Cliff intro-
duced a new minimally-intelligent trading algorithm,
which he named Zero Intelligence Plus (ZIP). ZIP
maintains an internal profit margin, µ, which is in-
creased or decreased by traversing a decision tree that
considers the most recent quote price, the direction
of the quote (buy or sell) and whether it resulted in a
trade. Margin, µ, is then adjusted with magnitude pro-
portional to a learning rate parameter, similar to that
used in Widrow-Hoff or in back-propagation learn-
ing. Cliff (1997) successfully demonstrated that mar-
kets containing only ZIP traders will exhibit human-
like behaviours in all of Smith’s original experimental
market configurations, both symmetric and asymmet-
Fools Rush In: Competitive Effects of Reaction Time in Automated Trading
83

ric.
Other intelligent trading agents have been devel-
oped to maximise profits in experimental markets that
follow Smith’s framework. Most notably, these in-
clude: GD, named after its inventors, Gjerstad and
Dickhaut (1997); and Adaptive-Aggressive (AA), de-
veloped by Vytelingum (2006). GD selects a quote
price by maximising a ‘belief’ function of the likely
profit for each possible quote, formed using histori-
cal quotes and transaction prices in the market. Over
time, the original GD algorithm has been successively
refined: first by Das et al. (2001) and Tesauro and
Das (2001) (named Modified GD, or MGD) to en-
able trading using an order book (see example in
Figure 2), and to reduce belief function volatility;
and then by Tesauro and Bredin (2002), who used
dynamic programming to optimise cumulative long-
term discounted profitability rather than immediate
profit (GD eXtended, or GDX). In contrast, AA in-
corporates a combination of short-term and long-term
learning to update an internal profit margin, µ. In the
short-term, µ is updated using rules similar to ZIP.
Over the long-term, AA calculates a moving average
of historical transaction prices to estimate the market
equilibrium value, P
0
, and current price volatility cal-
culated as root mean square deviation of transaction
prices around the estimate P
0
. If the AA trader es-
timates that it is extra-marginal (and will therefore
find it difficult to trade profitably: see Figure 1) it
trades more aggressively (by reducing µ), if it is intra-
marginal (and will therefore find it easier to profit) it
trades more passively (by increasing µ).
For a summary of trading strategies, see Table 1.
2.2 The Battle for Trading Dominance
For the last two decades, a research theme has
emerged: to develop the best trading agent that can
successfully beat human participants and other trad-
ing agents in Smith-style experiments (see Snashall
and Cliff (2020) for a detailed historical account).
It was first demonstrated that trading agents, specif-
ically ZIP and MGD, outperform humans when di-
rectly competing in human-agent markets (Das et al.,
2001): “. . . the successful demonstration of machine
superiority in the CDA and other common auctions
could have a much more direct and powerful finan-
cial impact—one that might be measured in billions
of dollars annually”. This announcement quickly
generated global media coverage and significant in-
dustry interest. Shortly afterwards, Tesauro and
Bredin (2002) suggested that GDX “may offer the
best performance of any published CDA bidding strat-
egy”. Subsequently, after it’s introduction in 2006
Volume Price Price Volume
1 0.97 0.99 2
2 0.96 1.01 1
1 0.94 1.03 3
1 0.90 1.04 1
Bids
Asks
Figure 2: A Limit Order Book (LOB), presenting the cur-
rent market state. Bids (orders to buy) are presented on
the left hand side, ordered by price descending. Asks (or-
ders to sell) are presented on the right hand side, ordered
by price ascending. Volume indicates the quantity avail-
able at each price. The top line presents the Best Bid
(BB = 0.97) and Best Ask (BA = 0.99) prices in the mar-
ket, and the difference between these prices is called the
spread = BA − BB = 0.02. The midprice of the book is
(BB + BA)/2 = 0.98; the microprice is volume weighted
midprice, calculated as: (2/3)0.97 + (1/3)0.99 = 0.977.
Orders can be submitted at any price, subject to a mini-
mum resolution, or tick size (tick = 0.01). Aggressive or-
ders that cross the spread (i.e., an ask with price p
a
≤ 0.97,
or a bid with price p
b
≥ 0.99) will immediately execute at
the price presented in the LOB (i.e., the ask will transact at
price BB = 0.97; the bid will transact at price BA = 0.99).
Passive orders that do not cross the spread will rest in the
LOB, with position determined by price.
(Vytelingum, 2006), AA was shown to dominate ZIP
and GDX (Vytelingum et al., 2008) and also humans
(De Luca and Cliff, 2011): “we therefore claim that
AA may offer the best performance of any published
strategy”. And so, for several years, AA held the
undisputed algo-trading crown.
However, more recently, doubt about the domi-
nance of AA has emerged. In particular, for markets
containing AA, GDX, and ZIP strategies, the mix-
ture (i.e., the proportion) of strategies in the market
has been shown to affect AA performance. In par-
ticular, AA only dominates when there is a signifi-
cant proportion of other AA agents in the market; in
other cases, it is regularly beaten by GDX and ZIP
(Vach, 2015). This finding was supported by Cliff
(2019), through exhaustive testing of markets contain-
ing mixtures of MAA (a slightly modified version of
AA which utilises microprice of the orderbook; re-
fer to Figure 2), ZIC, ZIP, and SHVR (a simple non-
adaptive strategy that quotes prices one tick inside the
current best price on the order book). Further, Cliff
(2019) found that introducing more realistic mar-
ket dynamics—continuous replenishment of assign-
ments, rather than periodic replenishments at regu-
lar intervals; and also a continuously moving equilib-
rium, P
0
, which was set to follow real world historical
trade price data—MAA did not dominate, and when
considering profitability, MAA was significantly out-
performed by ZIP and SHVR. A related study by
Snashall and Cliff (2020) also showed that GDX
dominates MAA, ZIP, ZIC, and ASAD (Assignment-
Adaptive, developed by Stotter et al. (2013)) in these
ICAART 2020 - 12th International Conference on Agents and Artificial Intelligence
84

Table 1: Summary of trading agent strategies when acting as a buyer. When selling, prices are moved in the opposite direction.
Q is new quote price, L is limit price, T is tick size, BB is best bid on the LOB. Traders cannot make a loss, i.e., Q ≤ L.
Agent Name Method to Determine New Quote Price, Q
GVWY Giveaway Q = L. Always post quote at price equal to limit price.
SHVR Shaver Q = min(BB + T,L). Post quote one tick inside current best bid.
ZIC Zero Intelligence
Constrained
Q = q ∈ U [0.01,L]. Quote randomly from Uniform distribution bounded by system
minimum value (one tick, T = 0.01) and limit price, L.
ZIP Zero Intelligence
Plus
Q = L(1 − µ), where 0 ≤ µ < 1 is an internal profit margin. When a trade occurs, if
Q is greater than trade price, then decrease µ (i.e., raise price), otherwise increase µ.
If new best bid on LOB has price BB > Q, decrease µ (i.e., raise price).
AA Adaptive
Aggressive
Q = L(1 − µ), where 0 ≤ µ < 1 is an internal margin. Estimate market equilibrium,
P
0
, to determine whether L is intra-marginal (L ≥ P
0
) or extra-marginal (L < P
0
). If
extra-marginal, increase aggressiveness (decrease µ); else increase µ.
GDX GD eXtended
(not used in this
study)
Q selected by dynamic programming to maximise cumulative long-term discounted
profitability of a ‘belief’ function that calculates likely outcome of each price, q,
based on the success of previous quotes and transaction prices in the market.
more realistically complex markets (SHVR was not
tested in the latter study).
2.3 Latency and Reaction Speed
Throughout the previous works, the primary motiva-
tion has been focused on pricing strategies for trad-
ing efficiency (i.e., profit maximisation and market
equilibration behaviours). However, if we are to bet-
ter understand the behaviour of these algorithms in
more realistic environments, it is important to con-
sider latency, a key real-world factor that is missing
in most of these studies. In real-world financial mar-
kets, communication latency (the differential delays
in which traders can access trading information and
initiate trades with an exchange), and trading latency
(or reaction time: the time it takes for a human or
algorithmic trader to react to new information) are
major determinants of trading behaviours and mar-
ket dynamics (Duffin and Cartlidge, 2018; Snashall
and Cliff, 2020). In real markets, the proliferation
and profitability of high frequency trading (HFT) evi-
dences the efficacy of harnessing reduced latency, en-
abling traders to capitalise on fleeting opportunities
ahead of competitors.
Several studies have conducted human-agent and
agent-agent trading experiments using real-time asyn-
chronous trading platforms. For their seminal demon-
stration of agents outperforming human traders, Das
et al. (2001) used a hybrid platform consisting of
two of IBM’s proprietary systems: GEM, a dis-
tributed experimental economics platform; and Ma-
genta, an agent environment. Although real-time
asynchronous, trading agents were constrained to op-
erate on a sleep-wake cycle of ¯s seconds, with fast
agents having mean sleep time ¯s = 1, and slow agents
having mean sleep time ¯s = 5. A random jitter was in-
troduced for each sleep s such that: s ∈ [0.75 ¯s,1.25 ¯s].
Fast agents were set to wake on all new orders and
trades, slow traders were set to wake only on trades.
Therefore, although this real-time system enabled
asynchronous actions, algorithmic traders were artifi-
cially slowed to have reaction times comparable with
human traders.
Following Das et al. (2001), other real-time
human-agent experiments have invoked a similar
sleep-wake cycle. Using the Open Exchange (OpEx)
platform (download available: OpEx (2011)), De
Luca et al. (2011) demonstrated AA, GDX, and ZIP
outperform humans when agents have sleep-wake
cycle ¯s = 1; agent-agent experiments, demonstrat-
ing AA dominance, were performed using a discrete
event model (such that reaction times were ignored).
OpEx has also been used for further human-agent ex-
periments, for example, to demonstrate that: aggres-
sive (spread-jumping) agents that are faster (i.e., those
with lower ¯s values) can perform less well against hu-
mans (De Luca et al., 2011); faster trading agents can
reduce the efficiencies of human traders in the mar-
ket (Cartlidge et al., 2012); and agents with reaction
speeds much quicker than humans can lead to endoge-
nous fragmentation within a single market, such that
fast (slow) traders are more likely to execute with fast
(slow) traders (Cartlidge and Cliff (2012); a result that
has analogies with the robot phase transition demon-
strated in real-world markets (Johnson et al., 2013)).
Agent-only real-time asynchronous experiments
have also been conducted using the Exchange Portal
(ExPo) platform (download available: ExPo (2011)).
Stotter et al. (2013, 2014) used ExPo to introduce
a new Assignment-Adaptive (ASAD) trading agent.
They demonstrated that in ASAD:ZIP markets (with
sleep-wake cycle, ¯s = 4), signals produced by the
trading behaviour of ASAD are beneficially utilised
Fools Rush In: Competitive Effects of Reaction Time in Automated Trading
85

by ZIP traders, to the detriment of ASAD themselves.
Communications latency has been considered in
other works, e.g.: Duffin and Cartlidge (2018) model
latency arbitrage in fragmented markets; and Miles
and Cliff (2019) study the effects of latency in simu-
lated markets distributed globally in the cloud. Trad-
ing speed has also been incorporated into strategies,
e.g.,: Gjerstad (2003) used a pace parameter to con-
trol the arrival rate of GD (renamed Heuristic Belief
Learning, or HBL) traders, and to alter quote price
as a function of elapsed time; and McGroarty et al.
(2019) introduced an agent model of financial mar-
kets with agents that operate on different timescales to
simulate common strategies and behaviours, such as
market makers, fundamental traders, high frequency
momentum and mean-reversion traders, and noise
traders.
These works are representative of the literature
relevant to reaction time in trading algorithms. In
all, we see that computation times are either skewed
by enforced sleep, directly encoded, or drawn from
a probability distribution. As far as the authors are
aware, there is no attempt to systematically under-
stand the effects of reaction time using accurate com-
putation times of individual strategies. Here, we at-
tempt to address this gap.
3 METHODOLOGY
3.1 BSE: The Bristol Stock Exchange
The Bristol Stock Exchange (BSE) is a minimal,
discrete-time simulation of a centralised financial
market, containing a single exchange with Limit Or-
der Book (LOB), and reference implementations of
several leading trading strategies from the literature,
including five trading strategies that we consider in
this paper: GVWY, SHVR, ZIC, ZIP, and AA. For
a summary description of each trader, see Table 1.
For full details on BSE, refer to Cliff (2018). Python
source-code for BSE is available open-source on the
GitHub repository (BSE, 2012).
1
3.1.1 Random Order Selection (BSE Default)
Each time step, BSE ensures all traders act exactly
once by selecting traders at random, without replace-
ment. As such, there is no concept of relative reaction
times of traders. Over the course of a simulation ex-
periment, a fast trader will have the same number of
1
In this paper, we use BSE version 22/07/18, commit
hash: c0b6a1080b6f0804a373dbe430e34d062dc23ffb.
opportunities to act as a slow trader. Due to the ran-
domised sequence of actions, the slower trader will be
able to act first when presented with ‘lucky’ opportu-
nities as often as the fast trader. This is unrealistic.
In the following section, we introduce three simple
models of reaction time to the BSE framework.
3.2 Modelling Reaction Time
3.2.1 Fixed Order Selection
The simplest model of reaction time that we imple-
ment is the ordering model. Here, traders are selected
to update and act in a fixed order, alternating each
time step between buyers first and sellers first to en-
sure bias is not introduced. For each buyer b
i
∈ B and
seller s
i
∈ S (where |B| = |S| = n), we introduce two
orderings:
Order
A
= s
1
,b
1
,s
2
,b
2
,..., s
n
,b
n
(1)
Order
B
= b
1
,s
1
,b
2
,s
2
,..., b
n
,s
n
(2)
In the first time step, one of the orderings is selected
at random (e.g, Order
A
); in the second time step, the
ordering is switched (i.e., Order
B
); the third time step
returns to the first ordering (Order
A
); etc. In this way,
traders s
1
and b
1
are always selected to act first each
time step; s
n
and b
n
are always selected to act last.
We can consider this as traders s
1
and b
1
as acting
much quicker (having a smaller computation time, or
reaction time) than traders s
n
and b
n
.
3.2.2 Tournament Ranking Selection
The second model of reaction time assigns a speed
ranking to each trader. Each time step, we perform
the routine presented in Algorithm 1. We begin by
creating a pool containing all traders, and then se-
lect two traders at random from the pool and compare
rank. The trader with the lowest rank is selected to act
and then removed from the pool. This simulates two
traders racing to act on new market information. We
repeat these steps until all traders have acted and the
pool is empty. Similar to the previous random order
(Section 3.1.1) and fixed order (Section 3.2.1) models,
this process ensures that all traders act exactly once
each time step.
3.2.3 Speed Proportional Selection
The final model of reaction time is the most realistic.
Every trader is initially assigned a reaction time. Each
time step, traders are selected to act in proportion to
their relative speeds, such that trader A, with a reac-
tion time of R
A
= 1 would act twice as often as trader
ICAART 2020 - 12th International Conference on Agents and Artificial Intelligence
86

Algorithm 1: Tournament Ranking.
Result: All traders have acted exactly once
input : P is the set of all traders, size 2n
while (size(P) > 1) do
Randomly select trader A from P;
Randomly select trader B from P;
if (rank(B) > rank(A)) then
Trader A to act;
Remove A from set P;
else
Trader B to act;
Remove B from set P;
end
end
Select remaining trader in P to act;
B with a reaction time of R
B
= 2. To achieve this, each
time step we select traders from a biased pool contain-
ing multiple references to each trader, such that the
number of references is inversely proportional to each
trader’s relative reaction time. For example, if R
A
= 1
and R
B
= 2, we generate a biased pool, P = {A,A,B},
containing two references to trader A and one refer-
ence to trader B. Each time step, traders are randomly
selected to act, without replacement, until the pool is
empty. We use notation R
A
B
= 1/2 to indicate A’s re-
action time is half B’s reaction time; similarly R
B
A
= 2
indicates B’s reaction time is twice as long as A.
This model provides two advantages over the pre-
vious models. First, it enables faster agents to act
multiple times before a slower agent can act (for
R
B
A
= 2, each time step A acts twice, while B acts only
once). Second, it allows slower traders to occasion-
ally get ‘lucky’ by being selected first. Therefore, of
the simple models presented here, this process most
accurately simulates the real world.
3.3 Experimental Configuration
For all experiments, markets contained an equal
number of n buyers and n sellers, with assignment
limit prices distributed evenly across the interval
[£0.10, £1.90], as shown in Figure 1. Market sessions
lasted 330 time steps, with assignments replenished
periodically every 30 time steps. Each simulation
configuration was repeated 100 times. Error bars on
graphs indicate 95% confidence intervals. Statistical
significance is calculated using Student’s t-test. This
simple, static, symmetric market is deliberately cho-
sen to enable comparisons with the literature. Reac-
tion time, using the procedures defined in Section 3.2,
is the only independent variable that we manipulate,
with the BSE default setting (all traders have equal re-
action times) directly equivalent to previous studies.
Figure 3: Fixed order selection for homogeneous ZIP mar-
kets. Buyers (solid blue line) perform better when selected
earlier, while sellers (dashed green line) perform worse.
Figure 4: Fixed order selection for homogeneous AA mar-
kets. All traders tend to perform better when selected later.
4 RESULTS
We present results of experiments originally per-
formed for an MSc project. For further details, see
Hanifan (2019).
4.1 Fixed Order Results
We ran a series of experiments using homogenous
trading populations with fixed order selection. Re-
sults demonstrate that the order in which traders act
had no effect on traders’ performance (measured by
profit generated) for GVWY, SHVR, and ZIC markets
(results not shown). This result is perhaps predictable,
as these simple trading agents cannot identify and op-
timally capitalise on profit making opportunities, un-
less they do so accidentally. However, a difference
can be observed in results for homogeneous ZIP mar-
kets and homogeneous AA markets. In ZIP markets
(Figure 3), there is a significant difference in perfor-
mance between traders selected first (trader 0) and
traders selected last (trader 9). However, perhaps sur-
prisingly, while it is advantageous to be selected ear-
lier when a buyer, it is better to be selected later when
a seller. In AA markets (Figure 4), the ordering has
less impact, but there is a general trend that being
Fools Rush In: Competitive Effects of Reaction Time in Automated Trading
87

(a) AA Profits
Figure 10: The distribution of the ask and bid quote price s wit h t h e homoge -
neous AA BSErank experiment.
These results show that within this market the sellers are generally o↵ering
quote prices with larger profit margins than the buyers, since the pr i ces they
o↵er are further away from the market equilibrium (see Fig 10) and both buyers
and sellers have identical customer orders that are centered around the market
equilibrium. This trend of the sellers operating with a large profit margin but
the buyers operating with a small profit helps to explain why the slower seller
against outperform t he ir faster counterparts, whereas t he faster buyers outpe r -
formed their slower counterparts.
In general within this market the quote prices from the buyers are coming in
higher compared to t h e equilibrium than th e quote prices from the sellers are
coming in low. Due to this it is better for a supplier to act towards the end of
the timestep as by this point more buyers have been able to update their bids
on the LOB, providing more bids to generate profit o↵. This is the opposite for
the buyers as the o↵ers on the LOB are generally providing smaller profits since
the prices are so high, in the rare case however that the supplier o↵ers a very
low bid it is a benefit f or the buyer to act faster in order to secure this trade.
8.3.3 Balanced Tes ts : Trader A vs Trader B
The next experiment I carried out was still within the BSErank system, but
instead of being homogeneous tests, were balanced tests between two traders.
The pr ev i ous two experiments have shown that time can a↵ect the performance
of a trader, namely if the trader is a ZIP buyer. Since we now know th at time
can be a factor, we want to an aly s e how this factor e↵ects di↵erent markets
and whether it impacts di↵erent markets in the same way. For example, so
far the GVWY trader ’ s p e rf or man ce hasn’t been e↵ected, but within markets
containing di↵erent strategies, the speed it reacts to transactions could make a
28
(b) AA Quote Prices
Figure 5: Tournament ranking selection for homogeneous AA markets: (a) fast (grey) buyers outperform slow (white) buyers,
while slow (white) sellers outperform fast (grey) sellers; (b) distribution of quote prices, showing asks (left box-plot) tend to
be posted farther from equilibrium (green line) than bids (right box-plot).
selected later improves performance. In particular,
traders selected last generate significantly more profit
than traders selected first. This could be because AA
traders that act later each time step have additional
information available to produce a better estimation
of P
0
, and therefore are likely to post a more prof-
itable quote. However, this simple ordered model is
very contrived and so we only present these results as
evidence that selection ordering impacts profitability
of the adaptive traders, AA and ZIP. We investigate
further using more realistic models in the following
sections.
4.2 Tournament Ranking Results
4.2.1 Homogeneous Markets
We performed tournament ranking selection in homo-
geneous markets. When pitted against only traders of
the same type, GVWY and ZIP perform better when
faster, but the difference is not significant. For other
traders there is no difference between fast and slow
traders. However, for AA (see Figure 5), we see
that fast buyers significantly outperform slow buyers,
while slow sellers significantly outperform fast sell-
ers. Overall, sellers generate significantly more profit
than buyers, which is a result of prices tending to ap-
proach equilibrium from above. We see that asks (i.e.,
sell quotes) tend to be farther from equilibrium than
bids (i.e., buy quotes), suggesting that sellers are re-
taining higher profit margins than buyers. Therefore,
as there are fewer opportunities for buyers to get a
good deal, being faster is beneficial. Conversely, for
sellers, it is better to be slower, and wait for more at-
tractive bids to arrive each time step before acting.
4.2.2 Heterogeneous: Balanced Tests
In many balanced tests there was no significant dif-
ferences in outcomes between trader strategies when
Figure 6: Balanced test SHVR:GVWY, using tournament
ranking selection. As GVWY (red) increases relative speed
(left to right), SHVR (green) increasingly outperforms
GVWY. Both traders benefit from being ranked slowest.
Figure 7: Balanced test ZIP:SHVR, using tournament rank-
ing selection. ZIP significantly outperforms SHVR when
ZIP is faster (grey bars), but is significantly outperformed
by SHVR when ZIP is slower (white bars).
varying speed using the ranking model (not shown).
However, results for SHVR are interesting. For
GVWY:SHVR (see Figure 6), it can be seen that it
benefits SHVR to be slower than GVWY. GVWY
is an honest strategy (always quoting at the current
limit price) with no consideration of the order book.
Therefore, SHVR benefit from na
¨
ıve GVWY traders
posting earlier each time step. For ZIP:SHVR (see
Figure 7), we see that faster ZIP outperform slower
SHVR, while faster SHVR outperform slower ZIP.
This is the result that we may intuitively expect, if
ICAART 2020 - 12th International Conference on Agents and Artificial Intelligence
88
(a) AA:GVWY (b) AA:SHVR
(c) AA:ZIC (d) AA:ZIP
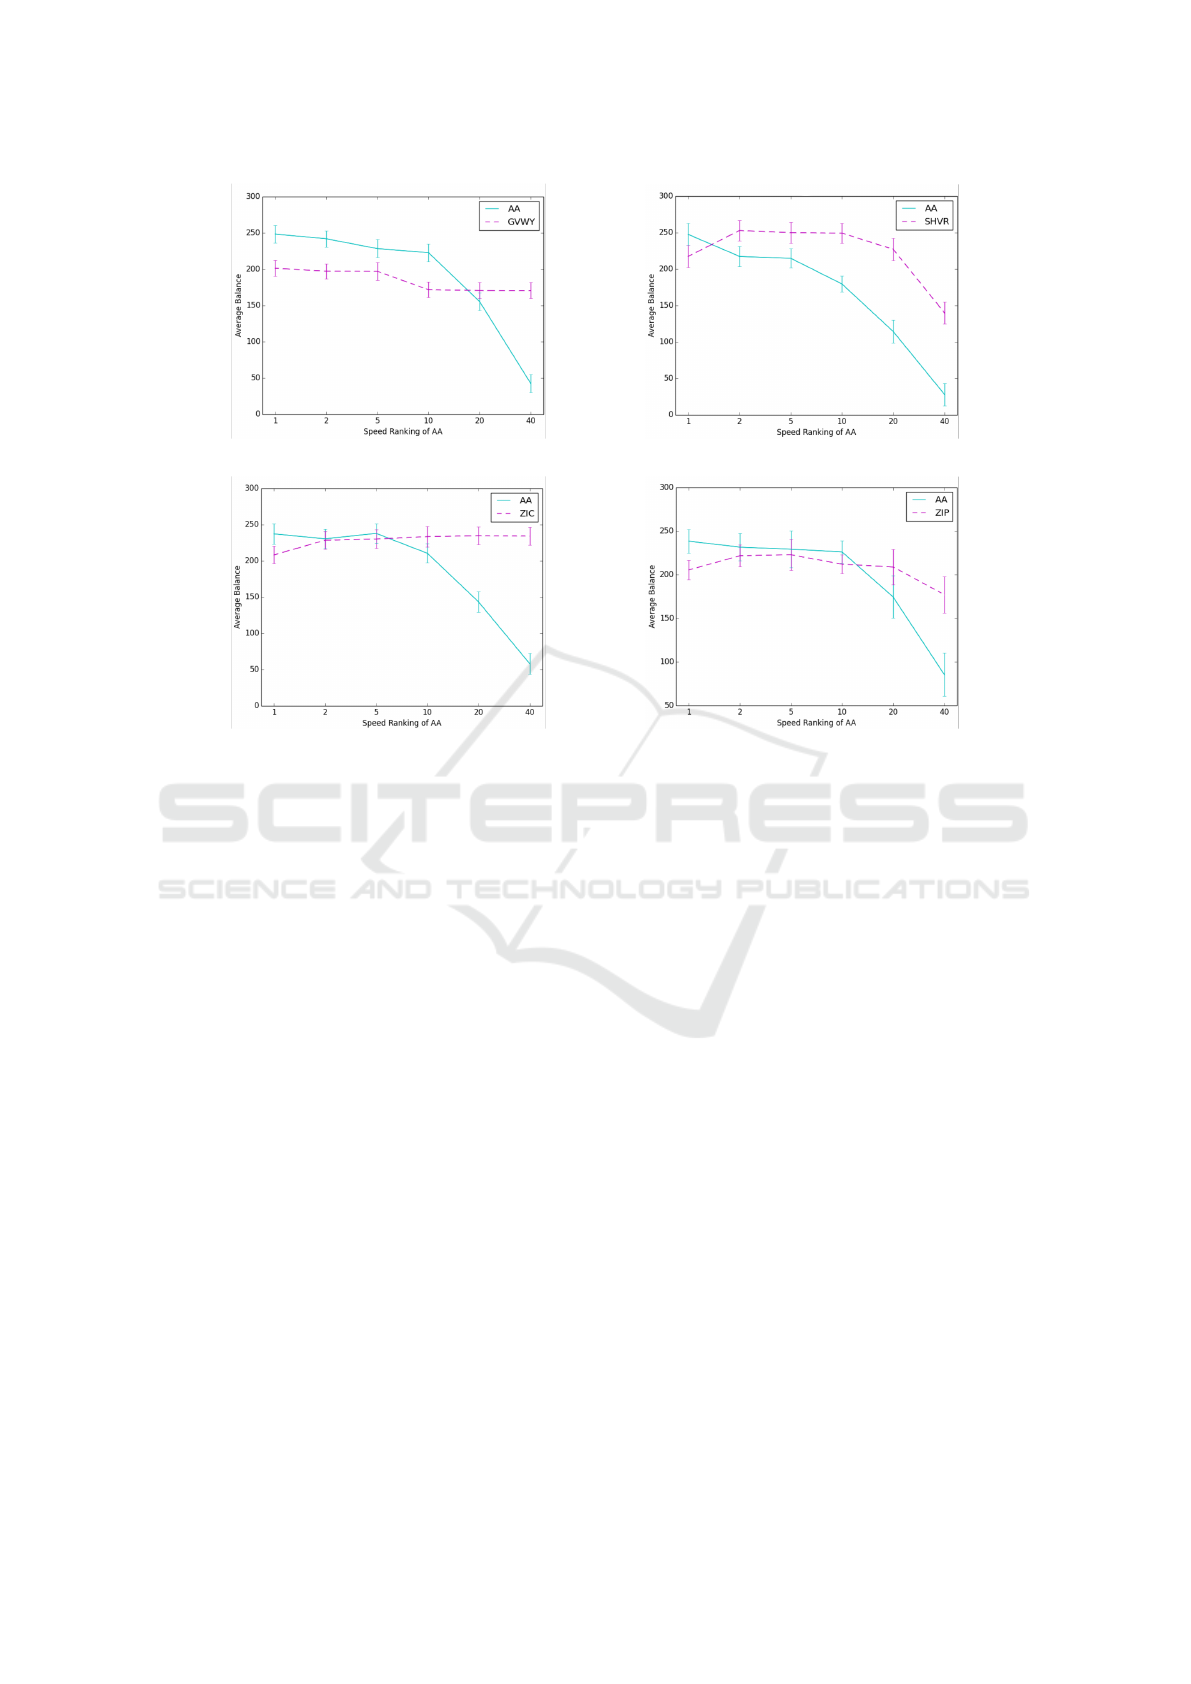
Figure 8: Sensitivity analysis of AA using speed proportional selection in heterogeneous markets. Reaction time of AA
relative to the competing trader type is varied from R
AA
∗
= 1 to R
AA
∗
= 40 (x-axis). Each test, AA (light blue) outperforms the
competitor (purple dash) when compute times are equal (R
AA
∗
= 1). As R
AA
∗
increases, AA performance falls, until an inversion
point is reached where AA no longer outperforms the competitor. For SHVR, inversion occurs between 1 < R
AA
SHV R
< 2.
we consider that faster is always better.
These results indicate that the benefits of speed de-
pend on the competing strategies in the market. For
the parasitic SHVR, which requires a ‘sensible’ order
book to trade sensibly, it is better to be fast when intel-
ligent traders are quoting in the market. Conversely,
when competitors are trading honestly, it is benefi-
cial to be slower. However, while the ranking model
enables traders to directly compete for opportunities
on speed alone, it does not allow faster traders to act
more often than slower traders, which is unrealistic.
We remove this constraint in the following model.
4.3 Speed Proportional Results
4.3.1 AA: Reaction Speed Sensitivity Analysis
Figure 8 presents results of speed sensitivity analysis
of AA performance in heterogeneous balanced-group
tests against each of the other four trading strategies:
(a) GVWY, (b) SHVR, (c) ZIC, (d) ZIP. The reac-
tion time of AA relative to the competing trader type
is varied from R
AA
∗
= 1 to R
AA
∗
= 40. Graphs show
the effect of increasing R
AA
∗
(x-axis). In each case,
we see that when R
AA
∗
= 1 (i.e., equal reaction times),
AA (light blue line) outperforms the competing trader
(purple dashed line). This is the BSE default setting,
and the result conforms to previous findings that AA
dominates in symmetric markets with balanced num-
bers of traders (De Luca and Cliff, 2011).
However, as relative AA reaction time R
AA
∗
is in-
creased, we see that AA performance gradually falls,
until a point is reached where AA is beaten by the
competing trader group. This inversion point varies
between trader groups, but occurs very quickly for
SHVR, between R
AA
SHV R
= 1 and R
AA
SHV R
= 2, suggest-
ing that AA’s dominance over SHVR is sensitive to
small variations in relative trader speeds.
4.3.2 Profiling Reaction Times of Traders
Here, we attempt to accurately profile the reaction
times of each trading agent. In BSE, the computa-
tion time of an agent is composed of two methods:
getOrder, which is called each time a trader is se-
lected to submit a new order into the market, thus re-
quiring the calculation of a new quote price, Q; and
respond, which is called after each market event, and
is used by traders to update internal parameters based
Fools Rush In: Competitive Effects of Reaction Time in Automated Trading
89

Table 2: Profiled reaction times of trading agents.
Trader Time (µs) Stateful Reactive R
∗
SHV R
GVWY 4.2 N N 0.61
SHVR 6.9 N Y 1.00
ZIC 7.1 N N 1.03
ZIP 8.4 Y Y 1.22
AA 9.5 Y Y 1.38
on the event data (e.g., a new trade, or a new best bid
or ask on the LOB).
Of the trading agents considered in this work,
three are stateless: GVWY, SHVR, and ZIC. These
traders have no internal parameters to update and
therefore take no action when their respond method
is called. Only ZIP and AA have an internal state.
These traders use their respond method to update in-
ternal variables in order to calculate a new profit mar-
gin, µ. When getOrder is called, ZIP and AA use
their current profit margin, µ, to calculate a new quote
price, Q = µL. In comparison, GVWY and ZIC gen-
erate a quote price without reference to market data;
SHVR uses the current best bid and ask in the LOB to
generate a new quote price.
Table 2 shows the profiled reaction times of each
trading agent, observed across 52 million method
calls under varying market conditions including pop-
ulation size, mix of traders in the market, assignment
replenishment schedules, etc. (see Hanifan (2019)
for details). Unsurprisingly, we see that the traders
with the longest computation times, ZIP and AA, are
those with an internal state that requires continuous
updating. The relative reaction times between the
fastest and slowest traders is roughly a factor of two:
R
AA
GWVY
= 2.26. The relative reaction times between
AA and ZIP is R
AA
ZIP
= 1.13. This result is consistent
with the average relative times R
AA
ZIP
= 1.19 presented
by Snashall and Cliff (2020), and we take this as con-
firmatory evidence that our profiling is accurate. The
final column of Table 2, headed R
∗
SHV R
, presents reac-
tion time of each trader relative to SHVR. Generating
a quote price relative to the current LOB, SHVR is the
only stateless (and therefore fast) trader that reacts to
market information; although it does so in a simplistic
non-adaptive fashion (unlike the slower AA and ZIP).
4.3.3 Results using Profiled Reaction Times
We used profiled computation times (Table 2) for pro-
portional selection in heterogeneous balanced-group
tests for pairwise comparisons between all trader
types. The majority of results showed no signif-
icant difference, suggesting the relative differences
in reaction speeds between the trader agents are not
large enough to have an impact. However, results
for ZIP:SHVR and AA:SHVR were particularly in-
teresting (see Figure 9). For ZIP:SHVR (Figure 9(a)),
under BSE’s default randomised selection process
(white bars), ZIP outperforms SHVR. However, when
selecting traders proportional to their true relative
speeds (grey bars) SHVR outperforms ZIP (although
the difference is not significant). A similar, but more
pronounced trend emerges between AA:SHVR (Fig-
ure 9(b)). Here, AA significantly outperforms SHVR
under the default randomised selection (white), and
significantly underperforms SHVR under speed pro-
portional selection (grey).
5 DISCUSSION
The result presented in Figure 9, demonstrating
SHVR is more profitable than AA (significantly, p <
0.05) and ZIP (not significant, p > 0.05) is a novel
result. By accurately accounting for the relative re-
action times of the two algorithms, we have demon-
strated that, in balanced tests, SHVR—the simple
non-adaptive order book strategy—is able to gener-
ate more profit than AA in a Smith-style static sym-
metric marketplace, of the kind that AA was specif-
ically designed to succeed in (Vytelingum, 2006),
and in which several studies have previously demon-
strated AA as being the dominant known strategy
(Vytelingum et al., 2008; De Luca and Cliff, 2011).
More recently, the dominance of AA has been
questioned in several works. Using the discrete-event
simulation mode of OpEx, Vach (2015) used Smith-
style markets (similar to those used here) to com-
pare efficiencies of traders in markets containing AA,
GDX, and ZIP, as the proportion of each trader type
in the market was varied. He showed that for large
regions of the mixture space, GDX was the dominant
strategy in these 3-way markets. Later, using BSE,
Cliff (2019) demonstrated that in Smith-style markets
containing equal proportions of MAA (AA modified
to use microprice), SHVR, ZIC, and ZIP, profits per
trader have no significant difference; while in more
complex markets with continuously varying equilib-
ria, SHVR and ZIP significantly outperform MAA on
profits. A follow-up study (Snashall and Cliff, 2020)
demonstrated that GDX dominates in complex mar-
kets containing MAA, ASAD, GDX, and ZIP; and
on average scores greater efficiency than AA in the
simpler Smith-style markets. These works show that
AA’s previously perceived dominance is sensitive to
the mixture of competing strategies in the market, and
the complexity of market dynamics. Here, we were
able to demonstrate that even in Smith-style markets
with two balanced groups of traders (the exact mar-
ICAART 2020 - 12th International Conference on Agents and Artificial Intelligence
90
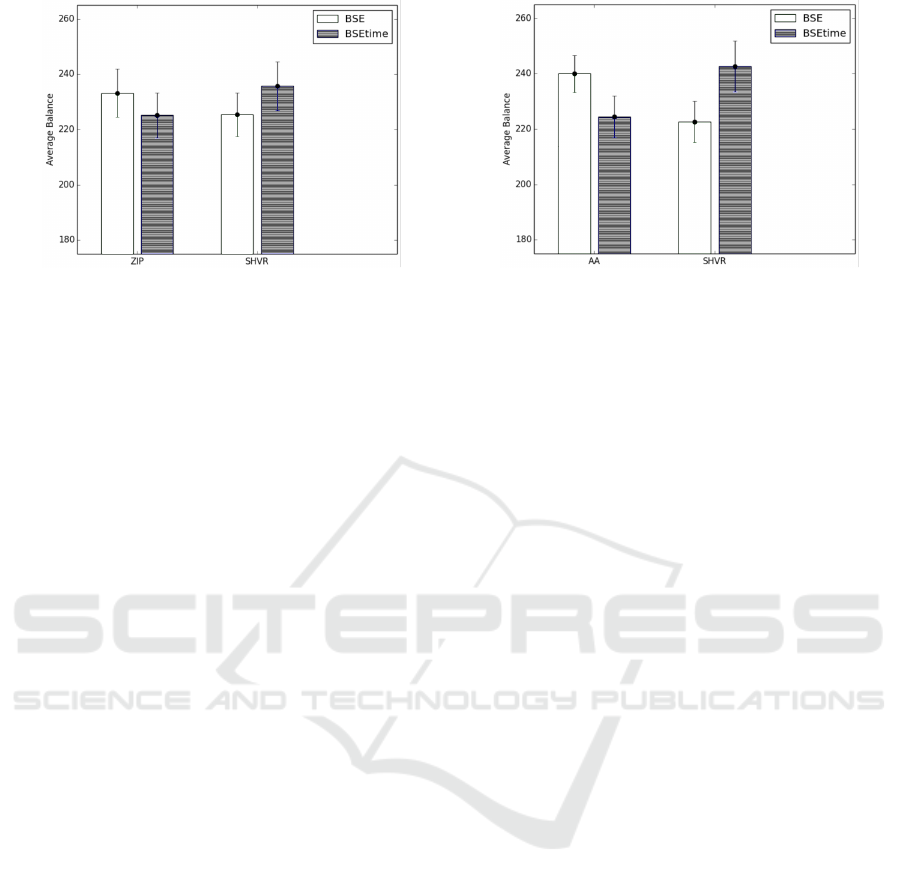
(a) ZIP:SHVR (b) AA:SHVR
Figure 9: Comparison of results between random selection (white) and speed proportional selection (grey), for heterogeneous
markets using profiled thinking times (see Table 2): (a) SHVR outperforms ZIP under speed proportional selection (not
significant); (b) SHVR significantly outperforms AA under speed proportional selection.
kets that AA was previously shown to dominate), AA
is less profitable than the simple SHVR strategy when
we account for reaction speed.
We believe that this finding is significant, not only
because it contributes to the recent body of evidence
suggesting that AA is non-dominant, but also because
it demonstrates that the performance of adaptive trad-
ing algorithms (AA and ZIP) are sensitive to reaction
time; and once reaction time is considered, SHVR
may be relatively superior. In more complex markets
designed to emulate real-world financial dynamics,
SHVR has previously been shown to outperform AA
and to perform similarly to ZIP (Cliff, 2019). Here,
we extend this result to show that SHVR can also
outperform in simple markets, once we account for
speed. In this study, we have not considered the GDX
trading strategy and we reserve this for future work.
However, we note that Snashall and Cliff (2020) have
recently profiled the reaction time of GDX and shown
it to be an order of magnitude slower than AA. We
therefore believe that, given the evidence we have pre-
sented here, if we factor in speed using proportional
selection, GDX would likely perform less well than
SHVR (and also AA and ZIP), as each competing
trader strategy would be able to act ten times for every
GDX trader’s action.
All evidence is starting to suggest that SHVR, al-
though extremely simple, could be a profitable trading
strategy to employ. However, we should perhaps not
be too surprised. SHVR is the only agent described in
this paper that directly uses the current order book to
determine quote price (by simply shaving one tick off
the current best bid or ask). While AA, GDX, and ZIP
are able to trade in markets containing an order book,
metrics such as the current spread, volumes, buy/sell
imbalances, etc., are not considered. This is valuable
information that is routinely used by HFT strategies
in the real markets. We therefore suggest that more
emphasis is placed on utilising order book metrics for
trading algorithms. We note that the MAA (modified
AA) strategy introduced by Cliff (2019) considers the
order book microprice to perform calculations for up-
dating profit margin. This is a useful start, however
we believe that this approach should be taken further,
such that strategies should separate into two processes
the long-term function of determining a desired price
(e.g., by updating profit margin), and the short-term
function of working to achieve that price (e.g., by
shaving the bid). One could easily imagine a sim-
ple combination of ZIP and SHVR that could perform
this strategy. We aim to investigate the incorporation
of order book metrics into trading agent strategies in
future work.
In real-world markets, order book information and
reaction speed is so strategically useful that, in or-
der to stop a trader’s trading intention from being
used adversely by predatory competitors, some trad-
ing venues, described as dark pools, do not reveal
quotes (see, e.g., Cartlidge et al. (2019), for a sum-
mary of dark pools and methods for implementing
cryptographically secure dark pool mechanisms us-
ing multi-party computation (MPC)). Further, as the
majority of predatory HFT strategies rely on being
quick(est) to act, there is also some movement in real
markets towards introducing artificial delays (speed
bumps), non-continuous trading, and re-ordering poli-
cies (see, e.g., Mavroudis and Melton (2019) for a
study on the effects of a temporal fairness policy on
the Refinitiv Matching foreign exchange).
In real markets, communications latencies can be
orders of magnitude larger than the reaction times of
automated execution algorithms. However, these la-
tencies can be (relatively easily) minimised by pay-
ing for (costly) services such as exchange hosting
(enabling traders to co-locate equipment within the
same data centre as the exchange matching engines
Fools Rush In: Competitive Effects of Reaction Time in Automated Trading
91

and market data systems for the lowest latency ac-
cess) and direct market access feeds. Therefore, for
all automated trading systems (ATS) making use of
these low-latency services (including the majority of
HFT), communications latency becomes a level play-
ing field. In these circumstances, reaction time is the
principle speed differentiator.
6 CONCLUSIONS
We have introduced methods for simulating the reac-
tion time of trading agents in financial market experi-
ments, using the open-source Bristol Stock Exchange
(BSE) platform. Historically, trading agent experi-
ments have not considered the time it takes for agent
strategies to compute: each time step, agents are se-
lected to act in random order, and agents are unre-
stricted in the (real-world) time taken to compute an
action. This is unrealistic, particularly given the un-
questionable emphasis placed on trading speed in the
real financial markets.
To simulate reaction time, three models were con-
sidered: (i) fixed ordering of agents; (ii) tourna-
ment selection using speed rankings; and (iii) propor-
tional selection of agents relative to speed. The latter
model—the most realistic—enabled fast traders to act
multiple times for each individual action taken by a
slower agent. We demonstrated, unsurprisingly, that
speed does affect trader performance, although being
faster is not always better: the outcome depends on
the competing trader strategies present in the market;
sometimes it can be beneficial to let the fools rush in.
Significantly, we were able to show that when sim-
ulating accurate reaction times of agent strategies, the
simplistic SHVR strategy is more profitable than AA.
Until relatively recently, AA had been considered the
dominant trading algorithm in the published litera-
ture, and this is the first time AA has been shown to be
outperformed by a simple non-adaptive strategy in a
static symmetric market containing two strategy types
with equal numbers.
This result confirms that speed matters, and if we
are to better understand real-world markets it is nec-
essary for reaction times to be considered more thor-
oughly. It also demonstrates that simple order book
strategies can outperform intelligent trading strategies
that make use of machine learning. This suggests that
there should be further investigation into methods for
incorporating order book information into adaptive
trading strategies.
ACKNOWLEDGEMENTS
John Cartlidge is sponsored by Refinitiv.
REFERENCES
Baxter, G. and Cartlidge, J. (2013). Flying by the seat of
their pants: What can high frequency trading learn
from aviation? In Proc. 3rd International Conference
on Application and Theory of Automation in Com-
mand and Control Systems, ATACCS, pages 56–65.
BSE (2012). BSE: The Bristol Stock Exchange.
GitHub public source-code repository available at:
https://github.com/davecliff/BristolStockExchange.
Cartlidge, J. and Cliff, D. (2012). Exploring the ‘robot
phase transition’ in experimental human-algorithmic
markets. In The future of computer trading
in financial markets, Driver Review DR25. Fore-
sight, Government Office for Science: London UK,
https://bit.ly/2llHjbh+.
Cartlidge, J. and Cliff, D. (2018). Modelling complex fi-
nancial markets using real-time human-agent trading
experiments. In Chen, S.-H. et al., editors, Complex
Systems Modeling and Simulation in Economics and
Finance, pages 35–69. Springer International, Cham.
Cartlidge, J., Smart, N. P., and Alaoui, Y. T. (2019). MPC
joins the dark side. In Proc. 14th ACM Asia Con-
ference on Computer and Communications Security,
AsiaCCS, pages 148–159.
Cartlidge, J., Szostek, C., De Luca, M., and Cliff, D. (2012).
Too fast too furious: Faster financial-market trading
agents can give less efficient markets. In Proc. 4th
International Conference on Agents and Artificial In-
telligence: Vol. 2, ICAART, pages 126–135.
Cliff, D. (1997). Minimal-intelligence agents for bargaining
behaviours in market-based environments. Technical
Report HPL-97-91, Hewlett-Packard Labs.
Cliff, D. (2018). An open-source limit-order-book exchange
for teaching and research. In 2018 IEEE Symposium
Series on Computational Intelligence, SSCI, pages
1853–1860.
Cliff, D. (2019). Exhaustive testing of trader-agents in real-
istically dynamic continuous double auction markets:
AA does not dominate. In Proc. 11th International
Conference on Agents and Artificial Intelligence: Vol.
2, ICAART, pages 224–236.
Das, R., Janson, J., Kephart, J., and Tesauro, G. (2001).
Agent-human interactions in the continuous double
auction. In Proc. 17th International Joint Conference
on Artificial Intelligence: Vol. 2, IJCAI, pages 1169–
1176.
De Luca, M. and Cliff, D. (2011). Human-agent auction
interactions: Adaptive aggressive agents dominate. In
Proc. 22nd International Joint Conference on Artifi-
cial Intelligence: Vol. 1, IJCAI, pages 178–185.
De Luca, M., Szostek, C., Cartlidge, J., and Cliff, D. (2011).
Studies of interactions between human traders and al-
gorithmic trading systems. In The future of computer
trading in financial markets, Driver Review DR13.
ICAART 2020 - 12th International Conference on Agents and Artificial Intelligence
92

Foresight, Government Office for Science: London
UK, https://bit.ly/2llv52c+.
Duffin, M. and Cartlidge, J. (2018). Agent-based model ex-
ploration of latency arbitrage in fragmented financial
markets. In 2018 IEEE Symposium Series on Compu-
tational Intelligence, SSCI, pages 2312–2320.
ExPo (2011). ExPo: The Echange Portal. Source-
Forge public source-code repository available at:
https://sourceforge.net/projects/exchangeportal/.
Gjerstad, S. (2003). The strategic impact of pace in dou-
ble auction bargaining. Working Paper, Department
of Economics, University of Arizona.
Gjerstad, S. and Dickhaut, J. (1997). Price formation in
double auctions. Games and Economic Behavior,
22(1):1–29.
Gode, D. K. and Sunder, S. (1993). Allocative efficiency
of markets with zero-intelligence traders: Market as a
partial substitute for individual rationality. Journal of
Political Economy, 101(1):119–137.
Hanifan, H. (2019). Investigating the impact speed has on
the performance of algorithmic traders within the BSE
simulation. Master’s thesis, Department of Computer
Science, University of Bristol, UK.
Johnson, N., Zhao, G., Hunsader, E., Qi, H., Johnson, N.,
Meng, J., and Tivnan, B. (2013). Abrupt rise of new
machine ecology beyond human response time. Sci-
entific Reports, 3(2627):1–7.
Mavroudis, V. and Melton, H. (2019). Libra: Fair order-
matching for elecronic financial exchanges. In Proc.
1st ACM Conference on Advances in Financial Tech-
nologies, AFT, pages 156–168.
McGroarty, F., Booth, A., Gerding, E., and Chinthalap-
ati, V. L. R. (2019). High frequency trading strate-
gies, market fragility and price spikes: an agent based
model perspective. Annals of Operations Research,
282(1):217–244.
Miles, B. and Cliff, D. (2019). A cloud-native globally
distributed financial exchange simulator for studying
real-world trading-latency issues at planetary scale. In
Proc. 31st European Modelling and Simulation Sym-
posium, EMSS, pages 294–303.
OpEx (2011). OpEx: The Open Exchange. Source-
Forge public source-code repository available at:
https://sourceforge.net/projects/open-exchange/.
Smith, V. (1962). An experimental study of competi-
tive market behavior. Journal of Political Economy,
70(2):111–137.
Snashall, D. and Cliff, D. (2020). Adaptive-aggressive
traders don’t dominate. In Agents and Artificial In-
telligence: 11th International Conference, ICAART
2019, Revised Selected Papers, LNAI. Springer Inter-
national.
Stotter, S., Cartlidge, J., and Cliff, D. (2013). Exploring
assignment-adaptive (ASAD) trading agents in finan-
cial market experiments. In Proc. 5th International
Conference on Agents and Artificial Intelligence: Vol.
1, ICAART, pages 77–88.
Stotter, S., Cartlidge, J., and Cliff, D. (2014). Behavioural
investigations of financial trading agents using ex-
change portal (ExPo). In Nguyen, N. T. et al., edi-
tors, Transactions on Computational Collective Intel-
ligence XVII, pages 22–45. Springer, Berlin.
Tesauro, G. and Bredin, J. L. (2002). Strategic sequential
bidding in auctions using dynamic programming. In
Proc. 1st Int. Joint Conf. on Autonomous Agents and
Multiagent Systems: Part 2, AAMAS, pages 591–598.
Tesauro, G. and Das, R. (2001). High-performance bidding
agents for the continuous double auction. In Proceed-
ings of the 3rd ACM Conference on Electronic Com-
merce, pages 206–209.
Vach, D. (2015). Comparison of double auction bidding
strategies for automated trading agents. Master’s the-
sis, Faculty of Social Sciences, Charles University in
Prague, CZ.
Vytelingum, P. (2006). The Structure and Behaviour of
the Continuous Double Auction. PhD thesis, School
of Electronics and Computer Science, University of
Southampton, UK.
Vytelingum, P., Cliff, D., and Jennings, N. (2008).
Strategic bidding in CDAs. Artificial Intelligence,
172(14):1700–1729.
Fools Rush In: Competitive Effects of Reaction Time in Automated Trading
93
