
Using DICOM Tags for Clustering Medical Radiology Images into
Visually Similar Groups
Teo Manojlovi
´
c
1 a
, Dino Ili
´
c
1
, Damir Mileti
´
c
2 b
and Ivan
ˇ
Stajduhar
1 c
1
University of Rijeka, Faculty of Engineering, Department of Computer Engineering, Vukovarska 58, 51000 Rijeka, Croatia
2
University of Rijeka, Clinical Hospital Centre Rijeka, Clinical Department for Radiology,
Kre
ˇ
simirova 42, 51000, Rijeka, Croatia
Keywords:
PACS, DICOM, Medical Imaging, Visual Similarity, Clustering, K-medoids.
Abstract:
The data stored in a Picture Archiving and Communication System (PACS) of a clinical centre normally
consists of medical images recorded from patients using select imaging techniques, and stored metadata in-
formation concerning the details on the conducted diagnostic procedures - the latter being commonly stored
using the Digital Imaging and Communications in Medicine (DICOM) standard. In this work, we explore the
possibility of utilising DICOM tags for automatic annotation of PACS databases, using K-medoids cluster-
ing. We gather and analyse DICOM data of medical radiology images available as a part of the RadiologyNet
database, which was built in 2017, and originates from the Clinical Hospital Centre Rijeka, Croatia. Following
data preprocessing, we used K-medoids clustering for multiple values of K, and we chose the most appropriate
number of clusters based on the silhouette score. Next, for evaluating the clustering performance with regard
to the visual similarity of images, we trained an autoencoder from a non-overlapping set of images. That way,
we estimated the visual similarity of pixel data clustered by DICOM tags. Paired t-test (p < 0.001) suggests
a significant difference between the mean distance from cluster centres of images clustered by DICOM tags,
and randomly-permuted cluster labels.
1 INTRODUCTION
The advances of technology in medicine directly in-
fluenced the quality of diagnosis and treatment of
working with patients in numerous fields. Most no-
tably, these involve new methodologies and tech-
niques, such as Computed Tomography (CT) and
Magnetic Resonance Imaging (MRI). In addition to
new medical procedures and techniques, advances in
technology allowed medical personnel to create, store
and retrieve various information about patients, med-
ical images and other relevant data. To accommodate
for all of that, Picture Archiving and Communication
Systems (PACS) have been developed with a goal of
providing efficient storage, fast retrieval of data and
many other features (Choplin et al., 1992). Even with
this system in place, there was a need for a systematic
and organised way of transferring medical images be-
tween different devices. Digital Imaging and Com-
munications in Medicine (DICOM)
1
is a standard
that solves the problem of interoperability, commu-
a
https://orcid.org/0000-0002-8891-0935
b
https://orcid.org/0000-0003-2890-1890
c
https://orcid.org/0000-0003-4758-7972
1
https://www.dicomstandard.org/
nication and managing of medical data. In this stan-
dard, each medical image consists of a pixel-values
map for the image itself, and of a number of differ-
ent structured tags, either automatically generated by
the acquisition device, or manually set by physicians
(Bidgood et al., 1997). The amount of data stored
by an average clinical radiology department is rapidly
increasing each year. Subsequently, finding similar
cases and navigating PACS repositories, containing
vast amounts of data, becomes more difficult. A suit-
able annotation of medical images would make this
process easier, however manual annotation of images
is expensive and time-consuming (Dimitrovski et al.,
2011). On the other hand, automatic clustering of data
contained in a PACS would allow for easier naviga-
tion and exploration of similar cases. Hence, this pa-
per explores the possibility of automatic clustering of
medical images based on the assigned DICOM tags.
This study involves the analysis of the contents of a
sizeable PACS dataset, and the exploration of the per-
formance of an unsupervised machine learning tech-
nique, i.e. K-medoids, for automatic clustering of
data.
Because the data stored in the relational database
of Clinical Hospital Centre (CHC) Rijeka is insuffi-
510
Manojlovi
´
c, T., Ili
´
c, D., Mileti
´
c, D. and Štajduhar, I.
Using DICOM Tags for Clustering Medical Radiology Images into Visually Similar Groups.
DOI: 10.5220/0008973405100517
In Proceedings of the 9th International Conference on Pattern Recognition Applications and Methods (ICPRAM 2020), pages 510-517
ISBN: 978-989-758-397-1; ISSN: 2184-4313
Copyright
c
2022 by SCITEPRESS – Science and Technology Publications, Lda. All rights reserved

ciently informative for the clustering of images, such
that they would have a sufficient level of detail image-
content wise, DICOM tags associated with the im-
ages were used for this purpose. DICOM files con-
tain numerous meta tags that were recorded during
exams (approximately 4,000 tags total, over the en-
tire dataset). These tags are structured according to
their function, which does not necessarily hold for
their contents. The tags were first analysed both func-
tionally (manually) and content-wise (manually and
automatically), in order to determine the most effec-
tive ways of extracting features, to provide good clus-
tering quality.
A specific goal of our clustering-based annotation
is to create a quality foundation for training a deep
convolutional neural network (CNN) (Krizhevsky
et al., 2012) for transfer learning in medical radiology
imaging (Qiang Yang and Pan, 2010; Yosinski et al.,
2014). When ground-truth labelling exists, e.g. (Xie
et al., 2016; Yang et al., 2010), clustering perfor-
mance is normally evaluated in a supervised manner
(e.g. classification accuracy, F1 score, and so on). In
our case, because ground truth was unavailable, an
alternative (unsupervised) evaluation approach was
used instead, using an image feature-extraction mech-
anism, i.e. an embedding. Because cross-domain em-
bedding (e.g. adapted ImageNet pretrained model)
was shown to be inadequate for evaluating our clus-
tering examples, we opted for building an embed-
der from the data sampled from the same distribu-
tion. Therefore, we propose a clustering-evaluation
pipeline for handling cross-domain unlabelled data.
We elaborate on how this pipeline can be used for
an unbiased estimate of visual similarity between im-
ages. By using the proposed evaluation, we show that
DICOM clustering results in creating visually simi-
lar clusters. We thus demonstrate that DICOM clus-
tering produces embedded image representations that
are statistically better than random groupings. This
proves that the information contained within the DI-
COM labels is useful for grouping visually similar
images.
This work is structured as follows. First, we de-
scribe the related work concerning the potential and
applicability of DICOM tags for various tasks, also
categorising database data. Next, in section 2, we
present the dataset used for clustering using DICOM
tags, as well as the data-analysis and clustering tools
utilised for organising the data. In section 3, we de-
scribe the experimental setup, involving also the de-
scription of the clustering-evaluation pipeline, along
with the results of the evaluation. Finally, in sec-
tion 4, we present a summary of the results obtained,
and give a conclusion.
1.1 Related Work
Although the research focusing on DICOM tags is
sparse, several papers have been published describing
the use of DICOM tags and categorisation of medical
images. As an example, the quality of specific DI-
COM headers for image categorisation is presented
in (Gueld et al., 2003). Although this research has
shown that automated categorisation is implausible,
it should be noted that the utilised sample size was
relatively small, and only one DICOM tag was used
for evaluation. Because the DICOM standard is com-
prised of both automatically generated, and manually
filled in data, the question of using multiple differ-
ent tags for categorisation arises. In (Rahman et al.,
2007), it is argued that due to the size of DICOM
images, they are not suitable for a web-based envi-
ronment, however, they contain very important infor-
mation which can be used for image retrieval from
databases.
Usage of DICOM tags is not limited to categori-
sation only. Researchers have shown that some of the
DICOM tags can be used for optimising dose levels
present in detectors (K
¨
allman et al., 2009). This ex-
ample shows how using DICOM tags can improve the
workflow in medical procedures while maintaining
vendor interoperability. By having access to numeri-
cal data, such as presented in (K
¨
allman et al., 2009),
it becomes obvious that a large number of optimisa-
tion methods and machine learning algorithms can be
applied to these data. In (Avishkar Misra et al., 2005),
a C4.5 model was trained with the help of lung shape
features and DICOM tags to predict lung regions, at-
taining highest accuracy for apical region (96.6%)
and lowest for middle region (92.5%). DICOM im-
ages that are properly stored and managed can provide
valuable information for later studies. A well devel-
oped image-retrieval system will enable researchers
and medical personnel to query patients having simi-
lar medical conditions. Proof of concept applications
were developed in (Van Soest et al., 2014) to store DI-
COM metadata in an RDF repository, and to calculate
imaging biomarkers based on DICOM images, which
enabled searching for images having similar tumour
volumes. In (Zhang and Kagen, 2017), an artificial
neural network (ANN) was trained by extending the
TensorFlow API to process raw DICOM images of
basal ganglia, achieving 93.8% accuracy on the clas-
sification task where the main goal was to detect if a
patient suffers from Parkinson’s disease.
Disadvantages of the DICOM standard include
rough structuring, ambiguity, and often-optional
fields. All of that makes the problem of categoris-
ing medical images difficult. To mitigate the afore-
Using DICOM Tags for Clustering Medical Radiology Images into Visually Similar Groups
511

mentioned problems, a new classification code called
IRMA was proposed in (Lehmann et al., 2003), hav-
ing some advantages with regards to content retrieval
systems used in medical applications, compared to
the DICOM standard. Another approach to medi-
cal image annotation was presented in (Dimitrovski
et al., 2011), using hierarchical multi-level classifi-
cation. Reasons behind this approach were similar
to the ones presented in (Lehmann et al., 2003), and
are related to the DICOM-standard drawbacks. Even
though in this work a new way of image annotation is
provided, it is also stated that automated categorisa-
tion of medical images using DICOM tags is highly
desirable (Dimitrovski et al., 2011).
2 MATERIALS AND METHODS
To be able to categorise images, the data had to be
sourced, analysed and processed, so the models could
be properly trained. This section describes the origin
of the data, the process used to get the final dataset,
and the methods for finding a model that will support
semantic (image-content related) clustering of medi-
cal images based on DICOM tags. Described meth-
ods and tools were implemented in Python using Pan-
das for data manipulation, Matplotlib for generating
visualisations, scikit-learn pyclustering for training
the models, and most importantly, Dask which pro-
vided an API over Pandas, Numpy and scikit-learn,
which in turn enabled parallelization while retaining
most of the functionality from mentioned packages.
For training the convolutional autoencoder, Tensor-
Flow 2 was used.
2.1 RadiologyNet Dataset
Upon receiving a clearance from the legally compe-
tent Ethics Committee, an anonymised, sizeable col-
lection of radiology scans was acquired from the CHC
Rijeka PACS in 2017, through the project UNIRI
16.09.2.2.05. The collection containing approxi-
mately 20 TB of data (approximately 30 million im-
ages, 2.4 million sequences; 1.3 million exams) was
retrieved from the PACS and stored on a workstation
in the possession of the Faculty of Engineering in Ri-
jeka (RITEH), for further work. These images were
recorded during the past decade in several localities
in Rijeka, on multiple devices using several imaging
modalities (mostly MRI and CT). The dataset also in-
volves repeat exams. From the original dataset, ap-
proximately 14 million images are described by at
least one DICOM tag - henceforth, only this subset
was considered for performing the study.
The computational power required for analysing
these data was overwhelming, nonetheless. There-
fore, in order to make the experiments feasible, in
this work we consider only a smaller subset of data,
consisting of approximately 5% of the dataset, which
resulted in a collection of 668849 images randomly
sampled from the original dataset. Images (2D slices)
belonging to volumes were treated as independent im-
ages in this collection. Number of slices per volume
varied in size, depending on the exam type and the
imaging modality used. Because this sample is still
moderately sized, we believe that the conclusions pre-
sented here can be considered relevant, with regard to
the task at hand.
Each DICOM file contains a 2D image, as well as
a set of corresponding tags. Images of slices shaping
specific volumes share the same DICOM tags, with
the exception of those tags related to the relative slice
location. These tags provide useful information about
the procedure undertaken, set both automatically (by
the machine), and manually (by the operator). The
designations of all of these tags are specified by the
DICOM standard, as well as value representation and
the possible lengths of the field.
2.2 Data Analysis and Processing
To be able to understand the data and what is con-
tained within the dataset, we performed a frequency
analysis of tag values. This process consisted of ex-
tracting all distinct values for each DICOM tag indi-
vidually, and calculating the frequency of those dis-
tinct values within a specific DICOM tag. Not only
did this allow a better understanding of the data, but
it was also necessary for determining the number of
missing values, and their percentage for each tag.
For a better understanding of the dataset specifics,
a couple of DICOM tags are explained in more de-
tail. One of those tags is “BodyPartExamined”,
which, as the name suggest, contains the informa-
tion about the anatomic region examined in a specific
diagnostic procedure. This tag is particularly inter-
esting because it is manually entered by performing
physicians, which introduces noise because of misla-
belling, as shown in (Gueld et al., 2003). However,
mislabelling of this specific tag, or any other, was not
evaluated because it would require additional assis-
tance from experts, and a substantial amount of time
because of the size of the dataset used. One of the ex-
amples that can be found in the dataset is the similar-
ity between values. E.g., thoracic spine, which can be
found in “BodyPartExamined” field is written both as
“T SPINE” and “TSPINE”, which of course is con-
sidered to be the same anatomic region, and had to
ICPRAM 2020 - 9th International Conference on Pattern Recognition Applications and Methods
512

be further processed. That goes for multiple different
values in this DICOM tag.
Unlike “BodyPartExamined” which is manually
entered during an exam, an example of a machine-
generated tag is “Modality”. This tag stores the infor-
mation concerning the medical procedure conducted
during a specific exam, such as CT or MRI. Being an
automatically generated tag means that missing val-
ues are non-existent, and the data should not con-
tain any noise from mislabelled data which occurs for
manual input.
Regardless of the features being automatically or
manually entered into a DICOM file, most of them
require some sort of preprocessing in order to make
them suitable for information extraction. An exam-
ple of such tag is “PixelSpacing”, which contains the
information on physical distance between centres of
pixels in a 2D grid. This value is represented as a
two-value array encoded as a string in the following
format: “[x,y]”. This is just one example where the
data type cannot be inferred because the value is en-
coded as a string. For this one, as well as many other
tags, we had to write preprocessing parsers. This was
shown to be a demanding process, and some of the
parsers have proven to be somewhat difficult to write.
This was one of the main reasons that led to the reduc-
tion of the original feature space used in our exper-
iments. The reduced dataset contained 580 features,
some of which were easily converted into correspond-
ing data types. However, many of them were impossi-
ble to automatically convert, and a notable share con-
tained a large amount of missing values, subsequently
making them less informative, and, henceforth, ren-
dering them unsuitable for our goal.
To determine which features to include in the final
dataset, shares of missing values were calculated dur-
ing frequency analysis. These values were sorted in
descending order, and only the first 70 features (those
containing the smallest shares of missing values) were
included. It was possible to include more features,
however, this would have required writing additional
parsers which would have greatly increased the time
needed for data preprocessing. Furthermore, a num-
ber of possible features were dropped from the begin-
ning because some of them (e.g. “SOPInstanceUID”)
were uninformative due to their uniqueness for each
record, whereas other (e.g. “ProtocolName”), al-
though rather important, were extremely difficult to
parse due to manual input from the operator.
After feature (DICOM tag) selection was per-
formed, some of the selected features required addi-
tional parsing and mapping before the dataset could
be finalised for clustering. Parsing was performed
for features containing arrays of numbers encoded
as strings. This was done because encoded data is
meaningless unless transformed to numerical values,
which is why these features were expanded into sev-
eral columns, depending on the number of items in
the encoded array. This also means that the reduced
dataset (after feature selection), which contained 70
features, was then expanded to a total of 85 fea-
tures. Regardless of the problem downscaling, which
was necessary because of the overwhelming computa-
tional load, the used data remained sufficiently infor-
mative for providing meaningful clustering of the data
in the DICOM space, which we prove experimentally
both there and in the autoencoder image-embedded
space.
2.3 Clustering
Because the Euclidean distance is not applicable di-
rectly for mixed data types, the similarity measure
proposed by Gower (Gower, 1971) was used instead.
The similarity metric is calculated using the following
expression:
S
i j
=
p
∑
k=1
s
k
(x
ik
,x
jk
)δ
k
(x
ik
,x
jk
)/
p
∑
k=1
δ
k
(x
ik
,x
jk
), (1)
where p is the total number of features, s
k
is the sim-
ilarity score between k-th feature of the i-th and j-th
data instance. Because there exists a possibility that
some variable is not present in the sample, δ factor
is calculated in the following way - it equals 0 if the
factors are not comparable, and is 1 otherwise. This
solves the problem of existing missing values in the
data.
For the categorical features, the similarity score
between the k-th categorical variables of the i-th and
j-th data instance is calculated using:
s
k
(x
ik
,x
jk
) =
(
1 x
ik
= x
jk
,
0 otherwise,
(2)
and, for the numerical features, similarity is calcu-
lated using:
s
k
(x
ik
,x
jk
) =
|x
ik
− x
jk
|
R
k
, (3)
where R
k
denotes the range for k-th variable. Finally,
the Gower distance between two data instances, i-th
and j-th, is calculated using the following expression:
p
1 − S
i j
. (4)
Although many clustering techniques could be ap-
plied to this problem, in this work we chose to use K-
medoids (L. and P., 1987). This algorithm belongs to
the family of partitional clustering algorithms, and is
Using DICOM Tags for Clustering Medical Radiology Images into Visually Similar Groups
513

similar to K-means, albeit having two important dif-
ferences. Firstly, in K-medoids, the initial cluster cen-
tres are selected among dataset points, and the abso-
lute distance between cluster centres is minimised. It
is important to note that, in terms of accuracy, the K-
medoids algorithm is less sensitive to outliers (Park
and Jun, 2009). The first step of the algorithm exe-
cution starts with K greedily selected medoids, and
in each iteration each training example is assigned to
its closest centroid. After that, for each medoid m, the
switch between the medoid m and the non-medoid o is
made and cost change is calculated. If the best swap
of m and o decreases the cost function, m and o are
swapped. This process is continued in iterations until
convergence is reached.
2.4 Evaluation Metrics
When evaluating clustering results, two main ques-
tions emerge. The first question is related to the op-
timal number of clusters used. A method for visu-
alisation and assessment of cluster numbers, com-
monly used and very popular, is the silhouette score
(Rousseeuw, 1987). Silhouette score carries the in-
formation concerning the extent to which a specific
object fits into some specific cluster, taking into con-
sideration the tightness and the separation of clusters.
Silhouette score values are always falling into the in-
terval [−1, 1], where, the more positive a result is, the
better the separation of clusters is. (Kaufman and
Rousseeuw, 1990) provides one possible subjective
interpretation of the silhouette score. For silhouette
score value smaller than 0.25, we can conclude that
there is no substantial structure. Interval [0.25,0.50]
shows that the structure is weak and requires addi-
tional analysis. If the silhouette score value falls in-
side the interval [0.51,0.70], we can conclude that
a reasonable structure has been found, and interval
[0.71,1] shows that a strong structure has been found.
The second step in the evaluation process is to ex-
amine the visual similarity of the objects clustered to-
gether. There are two popular approaches to extract
visual features from images in an unsupervised man-
ner. The first approach is to use a pretrained model,
e.g. a VGG16 (Simonyan and Zisserman, 2014)
model architecture trained on ImageNet dataset. This,
however, exhibited low performance, even with addi-
tional fine-tuning of model parameters. Instead, an
autoencoder was used ((Masci et al., 2011), (Chen
et al., 2017)). Autoencoder is an unsupervised neural
network used for learning the data encoding, which
is most often used for reducing the dimensionality
of input data. In our case, it was used to learn a vi-
sual embedding. The autoencoder was trained using
a sample of 30000 images which do not appear in the
dataset that was used for clustering (a separate non-
overlapping subset of the entire dataset was used in-
stead).
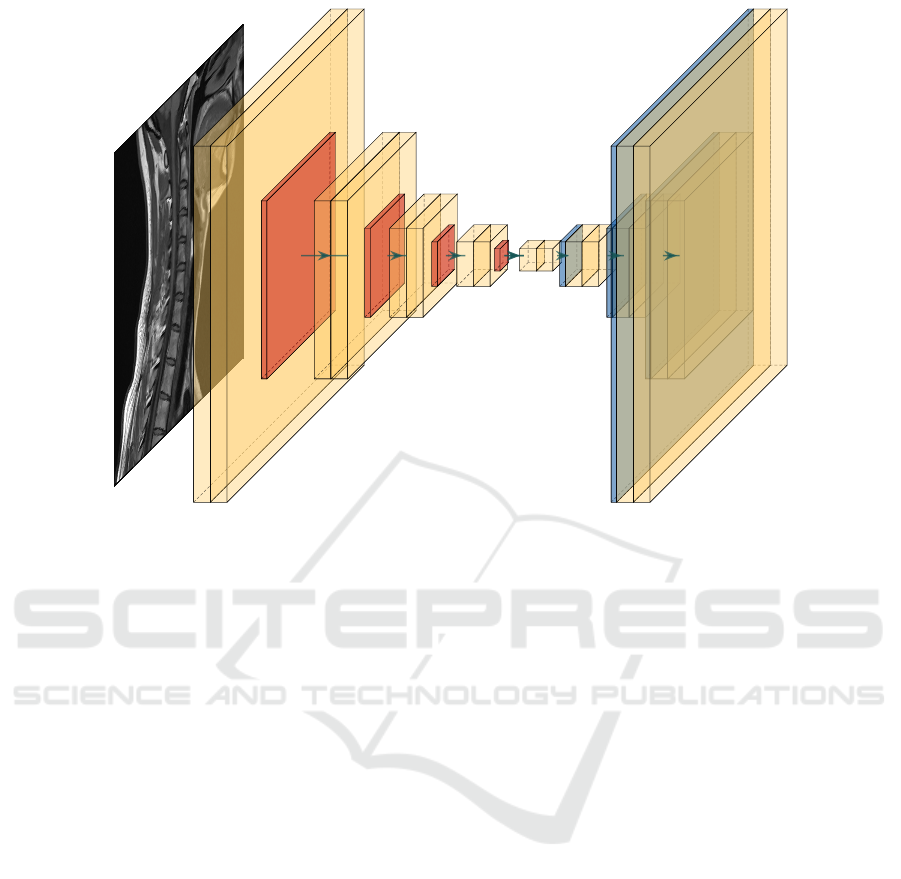
All images were resized into resolution 128x128
and their pixels were normalised to fall into the range
[0,1]. Our trained autoencoder is a convolutional au-
toencoder consisting of two main parts. The first part
is the encoder, consisting of a sequence of two convo-
lutional layers having 64 filters (dimensions 3x3 and
2x2, respectively), and a max pooling layer (2x2 filter
having stride 2). The decoder part of the architec-
ture consists of a sequence of two convolutions layers
(having 64 filters with kernel size of 2x2 and 3x3, re-
spectively), followed by an upsampling layer. The last
encoder and the first decoder layers have 20 filters.
The number of filters is decreased in order to lower
the dimensionality of the image embedding. The ar-
chitecture of the autoencoder used is shown in Fig-
ure 1. To train the model, we use the RMSprop opti-
miser, having MSE as the loss function. Training was
done for 400 epochs using batch size of 40 images.
After the autoencoder was trained, the encoder
part was used to extract relevant image features, to
be used for calculating the distance between images.
Because the space of the visual features on the one
hand, and the DICOM tags, on the other, is inherently
different, one cannot expect that the silhouette score
will match in both domains. Furthermore, if the clus-
ters contain visually similar images, it is less impor-
tant how close they are to other clusters compared to
the scenario where they contain visually diverse im-
ages within a specific cluster. For these reasons, we
calculated the mean distance from the samples with
visual features and cluster centres.
A diagram depicting the entire evaluation proce-
dure is shown in Figure 2.
3 RESULTS
The first step in the evaluation was related to selecting
the optimal number of clusters. We sampled a subset
of 5000 data instances from the original dataset to per-
form the clustering. To speed up the computation, we
calculated a distance matrix between data instances
prior to algorithm execution. The above mentioned
subset size is chosen for two reasons. The first reason
is the computation time required for the computation
of the distance matrix which grows quadratically
with the dataset size. Also, since the distance matrix
is kept in RAM during the computation, there exists
a specific limit in size which can be used. Clustering
was done for K = {5, 10, 15, 20, 100, 200, 300}
ICPRAM 2020 - 9th International Conference on Pattern Recognition Applications and Methods
514
64
128x128
64
128x128
64
64x64
64
64x64
64
32x32
64
32x32
64
16x16
64
16x16
20
8x8
20
8x8
64
16x16
64
16x16
64
32x32
64
32x32
64
64x64
64
64x64
64
128x128
64
128x128
Figure 1: Convolutional autoencoder architecture used for the evaluation of clustering in the pixel space.
clusters, resulting in silhouette scores=
{0.29,0.32,0.37,0.34,0.31,0.25,0.21}, respec-
tively. Because the silhouette score of 0.37 is the
largest, we considered only the cluster size of K = 15
for further analysis. Silhouette score-per-samples,
depicted in Figure 3, shows the existence of several
groups which are well clustered. As it can be seen
in Figure 3, the samples are sorted within clusters by
their silhouette score.
The next step in the analysis was to test if the vi-
sually similar images are grouped together using the
clustering rules inferred from the DICOM tags. Af-
ter calculating the best number of clusters, we sam-
pled 10 non-overlapping datasets consisting of 5000
DICOM images each, which were then clustered by
K-medoids algorithm using K = 15 cluster centres.
Also, we extracted the visual features from these im-
ages using the encoder part of the previously de-
scribed autoencoder. By using the visual-feature em-
beddings from the encoder, and the cluster labels from
the DICOM tags, we calculated the mean cosine dis-
tance between images and cluster centres, and com-
pared it against the mean cosine distance of visual
features obtained using randomly permuted cluster la-
bels. For the DICOM tags, the mean distance be-
tween objects having visual features is 0.28 and for
randomly permuted cluster labels, the mean distance
is 0.42. Standard deviation of the mean distances is
0.023 and 0.017, respectively. For testing, paired t-
test was used. The null hypothesis, stating that there
is no difference in the mean distance from the cluster
centres between visual features with cluster labels in-
ferred by clustering DICOM tags and randomly per-
muted cluster labels, is rejected for t(9), p < 0.001,
the test statistic being 16.42. This confirmed that the
DICOM tags also cluster objects with respect to their
visual similarity (in the pixel space).
4 CONCLUSION
The evaluation procedure described in this paper
shows the information potential of DICOM tags for
grouping related images into visually similar groups.
We prove that DICOM-based clustering can provide a
useful input towards assembling visually more homo-
geneous clusters of images, when compared against
randomly grouped images. We estimated the visual
similarity of images using an unsupervised embed-
ding of the domain images.
Although the results in this insight study look
promising, further work on this topic is necessary.
There are many directions in which the research can
be expanded. Clustering performance can be im-
proved by using different feature selection algorithms.
Various dimensionality reduction algorithms can also
be considered because they reduce noise (unwanted
variance) and offer the possibility for intuitive data
visualisation. Furthermore, developing additional
Using DICOM Tags for Clustering Medical Radiology Images into Visually Similar Groups
515
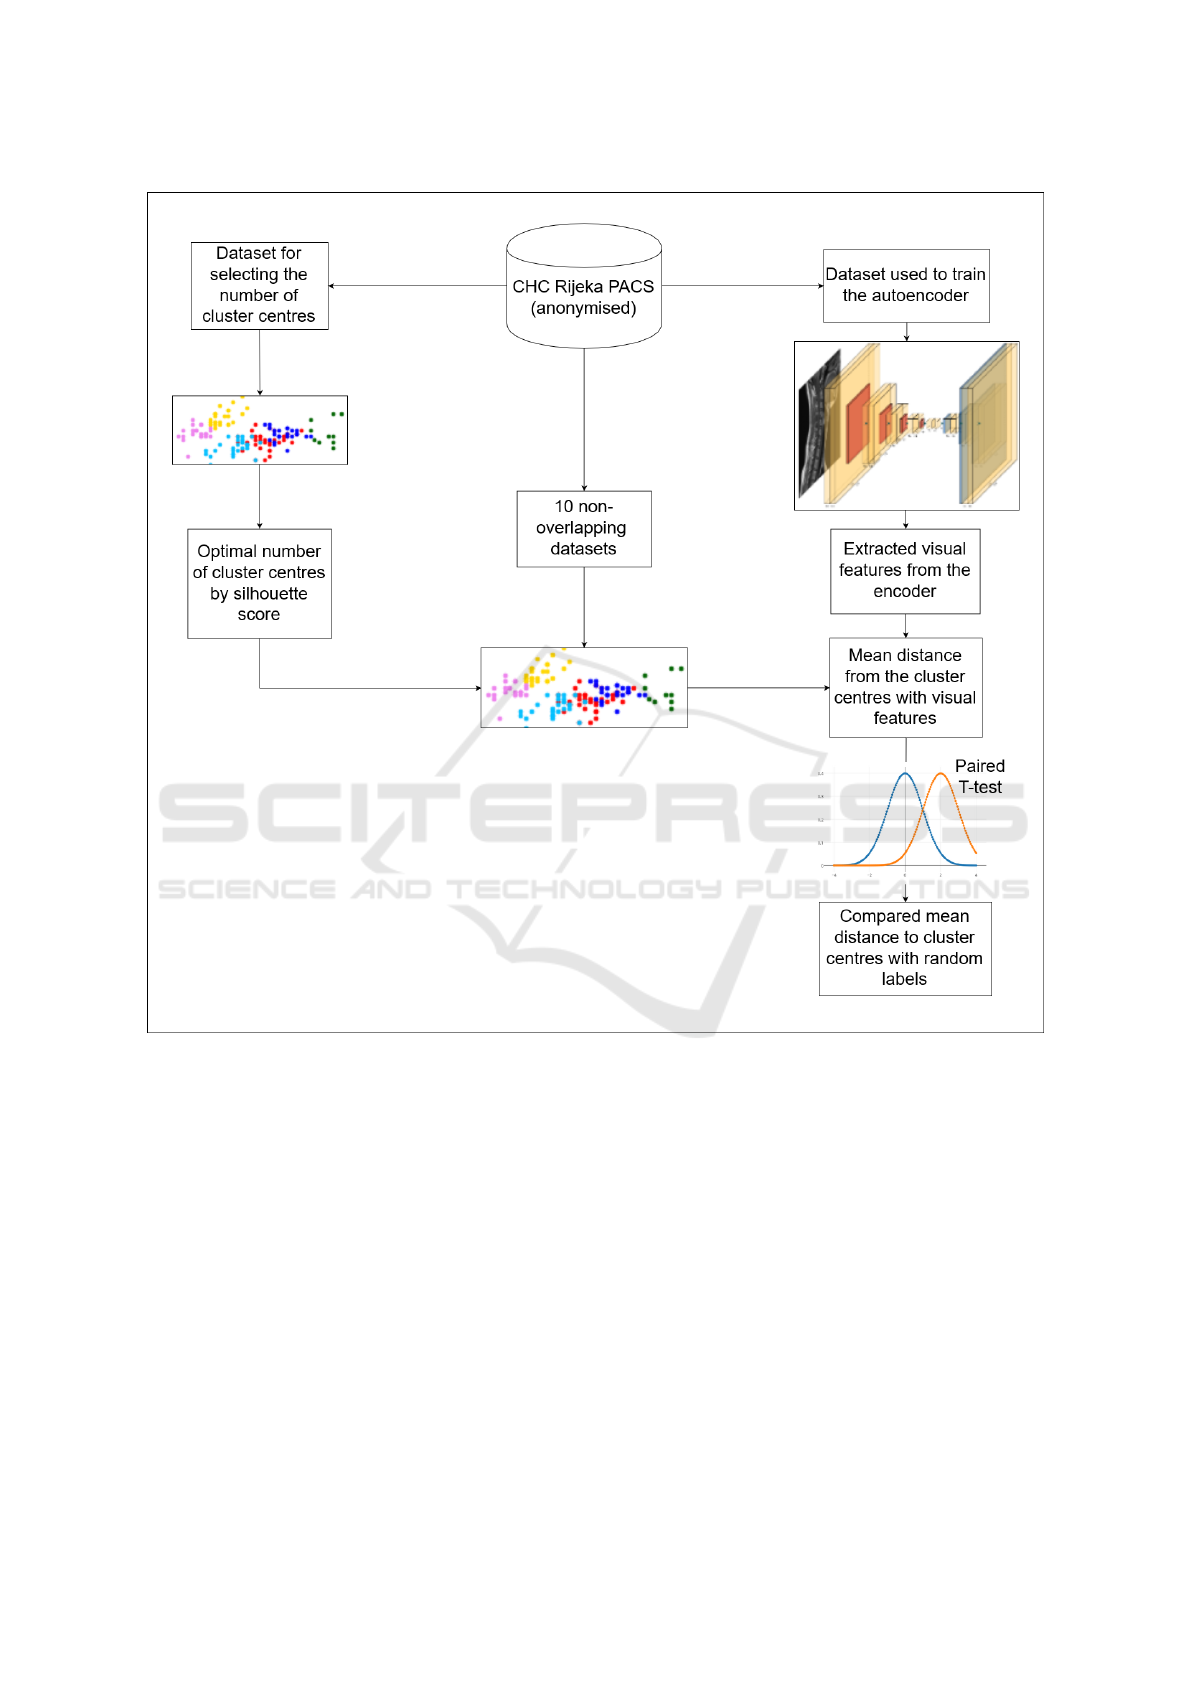
Figure 2: A graphic depiction of the experimental setup, specifically concerning the evaluation procedure used. All mentioned
datasets are mutually disjoint (i.e. non-overlapping).
manually-tailored data parsing techniques for explor-
ing DICOM tags should also be explored. Cluster-
ing performance can probably be improved in addi-
tion by using different clustering algorithms. This
would include the evaluation of the existing model
and comparing it against other techniques, such as the
agglomerative hierarchical clustering (Day and Edels-
brunner, 1984) which might provide even better clus-
tering results. In addition, merging different reposito-
ries of medical images could prove useful because dif-
ferent medical repositories contain images with tag-
assignment standards that could differ significantly,
which is an additional challenge. Another application
involving the use of DICOM data is related to impu-
tation and correcting of missing and falsely inserted
tags, because DICOM tags can be prone to human er-
rors. These ideas can be used to improve the quality
of the set foundation for deriving the semantic struc-
ture of a medical radiology dataset.
ACKNOWLEDGEMENTS
This work has been supported in part by the Univer-
sity of Rijeka under the project number uniri-tehnic-
18-15 and project number uniri-tehnic-18-17.
ICPRAM 2020 - 9th International Conference on Pattern Recognition Applications and Methods
516

Figure 3: Silhouette score for 5000 data instances, using the
number of clusters K = 15.
REFERENCES
Avishkar Misra, Mamatha Rudrapatna, and Arcot Sowmya
(2005). Automatic Lung Segmentation: A Com-
parison of Anatomical and Machine Learning Ap-
proaches. In Proceedings of the 2004 Intelligent Sen-
sors, Sensor Networks and Information Processing
Conference.
Bidgood, W. D., Horii, S. C., Prior, F. W., and Van Syckle,
D. E. (1997). Understanding and Using DICOM, the
Data Interchange Standard for Biomedical Imaging.
Journal of the American Medical Informatics Associ-
ation, 4(3):199–212.
Chen, M., Shi, X., Zhang, Y., Wu, D., and Guizani, M.
(2017). Deep Features Learning for Medical Im-
age Analysis with Convolutional Autoencoder Neural
Network. IEEE Transactions on Big Data.
Choplin, R. H., Boehme, J. M., and Maynard, C. D. (1992).
Picture archiving and communication systems: an
overview. RadioGraphics, 12(1):127–129.
Day, W. H. E. and Edelsbrunner, H. (1984). Efficient algo-
rithms for agglomerative hierarchical clustering meth-
ods. Journal of Classification, 1(1):7–24.
Dimitrovski, I., Kocev, D., Loskovska, S., and D
ˇ
zeroski, S.
(2011). Hierarchical annotation of medical images.
Pattern Recognition, 44(10-11):2436–2449.
Gower, J. C. (1971). A General Coefficient of Similarity
and Some of Its Properties. Biometrics.
Gueld, M. O., Kohnen, M., Keysers, D., Schubert, H., Wein,
B. B., Bredno, J., and Lehmann, T. M. (2003). Quality
of DICOM header information for image categoriza-
tion. In Medical Imaging 2002: PACS and Integrated
Medical Information Systems: Design and Evalua-
tion, volume 4685, pages 280–287. SPIE.
K
¨
allman, H. E., Halsius, E., Olsson, M., and Stenstr
¨
om, M.
(2009). DICOM metadata repository for technical in-
formation in digital medical images. Acta Oncologica,
48(2):285–288.
Kaufman, L. and Rousseeuw, P. J. (1990). Finding Groups
in Data: An Introduction to Cluster Analysis (Wiley
Series in Probability and Statistics).
Krizhevsky, A., Sutskever, I., and Hinton, G. E. (2012). Im-
ageNet Classification with Deep Convolutional Neu-
ral Networks. In ImageNet Classification with Deep
Convolutional Neural Networks, pages 1097–1105.
Curran Associates, Inc.
L., K. and P., R. (1987). Clustering by means of Medoids.
In Statistical Data Analysis Based on the L1 Norm and
Related Methods.
Lehmann, T. M., Schubert, H., Keysers, D., Kohnen, M.,
and Wein, B. B. (2003). The IRMA code for unique
classification of medical images. In Medical Imaging
2003: PACS and Integrated Medical Information Sys-
tems: Design and Evaluation, volume 5033, page 440.
SPIE.
Masci, J., Meier, U., Cires¸an, D., and Schmidhuber, J.
(2011). Stacked convolutional auto-encoders for hier-
archical feature extraction. In Lecture Notes in Com-
puter Science (including subseries Lecture Notes in
Artificial Intelligence and Lecture Notes in Bioinfor-
matics).
Park, H. S. and Jun, C. H. (2009). A simple and fast algo-
rithm for K-medoids clustering. Expert Systems with
Applications.
Qiang Yang and Pan, S. J. (2010). A Survey on Transfer
Learning. IEEE Transactions on Knowledge and Data
Engineering, 22(10):1345–1359.
Rahman, M. M., Bhattacharya, P., and Desai, B. C. (2007).
A Framework for Medical Image Retrieval Using Ma-
chine Learning and Statistical Similarity Matching
Techniques With Relevance Feedback. IEEE Trans-
actions on Information Technology in Biomedicine,
11(1):58–69.
Rousseeuw, P. J. (1987). Silhouettes: A graphical aid to the
interpretation and validation of cluster analysis. Jour-
nal of Computational and Applied Mathematics.
Simonyan, K. and Zisserman, A. (2014). Very deep con-
volutional networks for large-scale image recognition.
cite arxiv:1409.1556.
Van Soest, J., Lustberg, T., Grittner, D., Marshall, M. S.,
Persoon, L., Nijsten, B., Feltens, P., and Dekker, A.
(2014). Towards a semantic PACS: Using Semantic
Web technology to represent imaging data. Studies in
health technology and informatics, 205:166–70.
Xie, J., Girshick, R., and Farhadi, A. (2016). Unsupervised
deep embedding for clustering analysis. In 33rd In-
ternational Conference on Machine Learning, ICML
2016.
Yang, Y., Xu, D., Nie, F., Yan, S., and Zhuang, Y. (2010).
Image clustering using local discriminant models and
global integration. IEEE Transactions on Image Pro-
cessing.
Yosinski, J., Clune, J., Bengio, Y., and Lipson, H. (2014).
How transferable are features in deep neural net-
works? In Ghahramani, Z., Welling, M., Cortes, C.,
Lawrence, N. D., and Weinberger, K. Q., editors, Ad-
vances in Neural Information Processing Systems 27,
pages 3320–3328. Curran Associates, Inc.
Zhang, Y. C. and Kagen, A. C. (2017). Machine Learn-
ing Interface for Medical Image Analysis. Journal of
Digital Imaging, 30(5):615–621.
Using DICOM Tags for Clustering Medical Radiology Images into Visually Similar Groups
517
