
The Root Causes of Compromised Accounts at the University
Philip Nyblom
1
, Gaute Wangen
2
, Mazaher Kianpour
1
and Grethe Østby
1
1
Department of Information Security and Communication Technology, NTNU, Teknologiveien 22, 2815 Gjøvik, Norway
2
IT Department, NTNU, Teknologiveien 22, 2815 Gjøvik, Norway
Keywords:
Root Cause Analysis, Socio-technical Analysis, Passwords, Security by Consensus.
Abstract:
Compromised usernames and passwords are a continuous problem that several organizations struggle with
even though this is a known problem with known solutions. Passwords remain a problem for the modern
University as it struggles to balance the goals of academic openness and availability versus those of modern
cybersecurity. Through a case study, this paper researches the root causes of why compromised user accounts
are causing incidents at a Scandinavian University. The applied method was root cause analysis combined
with a socio-technical analysis to provide insight into the complexity of the problem and to propose solutions.
The study used an online questionnaire targeting respondents who had their accounts compromised (N=72)
to determine the probable root causes. Furthermore, the socio-technical approach consisted of the Security
by Consensus model to analyze how causes interact in the system layers. We constructed a scoring scheme
to help determine the plausible root causes of compromise, and here we identified password re-use across
multiple sites (41.7%) as the most probable cause of individual compromise, followed by weak passwords
(25.0%), malware infections (19.4%) and phishing (9.7%). Furthermore, the socio-technical analysis revealed
structural problems, especially at the ethical-cultural and administrative-managerial layers in the organization
as the primary root causes.
1 INTRODUCTION
Although passwords security is as an old technology,
it remains the most commonly used in web services.
This study explores the root causes (RC) of compro-
mised usernames and passwords (PW) at the Norwe-
gian University of Science and Technology (NTNU).
Compromised users in this report refers to all users
who got their authentication data compromised by
a malicious third party. In 2017, compromised ac-
counts alone accounted for about 70 security inci-
dents at NTNU, averaging 7.5 incidents caused by
compromised accounts every month from Nov 2016
to Mar 2018, with a total of 250 PWs compromised
in the period. It has also become common for crimi-
nals to leak data containing usernames and PWs, such
as in December 2017 when a data dump containing
over 5000 compromised accounts affiliated with the
university and sub-domains was leaked. These had
been accumulated over a period of approximately 15
years and contained both username and PWs, whereof
105 still were valid credentials that provided access.
From an initial incident analysis (Wangen, 2019), the
NTNU security operations centre (SOC) only knew
the initial cause for the compromised PWs in five of
these cases, whereas successful social engineering at-
tacks accounted for all of the known causes. The lack
of knowledge regarding causes makes for the back-
drop of this case study and the purpose of this paper
is to reveal the probable RCs of compromised PWs
at the University. A PW security system comprises
of both social and technical components, henceforth
this study combines the Root Cause Analysis (RCA)
methodology (Andersen and Fagerhaug, 2006) with
the Socio-technical analysis (STA) (Kowalski, 1994).
The RCA is “a structured investigation that
aims to identify the real cause of a problem and
the actions necessary to eliminate it.”(Andersen
and Fagerhaug, 2006) The method originated in
the quality assurance and improvement fields and
is a seven-step methodology that proposes multiple
tools per step. The process is designed to identify
and eliminate the RC of a reoccurring problem.
RCA as a problem-solving paradigm has previously
showed promise for complex information security
(infosec) issues (Julisch, 2003; Huynen and Lenzini,
2017; Collmann and Cooper, 2007; Hellesen et al.,
2018; Abubakar et al., 2016). We apply traditional
RCA combined with a scoring method to investigate
research question I, “What are the RCs of account
540
Nyblom, P., Wangen, G., Kianpour, M. and Østby, G.
The Root Causes of Compromised Accounts at the University.
DOI: 10.5220/0008972305400551
In Proceedings of the 6th International Conference on Information Systems Security and Privacy (ICISSP 2020), pages 540-551
ISBN: 978-989-758-399-5; ISSN: 2184-4356
Copyright
c
2022 by SCITEPRESS – Science and Technology Publications, Lda. All rights reserved
compromise at the University?”. Furthermore, as
PW security is a problem in the combination between
policy, people, and technology, we apply STA for
deeper insight into the underlying dynamics of the
problem by investigating research question II, ”What
are the socio-technical RCs of the PW problem at the
University?” Finally, this study proposes treatments
for the identified RC.
The structure of this paper is as follows:
Section 2 provides the reader with a description
of the case study university together with the back-
ground. The section also contains the results from the
initial steps from the RCA method and concludes with
four probable causes and hypotheses for further inves-
tigation. Section 3 summarizes the applied RCA and
STA methods. The results from the survey and the
RC for each compromise are found in Section 4. The
STA and resulting RC hypothesis, existing counter-
measures, and treatments are discussed in Section 5.
The findings with limitations and proposals for future
work and RC removal are found in Section 6. Finally,
we conclude the study in section 7.
2 BACKGROUND AND CASE
DESCRIPTION
This paper builds on multiple previous studies, firstly,
the survey dataset was initially collected by Huse et
al. (Huse et al., 2018). The case data together with
relevant available statistics were collected from the
security operations center (SOC) at the NTNU and
analyzed by Wangen (Wangen, 2019). At the time
when this study was conducted, the SOC constituency
amounted to about 39,700 students and 6,900 full-
time equivalent staff. There were approximately 1500
servers and 15000 managed clients in the network.
Furthermore, the study refers to a study conducted on
unreported security incidents (Wangen et al., 2019).
The critical incident analysis is a starting point for
the RCA to deduce the outcomes of incidents and the
actions taken by the attackers when they obtained a
PW, visible in Table 1. From the table, we see that
abusing the account for spamming and phishing other
employees is the outcome with the highest frequency.
When it comes to misuse in the table above, it refers to
incidents where unauthorized persons abuse NTNU’s
resources, for example, in research article harvesting
at NTNU’s expense (Wangen, 2019), described as the
Silent librarian campaign (Chapman, 2019). In other
cases, the compromised accounts were used for whal-
ing attempts for financial profit. Other incidents in-
cluded abusing the university infrastructure as a stag-
Table 1: Critical incidents caused by compromised ac-
counts.
Incidents Frequency
Spamming and Phishing 53
Misuse of resources 26
Negligible/Fixed/Failed Attack 8
Brute force 2
Whaling 2
DDOS outgoing 1
As a commodity 1
Copyright/Piracy 1
Hacking tools, exploits and kits 1
ing point for further attacks. One specific incident in-
cluded compromised university PWs being traded as
a commodity on foreign sub-forums illustrating the
value of the access (Huse et al., 2018). Furthermore,
Wangen (Wangen, 2019) documents social engineer-
ing attempts as the most common attacks towards the
university and about 50% of the surveyed staff re-
ported to have been targeted by such attacks.(Wangen
et al., 2019) Thomas et al. (Thomas et al., 2017) stud-
ies how accounts get compromised and found that the
match rate of still active PWs from credential leaks
were at 6.9%, phishing kits gave a match at 24.8%,
and keyloggers had active PWs at 11.9%. Another in-
teresting find was that the compromised accounts dur-
ing their study only had a 2% repeat hijacking rate.
The previous work documents that the university
user accounts are a popular commodity for attack-
ers. Following the problem understanding and brain-
storming steps of the RCA, we identified the follow-
ing four main hypotheses as causing the individual ac-
counts to be compromised:
1. Poor internal security practices, which includes de-
viations from best practices. This might also stem
from weak security policies that are hard to locate.
2. Third-party compromise, where user information
is exposed, published on public websites. This can be
a problem where a lot of people reuse their login cre-
dentials across websites.
3. Social engineering, getting information by fool-
ing someone. Social engineering comes mostly in the
form of phishing and whaling attempts.
4. Malicious software, software used as an aid to ob-
tain user information. This might be spyware, keylog-
gers, bruteforcing or zero-days.
3 METHOD
The method applied in this paper follows the seven se-
quential RCA steps described in literature (Andersen
and Fagerhaug, 2006), although the steps 6. RC elim-
ination and 7. Solution implementation are left out of
The Root Causes of Compromised Accounts at the University
541

study scope. RC removal is discussed in Section 6.
1. Problem Understanding and 2. Brainstorming.
The former is about creating an understanding of the
problem one wants to solve. For this step, we gath-
ered data on the problem through available sources
and semi-structured interviews with experts (the lo-
cal security section and SOC). The incident statistics
from the University SOC (Wangen, 2019) was applied
to populate the Critical incident tool, Table 1. The
goal of brainstorming was to create a list of probable
hypothesis that are causing the problem that can be
further investigated. The results from the problem un-
derstanding and the brainstorming steps are described
in section 2 which proposes four hypotheses for fur-
ther investigation.
3. Data Collection: Online Questionnaire. The
RCA method proposes sampling, surveys, and check
sheets as data collection tools (Andersen and Fager-
haug, 2006) (P. 70). The method recommends to use
sampling when it is not necessary/possible to obtain
the whole dataset, and to use survey when collecting
data from respondents (P.178). Given that we had ac-
cess to the incident records of persons who had suf-
fered a PW security incident, we chose to use an on-
line questionnaire to collect data. By applying the
recommended RCA method to this research problem,
this study assumes that RCs can be derived from sur-
veying the security routines of security incidents vic-
tims. The problem is that the analysis will have to
come up with a hypothesis of compromise with a cor-
responding measurement of certainty for the respon-
dents that do not know the cause. The sample for this
paper was derived from the pool of NTNU accounts
that were compromised within the period Nov 2016 -
Mar 2018. Our research found 167 recipients which
we with high certainty could confirm to be eligible for
participation in the study. 10 out of the 167 were un-
available during the data collection, leaving the total
count of possible respondents to be 157. The inclu-
sion criteria was that all of the recipients had an active
university account at the time of the data collection.
The survey was designed using an internally hosted
version of SelectSurvey software to ensure confiden-
tiality. The survey had five demographic questions
and eighteen regular questions consisting of binary
type questions (yes/no) and Likert-scales. The survey
also had one written response which asked if the re-
spondent knew how he/she got compromised. If they
answered that they knew, they were assigned a self-
reported RC. The survey was designed to investigate
the four identified hypotheses and to identify weak-
nesses in the respondent’s security routines such that
the causes of compromise could be estimated. The
survey went through several iterations of quality as-
surance before it was sent out. In addition to the
questions, the survey contained explanatory text to
the questions, to make it easier for the respondents to
understand the questions we were asking them. Fur-
thermore, we developed a scoring scheme based on
the questionnaire which is described under RC iden-
tification. The questionnaire is found in table 3 and
surveyed the following areas:
• Exposure towards social engineering and phishing
was investigated with questions (Q) 11.3, 12, and
13, which measured the respondents self-reported
awareness towards phishing attacks and if they
thought they had been compromised by these at-
tacks.
• Poor internal security practices was divided into
two categories, (I) Security awareness and (II)
PW strength. (I) was measured through a self-
assessment of security awareness in Q11 and spe-
cific behavioural Qs in 19, 21, and 22.2. (II)
To investigate password practices we designed Qs
based on best practices regarding PW phrases,
complexity and length (Grassi et al., 2017): 16,
17, 18, and 22.1.
• Malicious software was primarily measured with
Qs 14, and scored with Qs 11.1 and 22.3.
• PW reuse and third party compromise was mea-
sured by asking specific behavioral Qs regarding
registering with the University e-mail (Qs 9 and
10) and if they used the university password on
multiple services (Q15.). Q20 asked about PW
change frequencies which can mitigate the PW
reuse risk.
• Finally, Q23 asked about security training offered
by the university.
4. Data Analysis: Statistical Analysis. We applied
the IBM SPSS software for the statistical analysis and
a summary of the statistical tests is as follows:
We applied the Sample Size Calculator from Cre-
ative Research Systems to calculate the confidence in-
terval and margin of error.
1
The binomial distribu-
tion was applied to investigate the sample demograph-
ics and calculate probability.
2
For Descriptive Analy-
sis on continuous type questions, we applied the me-
dian as the primary measure of central tendency. We
also conducted Univariate analysis of individual is-
sues and Bivariate analysis for pairs of questions to
see how they compare and interact. For the Likert-
scale questions, we analyzed the median together with
1
https://www.surveysystem.com/sscalc.htm Visited
June 2019
2
https://www.statisticshowto.datasciencecentral.com/
calculators/binomial-distribution-calculator/ Visited June
2019
ICISSP 2020 - 6th International Conference on Information Systems Security and Privacy
542
an analysis of range, minimum and maximum values,
and variance. We used Pearson two-tailed Correla-
tion Test to reveal relationships between pairs of vari-
ables. The questionnaire had one question with writ-
ten response which we treated by categorizing the re-
sponse within RC categories as a part of the analysis.
The eleven respondents who answered that they knew
how their account was compromised was kept in the
dataset for the summarized statistics in the result sec-
tion. The self-reported RC was also cross-validated
with the answers given in the questionnaire.
5. RC Identification - Scoring Scheme Analysis
and STA. The goal of this step is to identify the RC
of the problem. The questionnaire was designed to
reveal weaknesses in the security routines and the an-
swers given by each respondent was analyzed to as-
sign a RC. We designed a scoring scheme based on
the notion that the weakest security routine was the
probable RC. For example, the scoring scheme infers
that a user answering yes to questions 9., 10., and 15.
regarding PW reuse, but having strong security prac-
tices in other areas was likely compromised by pass-
word reuse. We weighted each Q in the Q groups de-
scribed under data collection to obtain a probable RC
for each compromise. A high score indicates a weak
practice and the highest score is reported as the prob-
able RC. The scoring scheme produces ordinal data
and the overall results are summarized with the me-
dian, minimum, maximum, and range. The scoring
scheme and weights are described in the Table 2.
Table 2: Categories, Questions, and Weights for scoring.
Q Weight
Low Awareness
11 (all) 45%
19 30%
21 10%
22.2 15%
Malware
11.1 15%
14 70%
22.3 15%
PW Reuse
9 10%
10 10%
15 50%
20 30%
Phishing
11.3 15%
12 30%
20 30%
PW Strength
16 25%
17 30%
18 30%
22.1 15%
Furthermore, we applied STA to identify struc-
tural, cultural, methodical, and technical causes of the
problem, together with the secondary causes/factors
influencing the problem. The results from this pro-
cess identify other causes than those identified using
RCA, that is factors the users not necessary control
themselves. Work-based systems, complex and adap-
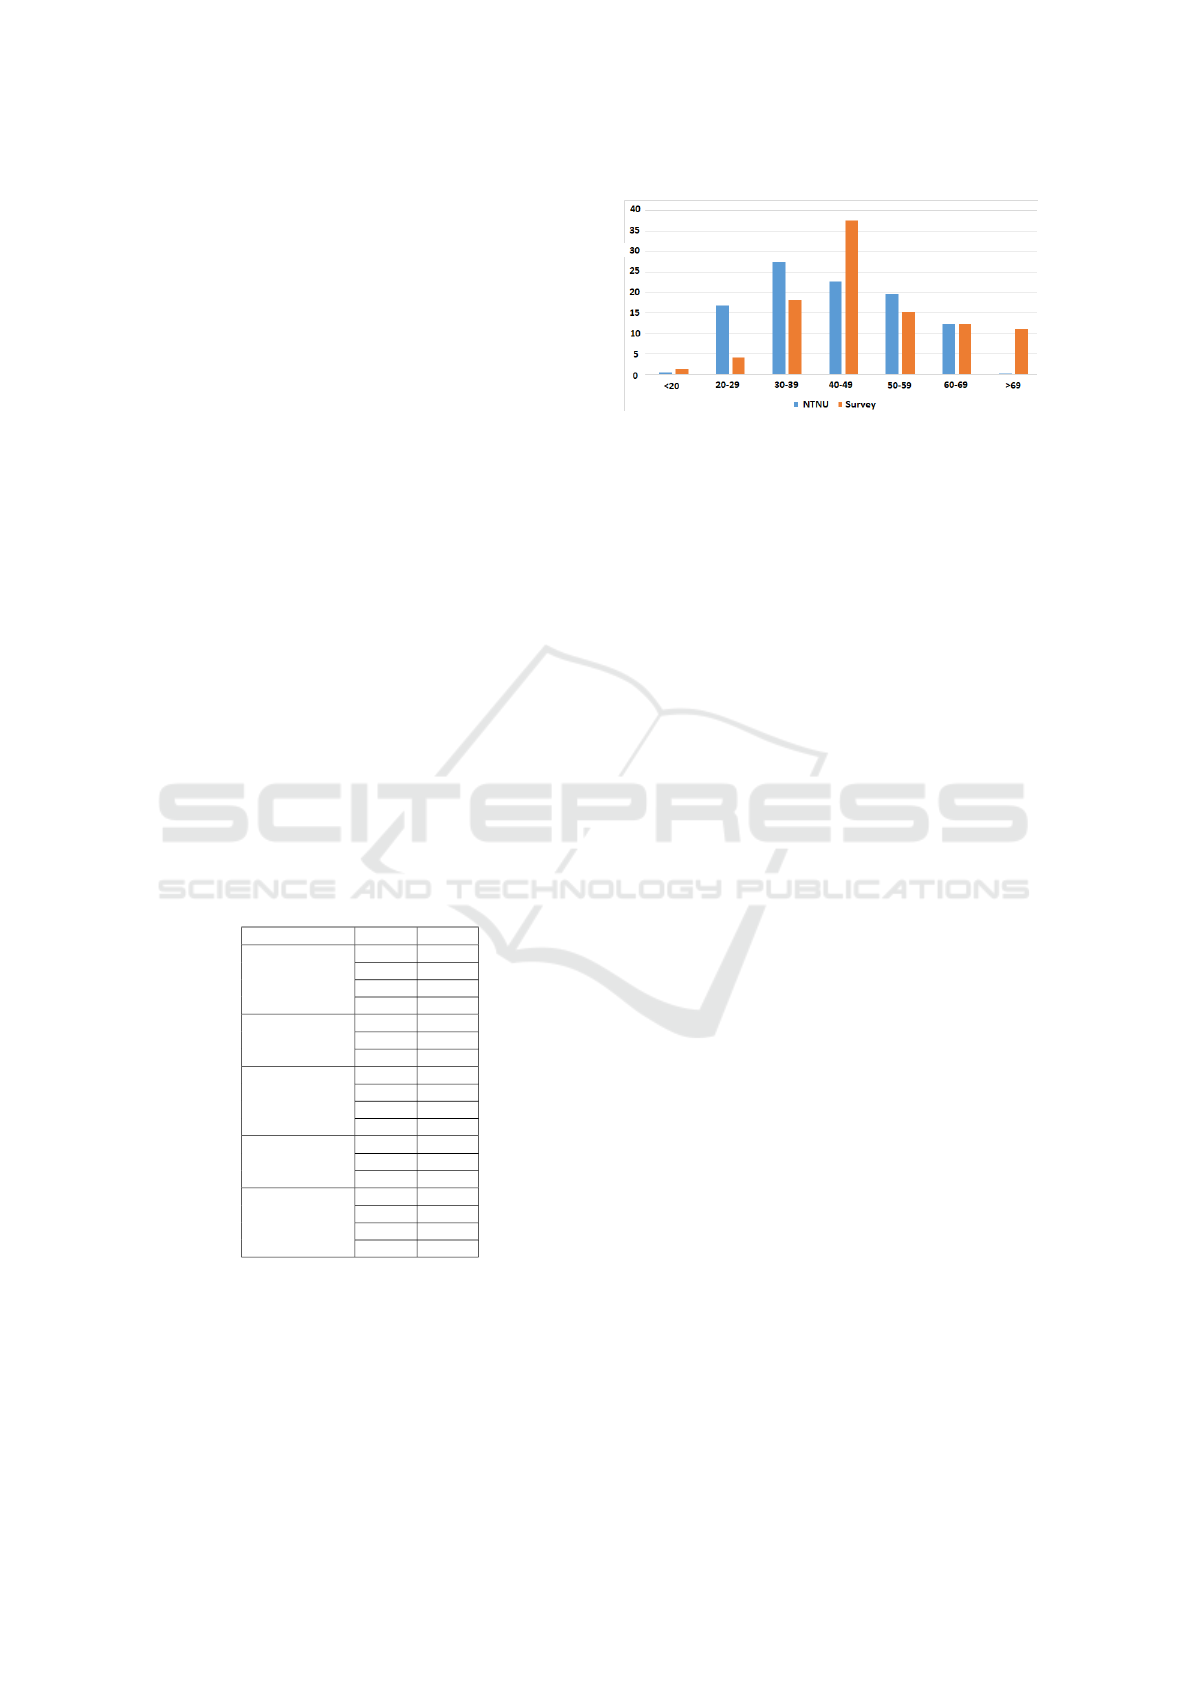
Figure 1: Comparison of age distributions in % for the Uni-
versity and the survey respondents.
tive systems in general, consist of numerous interact-
ing subsystems each working at different levels shown
in Figure 2. In this study we use the Security by
Consensus (SBC) analysis as proposed by Kowalski
(Kowalski, 1994), which is a multi-layered diagram
used to arrange the various causes of this incident.
The feature that distinguishes this analysis from other
incident causation models is that it identifies factors
from all parts of the complex socio-technical system
in which the incident occurred, ranging from physi-
cal sequence of events and activities of the involved
individuals, up to the governmental, regulatory and
social influences (Debrincat et al., 2013). The pre-
cise format of the diagram varies depending on the
purpose of the analysis, however, typically the lower
levels represent the immediate precursors to the in-
cident and the highest levels incorporate the external
factors involving in the incident. The SBC-analysis
was modeled using knowledge about the organization
which was gathered from discussion with domain ex-
perts and technical documentation from IT knowledge
repository. The starting point for the SBC-analysis
was the identified RCs from the previous steps where
we attempted to map out the contributing causes in
the social and technical organizational layers. The
proposed RCs from the SBC-analysis are hypotheses
that can be accepted or rejected through attempted RC
removal.
4 RCA OF PW COMPROMISE
This section describes the results from the statistical
analysis of the survey, starting with the demographics.
Furthermore, the analysis includes the following iden-
tified areas: Security awareness, Phishing, Malware,
Knowledge about security documents, email and PW
reuse, PW strength and habits, and technical and pol-
icy weaknesses. The section concludes with the prob-
able RC for each respondent through analysis and 5-
whys.
The Root Causes of Compromised Accounts at the University
543

Table 3: Survey questions, ‘*’ implies a mandatory question. The University name has been replaced with ”The University”.
No Question Alternatives
1 Your age* Intervals of 10 years starting at 20
2 Your gender* Male, female, prefer not to answer
3 What is your primary role at the University?* Employee, Student
4 In which city do you primarily work/study?* Gjøvik, Trondheim,
˚
Alesund
5 How many years have you been an employee/student at the University?* Less than 2, 2-4. 5-9, 10-15, more than 15
6 When did you realize that your University account had been compromised? “When the Digital Security Section contact you”,
“Before you were contacted”, “I don’t know”
7
Did you have an idea about how long your University account had been compromised before the Less than three months, Three to six months,
Digital Security Section contacted you? Six to twelve months, One to two years,
More than two years
8 Do you have an idea about how your University account was compromised?* Free text
9 Do you use your University email to sign up to various work related online services?* Yes, No, I don’t know
10 Do you use your University email to sign up for online services for private use?* Yes, No, I don’t know
11
On a scale from 1 to 6, where 1 is not aware and 6 is very aware, how aware are you regarding
Likert scale, 1-6
security when (1) browsing websites, (2) creating passwords, and (3) checking your email?*
12
Have you, while working/studying at the University, noticed phishing attempts against you on “Yes, once”, “Yes, multiple times”, “No”,
your University email?* ”I don’t know”
13 Do you think you have been fooled by phishing on your University email?* Yes, No, I don’t know
14 Have you, while working/studying at the University, noticed any viruses or malware on your computer?* Yes, No, I don’t know
15 Do you use your University password on multiple services?* Yes, No
16 Do you make password phrases when generating new University passwords?* Yes, No
17 Is your password randomly comprised of letters, numbers and/or special characters?* Yes, No
18 How many characters does your University password consist of?* Less than 8, 8-11, 12-15, 16-20, More than 20
19 Have you shared your University credentials with others during your time at the University?* Yes, No
20 About how often do you change your University password?*
Less than every six months, Every six months,
Each Year, Every two years, More than every
two years
21 Do you use a password manager?*
“Yes”, “No”, “No, but I have used one before”,
”No, but I have considered it”, ”I don’t know
what a password manager is”
22
On a scale from 1 to 6, where 1 is not familiar and 6 is very familiar, how familiar are you with the
Likert scale, 1-6
(1) University’s guidelines for handling usernames, passwords, and other authentication data?
(2) University’s IT Policy? (3) University’s guidelines for information security?*
23 Have you received training in password security from the University?* Yes, No, I don’t know
4.1 Demographics and Sample
Description
The survey targeted the users who were identified
from the incident data as having their account com-
promised. 72 out of the 167 possible recipients com-
pleted the survey. The survey was live during April
2018. The comparison data about the University was
collected from the database containing statistics about
the higher education in Norway.
3
Given that the total
sample of compromised accounts were 167 and our
sample had 72 respondents, we have a 9% margin of
error (MoE) for a 95% confidence level (CL) assum-
ing a worst case distribution (50%).
The age distribution in both NTNU as a whole and
of the survey respondents is illustrated in Figure 1.
70.8% of the respondents had been employed 10 years
or longer. 12.5% had been employed 5-9 years and
the remaining 16.6% had been employed for less than
5 years. Figure 4 shows that all of the 60 plus re-
spondents together with over 50% of the 50-59 group
respondents have been employed for longer than 15
years. Although the sample size is small, it shows
an over-representation of respondents in the 40-49
and the 70 and above groups, both outside the 9%
3
2018 statistics collected from https://dbh.nsd.uib.no/
MoE. While the ages 20-29 and 30-39 are under-
represented, both outside of the MoE.
Table 4: Age distribution (X-axis) sorted on length of em-
ployment (Y-axis).
<19 20-29 30-39 40-49 50-59 60-69 >70
Under 2 y. 1 1 2 2 0 0 0
2-4 0 1 3 1 1 0 0
5-9 0 1 3 5 0 0 0
10-15 0 0 3 8 4 0 0
Over 15 0 0 2 11 6 9 8
The gender distribution at the university as a
whole is 48% women and 52% men. In the total dis-
tribution of the 167 compromised accounts we found
that 91 (55%) were women and 76 (45%) were men,
which shows an over-representation of women in the
sample. Applying the Binomial distribution we find
that the probability (P) of this specific sub-sample oc-
curring is 1.5%. In a random drawing, we can expect
the number of men to be less than 80 with the P=16%,
and less than 77 has P=5.5% illustrating a steep prob-
ability curve. Based on the results it is likely that gen-
der is a risk factor. For the survey sample, the respon-
dents were 62.5% (45) women and 37.5% (27) men.
ICISSP 2020 - 6th International Conference on Information Systems Security and Privacy
544
4.2 Security Awareness
We started by asking the respondents how they be-
came aware of their account being compromised:
Only 16 of the 72 respondents had been aware of their
account being compromised before being contacted
by the SOC, the remainder either did not know (9) or
became aware when the SOC contacted them. Fur-
thermore, we asked them if they knew how their ac-
count had been compromised: 61 of the respondents
did not know how their account got hacked. There
were five who thought the cause was phishing. Three
responded that PW reuse was the problem. Two who
thought the cause was malware. Lastly, one thought
the cause was hardware theft.
To gather knowledge on the sample’s own security
perceptions, the respondents where surveyed on their
own perception of security awareness when they (i)
browsed websites, (ii) checked their email, and (iii)
created new PWs. The hypothesis was that the tar-
get sample had a low perceived awareness regarding
security issues. However, the respondents reported
their self-perceived awareness as higher than average
regarding all three scenarios. Table 5 shows that all
the distributions are right skewed. The checking the
email-option was of specific interest since one of our
main hypotheses to compromised user accounts was
phishing. The results shows that the respondents are
mostly conscious of security when checking email,
however, 19 of the respondents answered 3 or less in-
dicating low awareness. The responses in Table 5 also
correlated with each other with a Pearson correlation
of 0.540 between Visiting websites and Creating PWs,
Pearson=0.513 between Visiting websites and Check-
ing the email, and Pearson=0.485 between Creating
PWs and Checking the email.
Table 5: On a scale from 1-6, where 1 is “Not aware” and
6 is “Very aware”, how aware are you regarding security
when...
Scenario N Med Var 1 2 3 4 5 6
visiting websites 71 4 1.535 4 6 18 24 14 5
creating PWs 72 4.5 1.526 3 2 10 21 24 12
checking email 70 4.5 2.179 5 5 9 16 20 15
4.3 Phishing
Phishing for credentials is a commonplace attack
against the universities (Chapman, 2019; Wangen,
2019). Over 73.6% of the respondents answered that
they had received phishing email one or more times
on their work email. 19.4% said that they had never
received a phishing email and the remaining 4.2% did
not know. Furthermore, the respondents were asked
if they ever were fooled by phishing emails, where
11 respondents thought they had been fooled at some
time, 5 did not know, and the remaining 56 did not
think they had been fooled. 5 out of the 11 that
thought they had been fooled also stated phishing as
the primary cause for their account compromise.
4.4 Malware
We asked the participants if they had noticed malware
infections on their computer while working at the uni-
versity. 20 of the respondents answered Yes, while 9
did not know. 4 out of the 20 described malware as
the RC of the the account compromise.
4.5 Knowledge about Guidelines, Rules
and Principles
These questions were about how well the respondents
know the University guidelines for processing authen-
tication data, IT regulations and information security
principles. The hypothesis was that the sample would
have a low level of knowledge. It appears from Ta-
ble 6 that the respondents know little about NTNU’s
guidelines for processing of user names, PWs and
other authentication data.
Table 6: On a scale from 1-6, how familiar are you with the
following NTNU IT-security managerial documents. where
1 is “Not aware” and 6 is “Very aware”.
Scenario N Med Var 1 2 3 4 5 6
Authentication 72 2 1.717 19 24 15 6 7 1
guidelines
NTNU IT Policy 72 2 1.690 18 24 14 9 6 1
Infosec guidelines 71 2 1.499 18 25 17 5 5 1
In Table 6, the second line shows that respondents
have a low level of familiarity to the IT regulations of
NTNU. 70% answered 3 or below on how well they
knew the IT regulations. Furthermore, the third row
shows that people have poor knowledge of the uni-
versity’s principles for information security. It says,
among other things, that users are responsible for any
use of login credentials and that they are responsible
for keeping this confidential. The answers to these
questions are also strongly correlated to each other:
Knowledge of Authentication data guidelines corre-
late with NTNU IT Policy with a Pearson=0.765. The
former and Guidelines for information security cor-
relate at Pearson=0.755. Lastly, knowledge of the IT
policy and the information security correlate at a Pear-
son=0.885 level.
The Root Causes of Compromised Accounts at the University
545

4.6 Company Account and PW Reuse
When asked if the respondents use their NTNU ac-
count to sign up for private and work-related services,
48 use the University account for work related ser-
vices and 35 for private services. When asked about
PW reuse 39 out of the 72 respondents reuse their
NTNU PW. 21 respondents use both their NTNU ac-
count and PWs on private services, while 25 respon-
dents use both to log into work related services.
4.7 PW Strength and Habits
Over 60% of the respondents use the NTNU email to
sign up for job-related services. The University in-
formation security guidelines (as of 2018) state that
the PW should be at least 10 characters long, but was
not technically enforced when this study was con-
ducted. The current PW guidelines on PW strength by
NIST (Grassi et al., 2017) claims that longer PWs are
stronger than short and complex ones, so PW length is
an indicator of strength. 13 of the 72 respondents re-
ported to use PW-phrases for constructing new PWs.
Special characters are no longer required according to
the NIST guidelines, but in general makes PWs harder
to guess. They also represent the current guidelines
on the reset PW page, where 43 of 72 respondents
claim to follow this guideline. 65 of the respondents
have an 8-11 character long PW, where only 4 reports
to have a longer PW, and 2 have a shorter PW. Con-
trary to the NIST guidelines which recommend priori-
tizing PW strength over frequent changes, the Univer-
sity policy recommends a yearly PW change but does
not enforce the policy. Respondents following the
NIST standards would have been optimal, but without
this happening passwords, resets might be a necessary
measure to enforce the new PW requirements.
When asked how often the respondents changed
their PW, 56% reported that they changed less fre-
quent than every two years and 22% reported PW
change once every two years. The results shows that
the majority is non-compliant with the PW change
policy, with only 22% reporting to be compliant with
the University guidelines. We also asked about cre-
dential sharing, where the results showed that all of
the 8 respondents that answered Yes on sharing their
PW also spend more than two years between PW
changes. Five out of these eight also reuse their PWs
across multiple services, meaning that they are un-
likely to ever change their PW, they reuse it across
multiple services, and share it with others. This prac-
tice indicates very weak security awareness among a
minority of the respondents.
4.8 Technical and Policy Weaknesses
Although not in the survey, the RCA also uncovered
several technical and policy weaknesses as contribut-
ing causes. Firstly, while the PW requirements had re-
cently been changed according to best practices, they
were still insecure: Firstly, the natural adaptation of
the new PW policy happened too slow when employ-
ees were asked to change. Secondly, when the new
policies for increasing length were implemented, the
old non-compliant PWs were not tested and forced
to update. Leading to weak PWs being allowed in
the database. Lastly, the PW update policy was writ-
ten, but not enforced, allowing users to maintain ac-
cess with old and weak PW. As the final question of
the survey, the respondents were asked if they had re-
ceived any training in PW security. Only five of the
respondents answered Yes.
4.9 Probable Root Causes for Each
Individual Compromise
Table 7: The RC distribution of the individual compromises
using the scoring scheme. Number of assigned causes with-
out and with self-reported cause are at the bottom of the
table.
Low Malware PW Phish PW HW.
awaren. reuse Str. theft
N 72 72 72 72 72
Median 34.5 21 65 24 63.5
Min 7.5 3 15 0 15
Max 82.5 100 100.0 86.5 94
Variance 239,3 996,5 772,9 447,7 336,2
Range 75.0 97 85.0 86.5 79
N RC 2 14 31 4 21 0
N RC 2 14 30 7 18 1
w/self-rep
We analyzed each of the answers provided in the sur-
vey individually to derive a probable RC by apply-
ing the scoring scheme. Table 7 illustrates the sum-
mary statistic for each cause category. A high me-
dian score implies a weak security routine. PW reuse
(65) and strength (63.5) come out with the highest
median overall implying weak practices in the major-
ity of the sample. The range, minimum, and maxi-
mum values for the overall score reveals a high vari-
ance in the scores, with the smallest range being 75
and largest being 97. We expected to see a corre-
lation between PW reuse and PW strength, but did
not find any correlation between any score categories.
The N of assigned RC are located at the bottom of
Table 7, the first line illustrates the results according
to just the scoring system and in the second line we
have adjusted the RC with self-reported causes. Ac-
cording to the RC score findings, the primary RC for
ICISSP 2020 - 6th International Conference on Information Systems Security and Privacy
546

compromised PWs is re-using the company PW on
multiple services, accounting for 31 of the incidents.
This number decreased by one when we accounted for
the self-reported causes. Furthermore, PWs compro-
mised through malware infections account for four-
teen incidents. Although phishing is a persistent prob-
lem for the university (Wangen, 2019) they only ac-
count for seven incidents of compromised PWs in the
dataset. Based on the findings, we attributed two in-
cidents to generic low security awareness. 25% of
the compromises are attributed to weak PWs. The re-
mainder of compromises were attributed to PW reuse.
5 SOCIO-TECHNICAL CAUSES
We have briefly described some technical, manage-
rial and cultural weaknesses in local work entities
and subsystems that impact and are impacted by each
other activities. We performed the 5-whys technique
where you try to determine the RC (Andersen and
Fagerhaug, 2006) as a starting point for the STA. So,
by doing this we came to the following hypotheses:
People lose their account details from phishing be-
cause they have low awareness and knowledge on
how to spot a phishing email. The lack of familiar-
ity with the established policies and guidelines come
from low familiarity with and implementation of the
information security management system (ISMS). Al-
though, the RC of each compromise have been estab-
lished with a level of confidence, one can argue that
they are only symptoms of the underlying structural
weaknesses. For example, the low level of aware-
ness among the respondents is more an organizational
problem than it is the users’ fault. Weak PW habits
can come from difficulty in locating the relevant PW
policy documents and lack of training. The imple-
mented technical controls were also weak, which al-
lowed old PWs to remain in the database with no
forced change. It was a low cost and high benefit
proposition for threat actors to attempt to gain entry
into the network to exploit the available resources.
Based on these notions, we have modelled the prob-
lem using a STA approach to uncover the underlying
causes in the organization.
As Figure 2 shows, we compiled the contributing
factors and their interrelationships into a single dia-
gram to help analysts understand how and why the
incidents take place and find the exact problem areas
that can be addressed to improve system security. The
vertical integration across the levels shows explicit in-
terdependence and the causal flow of the events. The
SBC AcciMap provides insight into the problem and
helps generate additional hypotheses for RC elimina-
tion (the RC 8.,11., 12., and 13. have been covered
previously)
Starting at the Ethical-cultural level, the local aca-
demic culture with a perceived low tolerance for se-
curity requirements in academia is a cause (number
(1.) in the AcciMap), where the modern requirements
of cybersecurity collides with the traditional require-
ments of academic freedom and open learning. For
example, seen from a cybersecurity perspective it is
a risk to let employees install whatever software they
want on their machines, but the research might require
the academics to do so. Furthermore, even though the
ISMS has been approved by the university administra-
tion, the traditional loyalty of the academics lie with
the faculty leadership and not with the central admin-
istration (2.). Additionally, while much of the aca-
demic culture has matured when it comes to dealing
with privacy issues (e.g. health research and GDPR),
discussing and handling cybersecurity issues is still
lagging behind in academia (3.). In the case study
organization, the 3. cause is enforced by the insuffi-
cient channels for communicating and escalating risks
(14.). The non-existence of these forums or channels
to communicate risk across organizational layers sug-
gest cybersecurity immaturity and prevents manage-
ment from understanding the vast impact of the issue.
There are multiple laws, regulations, and national
strategies influencing the university on the legal-
contractual layer (4.): The Personal Data Act, eGov-
ernance regulations, and Health Research Act dic-
tate that an information security management system
(ISMS) must be implemented. While at the time of
study, the ISMS documents were created according to
best practice and approved by management (5.). The
effect of the ISMS was limited due to low informa-
tion availability (6.) and a low management commit-
ment to delegate resources for pushing changes that
intervene in the academic staff’s day-to-day work (7.).
Furthermore, cause 7. in the SBC analysis is likely
affected by the academic culture-causes representing
strong political opposition to further security controls
that are perceived as threatening to academic free-
dom. Low security awareness (8.) is primarily caused
by insufficient security training (9.), where only 5 of
72 in our sample said to have received training. With
no formal risk communication and escalation chan-
nels, insufficient risk communication (3.) enforces
low security awareness low (8.) and this is likely a
self-enforcing loop where low risk understanding in
management will maintain reluctance to invest in se-
curity training for staff and keep the status quo.
The new PW guidelines (10.) derived from the
ISMS were technically enforced for all new employ-
ees and others who are opting to change their PW
The Root Causes of Compromised Accounts at the University
547
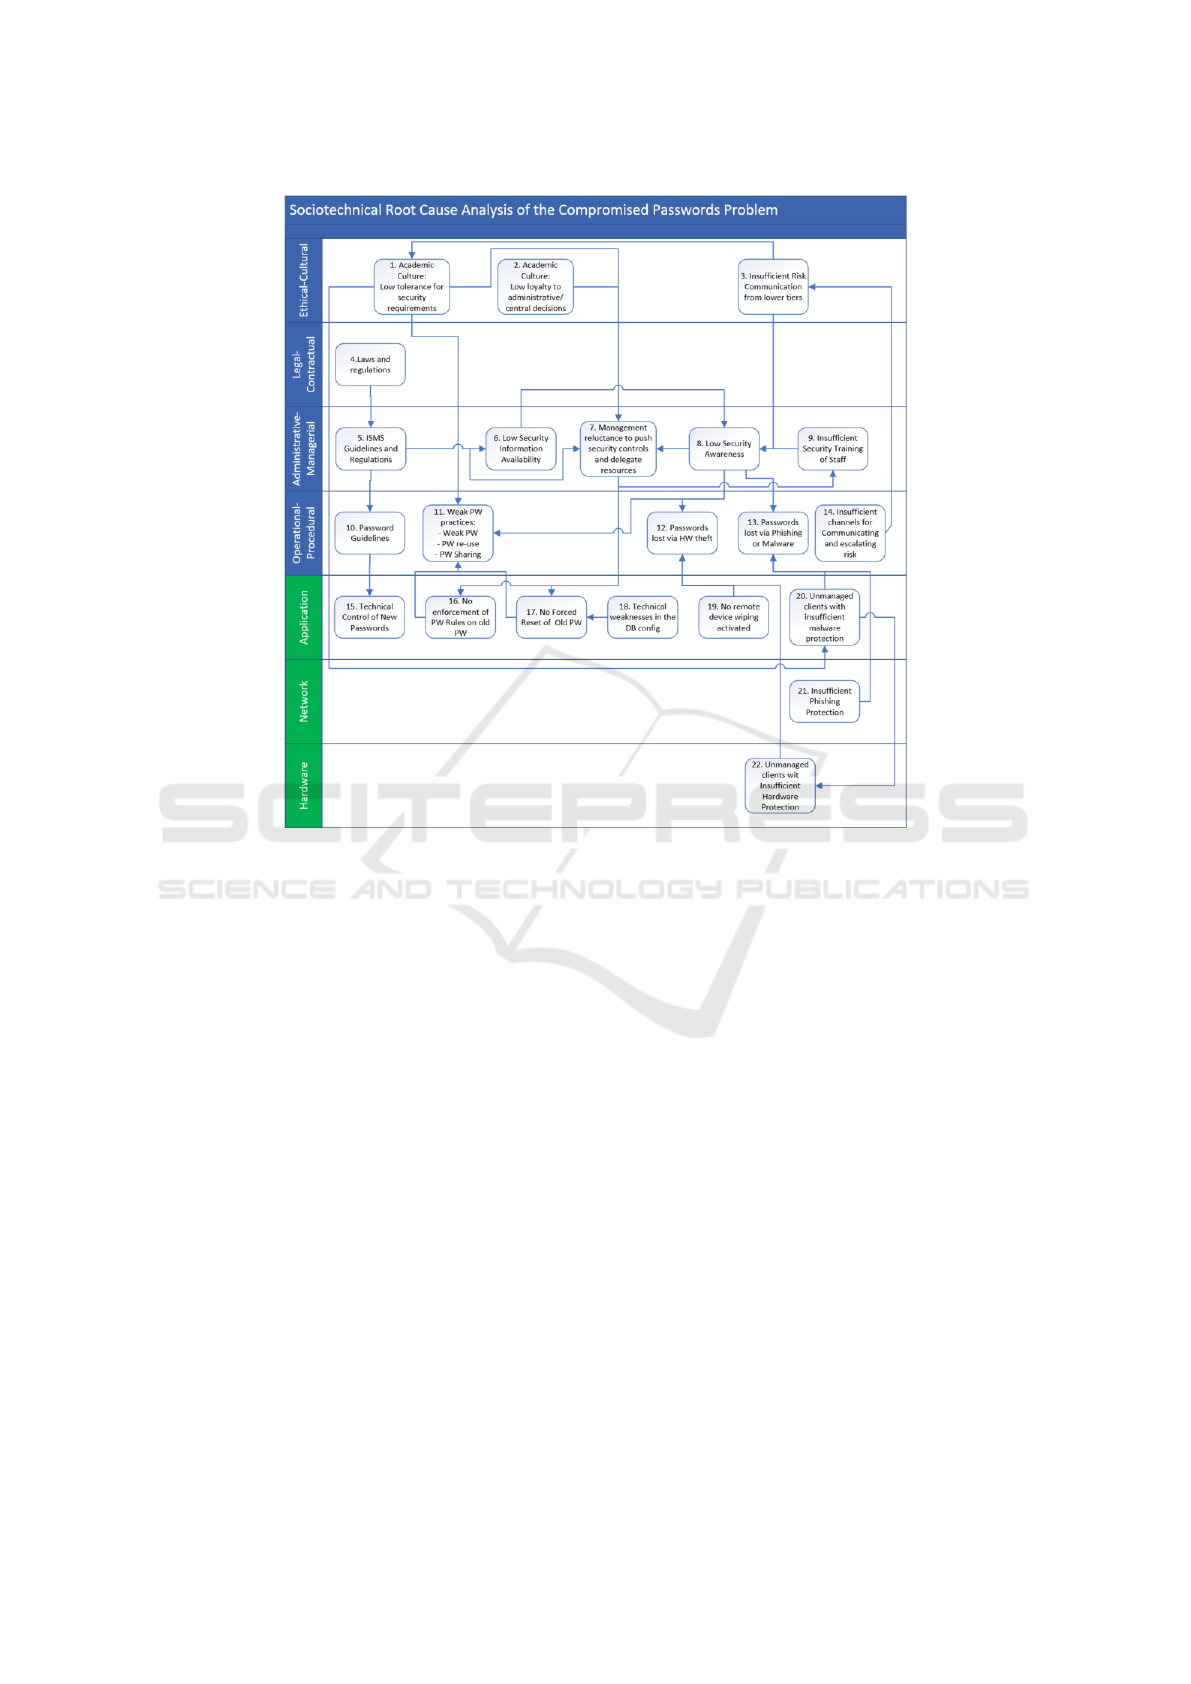
Figure 2: SBC AcciMap illustrating the STA of the compromised PWs problem. (Blue indicates social and green indicates
technical.)
(15.). However, the contributing social causes to the
weak PW practices (11.) are the low tolerance for se-
curity requirements (1.) and low security awareness
(8.), while the managements reluctance to push se-
curity controls (7.) and technical weaknesses in the
database (18.) influences the lack technical controls
(16. and 17.). Managed clients are protected but un-
managed clients, often preferred by the academics,
are not (20. and 22.) and these are more exposed
to risk.
6 DISCUSSION
This section presents a discussion of the RCA of com-
promised PWs for both the individual causes and the
social technical causes before proposing risk treat-
ments.
6.1 Root Causes of PW Compromise
The analysis came up with several possible RCs.
Starting with the demographic results, the analysis
found that 70.8% of the survey respondents had been
employed for ten years or longer. We did not have
access to the employment length distribution for the
whole University, so this finding is in itself inconclu-
sive. Furthermore, the age distribution of the sam-
ple compared to the University as a whole reveals an
over-representation of the 40-49 and 70 and above
categories, most notably the latter. The small sam-
ple size (72) allows for higher variation in the results
and may have played a role, but it seems unlikely that
so many in the 70 and above group would appear in
the sample by chance. Given that all of the 60 and
above respondents, together with over 50% of the 50-
59 group respondents have been employed for longer
than fifteen years, it is likely that employment length
is a risk factor. An example of this risk could be em-
ployees creating a PW according to best practices at
the time and opting not to change it afterward. PW
recommendations change over time and older PW are
likely to be weaker. The sample was 167 for the gen-
der analysis and found that the over-representation of
women was unlikely (P=1.5%) to have occurred by
chance. The demographics indicate the following risk
ICISSP 2020 - 6th International Conference on Information Systems Security and Privacy
548

factors for the population: I. Length of employment
combined with age, and II. Gender - where women
are slightly more exposed.
In the overall results, the respondents reported a
high level of security awareness in all three proposed
scenarios, which is surprising given that they were in
the incident database. Compared to the overall scores
in the survey as a whole in Table 7, it is likely that
several respondents reported a higher score on their
awareness compared to their actual behavior. The me-
dian for the Low awareness category in the scoring
scheme is 34.5/100, and the median for the three cat-
egories of self-reported awareness is 4/6, 4.5/6, and
4.5/6. This result documents a bias with self-reported
data when inquiring about behaviour as data subjects
may want to project themselves as better behaving
than actual behavior.
We expected that close to all respondents would
have received a phishing email during their employ-
ment (Wangen, 2019; Wangen et al., 2019). How-
ever, 24% reported that they either had never re-
ceived a phish or did not know. Eleven answered that
they had been fooled by phishing, however, only four
got assigned phishing as the RC by the scoring sys-
tem, compared to seven when we included the self-
reported RC. The remaining four also scored high in
phishing, but scored higher in other categories. For
these cases, it is possible that either or both causes
could be the RC.
The malware had primarily one indicator and that
was if the respondent had noticed any malware while
being employed at the University. 13 out of the twenty
who answered that they had experienced a malware
infection was assigned malware as the RC by the scor-
ing scheme, 12 when adjusting with the self-reported
RC. All of the remaining seven who answered Yes also
had high scores in the malware category, all withing
20 points of the highest score implying malware as a
possible or contributing cause.
Password reuse was by far the largest problem in
the sample with 54% reported to be reusing their uni-
versity password. 30 of the 39 who reported to be
reusing PW also was assigned this as a RC by the
scoring system. One was changed to phishing based
on the self reported RC. Six of these scored higher
on PW strength and three on malware. Additional ev-
idence for the PW re-use hypothesis is found in the
FBI and REN-ISAC analysis of the Chegg data breach
in 2019, which concluded that there was a significant
re-use of credentials in higher education.
4
Although the respondents reported a high level of
4
Presentation REN-ISAC and FBI Threat Briefing: Per-
vasive Threats by Kristen Lane & Kim Milford at the 2019
EDUCAUSE Annual Conference.
self-awareness, they reported a low level of knowl-
edge regarding all security guidelines and policies
(median=2 for all), Table 6. Lack of knowledge re-
garding security guidelines seems to be a main con-
tributor to the problem. This is likely an organiza-
tional issue as these documents have either not been
championed properly or are not available. The study
also documents several organizational issues, such as
the lack of security training as a contributing factor.
We also uncovered technical and policy weaknesses,
such that the employees do not see any form of repri-
mand for not adhering to the PW policies and missing
technical measures for ensuring policy enforcement.
Table 4.9 documents how the scoring system
placed the respondents compared to the self-reported
cause of compromise. These results matched in six of
the eleven cases. For the remaining five, the respon-
dents scored higher in other categories than the self-
reported cause: The respondent that reported hard-
ware theft as the cause was also exposed to malware
(82). We do not know the security mechanisms on
the stolen hardware, but malware seems just as likely
a cause for the PW compromise. Two of the re-
spondents that reported phishing as the cause and the
one that reported malware all scored higher on PW
strength (82.5, 92, 82) as the likely cause. The most
significant mismatch here is between the self-reported
malware cause and the respondent’s score in the mal-
ware category (18). The respondent wrote that out-
dated antivirus software was the problem, but answers
No to the Q14 if he has ever had a malware infection.
The respondent also had low scores in every category
except PW strength, which indicates inconsistency in
the self-reported cause and provided answers. The re-
maining three cases of mismatches have the follow-
ing gaps in points in the scoring system between as-
signed and reported cause: PW reuse - Phishing 15.5
points, PW strength - Phishing 18, and PW strength -
Phishing 24. The gaps between the predicted the RC
and the reported RC is low in the scoring system for
these three mismatches indicating multiple contribut-
ing causes. The scoring scheme showed a level of re-
liability for predicting RCs when validated against the
respondents that had known causes. The median and
variance also shows that the respondents performed
quite differently within the scoring scheme categories
and only three RCs were assigned with a less than 50
point score.
6.2 Socio-technical Analysis
By using the SBC analysis approach, we visualized
these connections within the organization to argue
for improvement where it is necessary. That is, not
The Root Causes of Compromised Accounts at the University
549

only based on the direct causes, but also connected
causes. In a socio-technical system, solving a sin-
gle problem could solve several problems at once.
Hence, we used SBC AcciMap to identify and address
the RCs of these incidents at different levels of the
socio-technical system. However, short-sighted and
poorly designed solutions that overlook strategic, tac-
tical, and operational problems related to cybersecu-
rity significantly weakens an organization against fu-
ture cyber incidents. The technical solutions to the
compromised PWs problem are largely known, but
not implemented. Applying the STA, we found mul-
tiple contributing causes on different layers in soci-
etal and technical hierarchy. Our proposed hypothe-
ses for RCs includes organizational and culture as-
pects as key aspects in understanding the problem.
The cultural aspects are likely to influence the man-
agements willingness to invest in solving the problem.
While missing the key channels for risk communica-
tion across tiers and being reluctant to make changes
that interfere in the workday of the employees was
also a strong contributor to the problem.
6.3 Limitations and Future Work
There are several limitations of this study: Firstly, the
survey was conducted after incidents had occurred, so
the surveyed population could have altered behaviour
since being compromised. This may have influenced
the results, however, the analysis uncovered signifi-
cant security weaknesses in all but three of the respon-
dents self-reported data, so it does not seem to have
been a major issue. The premise of the applied RCA
method is that one can extract RCs from subjects who
do not know the cause. We obtained a probable RC by
querying the respondents about best practices. How-
ever, these results can not be validated for the 62 re-
spondents who did not know. Risk reducing controls
can be implemented based on our findings and the re-
sults measured as evidence to support or reject the hy-
pothesis.
Although we had a 47% response rate, 72 respon-
dents is a small sample size. For example, a suc-
cessful phishing campaign may shift the percentage
of compromises drastically. However, the analysis
uncovered multiple weaknesses in personal security
routines and provides empirical data to support RCs.
By following the RCA method, we also limit the data
collection to the areas that were initially hypothesized
as key issue areas. Although this issue was mitigated
with a written answer regarding what the respondent
thought was the cause, the method has a inherent limi-
tation in undiscovered causes that were not discovered
or thought of.
The RCs hypothesized in this paper can be val-
idated through further investigation of the problem
or through strategies for RC removal and measuring
the effect. The identified RCs of individual compro-
mises have known best practices on how they should
be treated. For example, low awareness is treated
with increased awareness training and can be supple-
mented with a last logged in from.The phishing risk
comes down to awareness training and technical con-
trols, such as spam filtering. PW reuse and sharing
can be mitigated with the implementation of two fac-
tor authentication. Weak PWs can be improved by
stronger password requirements and technical con-
trols, this will require a reset of all old PWs to en-
sure compliance. However, with only one forced PW
change, the weak PWs problem will come back over
time as PW requirements increase. Although it is not
necessary to create a new PW once every semester,
it is necessary with a PW change over longer peri-
ods. Although this is disputed by the NIST best prac-
tice guidelines, PW change has clear benefits but with
long intervals corresponding with new best practices
for PW strength. The malware risk is primarily con-
trolled by strong endpoint security. In future work,
implementing these treatments in a staggered fashion
will allow for measuring the efficiency of each treat-
ment.
The results presented in this study have a limited
generalizability as the data was only collected as a
case study. The sample was only drawn from those
who had an incident and is therefore not representa-
tive of the institution as a whole. So more research
is required to generalize the results further and to in-
vestigate the security culture at the University. How-
ever, similar institutions may have benefit from our
findings. Some of the uncovered problems is likely
to be generic for academia, such as the growing con-
flict between academic freedom and the modern cy-
bersecurity requirements. It is also likely that the low
awareness regarding both PWs and security in general
is not limited to the case study institution. A path for
future work is to pursue further validation of the STA
RCs by implementing risk treatments and measuring
the effect.
Our future work within STA would be directed
to propose a comprehensive plan for managing priv-
ileged access to the resources and deterring this in-
cident in organization. Moreover, we will address
the challenges that face security awareness training in
the university and take the first steps to create a suc-
cessful and engaging security awareness program. In
order to achieve this particular aim, we use our ob-
tained results to conduct various exercises to help the
university prepare for different cyber threats, as pre-
ICISSP 2020 - 6th International Conference on Information Systems Security and Privacy
550

sented in (Østby et al., 2019). The results showed that
cybersecurity is everyone’s responsibility in the orga-
nization. Therefore, training the workforce by using
socio-technical RCA to create best scenarios for ex-
ercises is necessity to maintain the organization se-
cure. A weakness in the SBC RC approach is that it
is based on expert knowledge of the organization and
highly subjective. Another path for future work is to
research the model further across multiple universities
for validation and improvement.
7 CONCLUSION
In this study, we employed a socio-technical root
cause analysis to uncover causes of compromised ac-
count at the University. We carried out this analysis
in the direction of problem analysis and solving. The
results from the scoring scheme shows that on the
individual level, PW reuse across multiple services
is the largest contributor to the problem and makes
out 42% of the problem in the collected sample. PW
strength is the second largest contributor at 25%, Mal-
ware is at 19% and phishing attacks accounts for 10%.
Low awareness has been attributed to 3% of the in-
cidents, but is not mutually exclusive from top four
causes. Several respondents had high scores in multi-
ple categories indicating weak security practices over-
all. Applying the STA, we found multiple contribut-
ing causes on different layers in societal and techni-
cal hierarchy. Our proposed hypotheses for RCs in-
cludes organizational and culture aspects as key as-
pects in understanding the problem. This work has
also identified the emerging conflict between the re-
quirements from modern cybersecurity and the open
academic culture. As the pressure increases these is-
sues will need to be dealt with at both an organiza-
tional and national level. To summarize the findings,
we ended up with several RCs that can be explored
and validated in future work.
ACKNOWLEDGEMENTS
This research paper has been supported by the
NTNU project CREATE@IIK. We also thank Fredrik
Theien, Thomas Huse, Ole Martin Søgnen, Vasileios
Gkioulos, the NTNU Digital Security Section, the
study participants, and the anonymous reviewers for
their contributions.
REFERENCES
Abubakar, A., Zadeh, P. B., Janicke, H., and Howley, R.
(2016). Root cause analysis (rca) as a preliminary tool
into the investigation of identity theft. In Cyber Secu-
rity And Protection Of Digital Services (Cyber Secu-
rity), 2016 International Conference On, pages 1–5.
IEEE.
Andersen, B. and Fagerhaug, T. (2006). Root cause anal-
ysis: simplified tools and techniques. ASQ Quality
Press.
Chapman, J. (2019). How safe is your data? cyber-security
in higher education. HEPI Policy Note, April(12).
Collmann, J. and Cooper, T. (2007). Breaching the secu-
rity of the kaiser permanente internet patient portal:
the organizational foundations of information secu-
rity. Journal of the American Medical Informatics As-
sociation, 14(2):239–243.
Debrincat, J., Bil, C., and Clark, G. (2013). Assessing or-
ganisational factors in aircraft accidents using a hy-
brid reason and accimap model. Engineering Failure
Analysis, 27:52–60.
Grassi, P., Garcia, M., and Fenton, J. (2017). Nist special
publication 800-63-3–digital identity guidelines.
Hellesen, N., Torres, H., and Wangen, G. (2018). Empiri-
cal case studies of the root-cause analysis method in
information security. International Journal On Ad-
vances in Security, 11(1&2).
Huse, T. H., Nyblom, P. B., Søgnen, O. M., and
Theien, F. L. (2018). En case-studie p
˚
a bruk av
rot
˚
arsaksanalyse innen informasjonssikkerhet. B.S.
thesis, NTNU in Gjøvik.
Huynen, J.-L. and Lenzini, G. (2017). From situation
awareness to action: An information security manage-
ment toolkit for socio-technical security retrospective
and prospective analysis. In Proceedings of the 3rd
International Conference on Information Systems Se-
curity and Privacy, pages 213 – 224.
Julisch, K. (2003). Clustering intrusion detection alarms
to support root cause analysis. ACM transactions on
information and system security (TISSEC), 6(4):443–
471.
Kowalski, S. (1994). IT Insecurity: A Mult-disciplinary In-
quiry. PhD thesis, Stockholm University.
Østby, G., Berg, L., Kianpour, M., Katt, B., and Kowalski,
S. (2019). A socio-technical framework to improve
cyber security training: A work in progress. In 5th In-
ternational Workshop on Socio-Technical Perspective
in IS development (STPIS’19). CEUR-WS.
Thomas, K., Li, F., Zand, A., Barrett, J., Ranieri, J., In-
vernizzi, L., Markov, Y., Comanescu, O., Eranti, V.,
Moscicki, A., et al. (2017). Data breaches, phishing,
or malware?: Understanding the risks of stolen cre-
dentials. In Proceedings of the 2017 ACM SIGSAC
Conference on Computer and Communications Secu-
rity, pages 1421–1434. ACM.
Wangen, G. (2019). Quantifying and analyzing information
security risk from incident data. In The Sixth Inter-
national Workshop on Graphical Models for Security.
Springer.
Wangen, G., Brodin, E. Ø., Skari, B. H., and Berglind, C.
(2019). Unrecorded security incidents at NTNU 2018
(Mørketallsundersøkelsen ved NTNU 2018). NTNU
Open Gjøvik.
The Root Causes of Compromised Accounts at the University
551
