
Time-frequency Features for sEMG Signals Classification
Somar Karheily, Ali Moukadem, Jean-Baptiste Courbot and Djaffar Ould Abdeslam
Institute IRIMAS, University of Haute-Alsace, Mulhouse, France
Keywords: Time-frequency Analysis, Features Extraction, Prosthetic Arm, sEMG, Hand Gesture.
Abstract: This paper proposes a new approach for the identification of hand movements in order to control prosthetic
hand. sEMG signals were used to identify movements by using two time frequency transforms: Short Time
Fourier Transform and Stockwell transform. Then, we apply Singular Value Decomposition (SVD) to
decrease the features dimension and to form the final features’ vector. These extracted features were used by
two kinds of classifiers: K nearest neighbours and linear discriminant analysis. Finally, we numerically study
these methods on a database of 10 subjects and 17 hand gestures.
1 INTRODUCTION
Prosthetic hand is an important help for people who
lost their upper limb in order to restore their
biological hand functionality.
Recognizing multiple hand movements
depending on sEMG signals coming from
electromyography sensors is a challenging task
especially with adding more movements to study
which makes classification rate worse significantly.
Surface electromyography signal (sEMG) is a
bio-electrical signal generated along with skeletal
muscles activities, and it differs according to
movement controlled by these muscles, and that
makes this signal very useful in many applications as
human-machine interaction, rehabilitation of
handicapped people, and controlling limb prosthetic
(Raez et al., 2006).
The sEMG signal has been widely studied in the
literature. However, it is still difficult to apply it to
control prosthetic arm. That comes from the
complexity in human hand movements which has
more than 20 degrees of freedom and from the non-
stationary nature of the signal. The sEMG amplitude
ranges from 50 μV to 10 mV and frequency spec-trum
lies between 20 Hz and 500 Hz (Meselmani et al.,
2016).
Recording sEMG is performed by placing several
electrodes on the skin, and different studies were done
to obtain better results in this area. Over the past
decades, different electrode placement strategies have
been investigated. Some researchers study the use of
multichannel electrode arrays or high-density EMG
(large number of electrodes) strategy, while others
explore the precise anatomical positioning approach
(Hermens et al., 1997).
In pattern recognition based control, the most
important steps are feature extraction and
classification. Feature extraction involves
transforming raw sEMG data into feature vector that
is used to represent specific movement. Several
features extractions methods were studied in this area
which can be divided into three major domains: time
domain features, frequency features, and time-
frequency features. Some of time domain features
include mean absolute value (Zecca et al., 2002), zero
crossings (ZC), slope sign changes (SSC) (Englehart
et al., 2003). These methods are effective but they are
unable to detect the high frequency variations which
occur in EMG signals due to dynamic movements,
and that limits their ability for improvements of
movements’ recognition. Thus time-frequency
domain methods came into picture.
Time-frequency domain features contains the
combination of temporal and frequency information
(Sejdi et al., 2009; Chowdhury et al., 2013; Nazmi et
al., 2016). These features characterize the signal in
time-frequency plane which allows an accurate
description of the variability of frequency over time,
providing plentiful non-stationary information of the
EMG signals.
Short Time Fourier Transform (STFT) is a well-
known time-frequency method which performs a
mono-resolution analysis by applying a fixed size
window on the signal. This can be considered as
limitation in term of time-frequency resolution in
244
Karheily, S., Moukadem, A., Courbot, J. and Abdeslam, D.
Time-frequency Features for sEMG Signals Classification.
DOI: 10.5220/0008971902440249
In Proceedings of the 13th International Joint Conference on Biomedical Engineering Systems and Technologies (BIOSTEC 2020) - Volume 4: BIOSIGNALS, pages 244-249
ISBN: 978-989-758-398-8; ISSN: 2184-4305
Copyright
c
2022 by SCITEPRESS – Science and Technology Publications, Lda. All rights reserved

some cases of non-stationary signals. The Continuous
Wavelet transform is another time-frequency method
which perform a multi-resolution analysis by varying
the scale of the mother wavelet according the
analyzed frequency (Sun et al., 2015). The Discrete
Wavelet Transform (DWT) performs a series of bank
filter in order to explore the time-frequency content
of the signal. CWT and DWT has been successfully
applied on EMG signals (Sejdi et al., 2009; Canal et
al., 2010). In this study, we apply the Stockwell
Transform (ST) which can be considered as hybrid
version between the STFT and the CWT (Stockwell
et al., 1996).
Classification of hand motions based on the
extracted features can be performed by a large variety
of methods such as linear discriminant analysis (Negi
et al., 2016), support vector machines (Leon et al.,
2011), or artificial neural networks (Gonzalez-Ibarra
et al., 2012).
In this paper, we aim to use sEMG to identify
hand movements patterns based on time-frequency
features. We will use recorded sEMG signals from
Ninapro Project (Atzori et al., 2014), and apply two
time-frequency transforms on several data sets that
belong to different subjects. Then we will decrease
dimension of extracted features by applying singular
value decomposition (SVD) method. Our features’
vector contains singular values and the most
prominent time and frequency features, based on
SVD (Hassanpour et al., 2004). Finally we will
classify extracted features using two kinds of
classifiers, and compare results achieved from each
one.
2 MATERIALS AND METHODS
Data used in this study is recorded by surface
electrodes placed on the arm of the subject, and each
movement repeated several times, data is saved in
matrix of dimension NxM, where N is the number of
samples, and M is number of channels (electrodes)
In this section, we will give a brief description
about used time-frequency methods, then we will
present the used SVD methodology to decrease
features’ dimension.
2.1 Features Extraction
We applied two time-frequency transforms: the STFT
and the ST. For each movement we apply this time-
frequency transform on every channel (electrode)
signal, then after decreasing feature dimension, we
combine all values in one features’ vector, and this
vector will be used for classification.
2.1.1 STFT
Short-Time Fourier transform overcomes
disadvantages of time domain by considering
frequency variations over the time which is necessary
for sEMG as it is stochastic and non-stationary signal.
The STFT is applied in this paper in order to explore
the frequency variation of the sEMG signal over the
time. It applies a sliding window to the analyzed
signal in which we consider the signal inside this
window as stationary. Therefore, the Fourier
transform can be applied in order to obtain the local
spectrum:
STFT(τ,f)= ℎ(𝑡)𝑔(𝑡−𝜏)𝑒
πft
𝑑𝑡
(1)
Where h is the original signal, t is time, τ and f
presents time of local spectrum and Fourier
frequency, respectively, and g(t) is the used window
function.
For comparison purposes, we chose a Gaussian
window for STFT transform, in order to compare with
ST. In addition the Gaussian window minimize the
Heisenberg-Gabor relation which describes the
compromise between the time and frequency
resolution. Using the standard deviation σ, g(t) can be
given as:
𝑔(𝑡)=
1
𝜎
√
2𝜋
𝑒
(2)
2.1.2 ST
The Stockwell transform is a hybrid version between
the STFT and the Continuous Wavelet Transform
(CWT). It uses a multi-resolution Gaussian window
by varying its standard deviation over the analysed
frequencies (Moukadem et al., 2015).
The ST can be derived from formula (1) by re-
placing σ in equation (2) by 1/f. Then the window
function can be expressed as follow:
𝑔(𝑡)=
𝑓
√
2𝜋
𝑒
(3)
Then the ST is defined as:
Time-frequency Features for sEMG Signals Classification
245

𝑆(τ,f)= ℎ(𝑡)
𝑓
√
2𝜋
𝑒
()
𝑒
πft
dt
(4)
For each movement repetition, we get window of
movement as matrix of size NxM where N is the
number of samples, and M is number of electrodes.
That gives M signals for each movement.
To summarize, for an electrode k, we have one
signal [C
k
], on which we apply time-frequency
transform T(C
k
), and this will be our initial features’
matrix related to specific movement on specific
channel.
2.1.3 SVD
The initial features’ matrix we get from time-
frequency domain is high dimension, and to be useful
in movement identification, we still need to re- duce
its dimension and extract the most valuable
components in it (Wolczowski et al., 2017).
As we saw in initial features extraction, we get
T(C
k
) as initial time-frequency features on certain
channel, and here we at first calculate SVD for this
matrix:
𝑈
𝛴
𝑉
*
= 𝑆𝑉𝐷(𝑇(𝐶
))
(5)
In order to keep the most important values of V
k
and U
k
, we compute their histogram over X bins
denoted by Ṽ
k
, Ũ
k
and keep the two most important
values.
Then for each channel, the feature vector is F
k
will
be defined as:
𝐹
= {𝑠
,𝑠
,ṽ
,ṽ
,ũ
,ũ
}
(6)
Where s
1
k
, s
2
k
are first two singular values, and
ṽ
1
k
, ṽ
2
k
are first two bins in Ṽ
k
, also ũ
1
k
, ũ
2
k
are first
two bins in Ũ
k
. Finally the final feature vector of the
observation will be:
𝐹={𝐹
,𝐹
,...𝐹
}
(7)
2.2 Classification
We use our built features’ vector for identifying
movements, this vector has 6xM values in different
scales, so at first we normalize this vector so all
values will be on scale [-1, +1]. In this study we use
two kinds of classifiers to evaluate our extracted
features; first one is K Nearest Neighbor (KNN) and
second is Linear Discriminant Analysis (LDA).
2.3 Main Algorithm
The main algorithm is shown in figure 1, starting
from raw sEMG data,
Data normalization: we first normalize the data so
we get standard deviation 1, and mean values 0.
The normalized data matrix D will be used in
features extraction.
Time-frequency features extraction: we extract
initial features on each channel. T
k
=T(C
k
) where
T is the time-frequency transform we use, and C
k
is signal coming from channel k.
Build feature vector: we calculate final partial
feature vector F
k
=SVD(T
k
) on each channel based
on singular values and histogram of left and right
SVs, and then we get the final constructed feature
vector of the movement F=[F
1
F
2
… F
m
],
compound of features’ vectors of movement on
each channel.
Classification: use collected observations, to feed
chosen classifiers and evaluated extracted
features. We apply this process on two different
time-frequency domains (STFT, ST) and two
classifiers (KNN, LDA).
3 RESULTS
3.1 Data Acquisition
In order to compare STFT with ST and KNN with
LDA in the purpose of classifying hand gestures, we
used database provided by Ninapro Project (Atzori et
al., 2014). We chose exercise 1 from database 2 as
it contains 17 different basic movements of fingers
Figure 1: Main algorithm.
BIOSIGNALS 2020 - 13th International Conference on Bio-inspired Systems and Signal Processing
246
and wrist. The sEMG signals are provided together
with their hand gestures.
Each movement in exercise is repeated 6 times,
where each subject was asked to repeat movement
and hold position for 5 second, followed by 3 second
of rest. The muscular activity is recorded by 12
electrodes placed on subject’s arm, so the recorded
sEMG data were saved into matrix D of size Nx12
were N is recorded samples on channel. The sEMG
signals are sampled at a rate of 2 kHz.
3.2 Features and Classification
Using the data described above, we will apply both
STFT and ST on the raw data, and then we will build
feature vector based on singular values and histogram
of left and right SVs.
In order to test the accuracy of our proposed
method, we applied it on 10 subjects. The raw sEMG
contains recorded samples on each channel for each
movement.
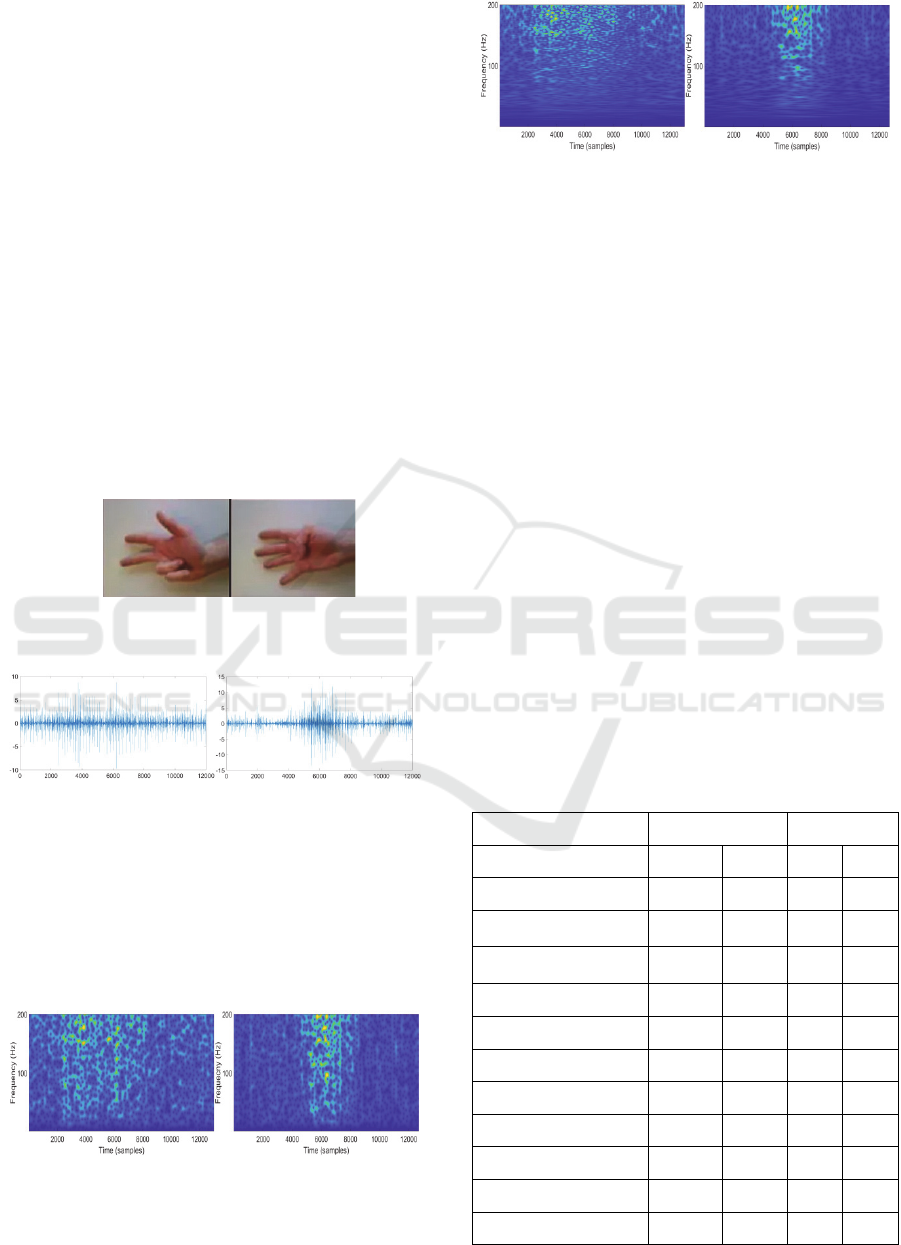
Figure 2: physical movement. On the left is movement 3.
On the right is Movement 4 (Atzori et al., 2014).
Figure 3: raw sEMG signal. On the left is movement 3 on
channel 1. On the right is movement 4 on channel 1.
For each channel signal, we calculate time-
frequency transform. We use sampling frequency 2
kHz, and with frequency rate between 1 and 200 Hz,
as most sufficient sEMG frequencies varies in this
range. For the STFT we choose value σ = 0. 005
(equation (2)).
Figure 4: STFT. On the left is movement 3 on channel 1.
On the right is movement 4 on channel 1.
Figure 5: ST. On the left is ST for movement 3 on channel
1. On the right is ST for movement 4 on channel 1.
The chosen value σ = 0. 005 promoted time
resolution, while in the case of ST, it gives lower
time- resolution for low frequencies (as you can see
in figure 4 and 5) since the standard deviation of the
Gaussian window in the time-domain varies as 1/f.
We construct final features’ vector from SVD
singular values and histogram of left and right values,
then we combine results from all channels into one
vector.
As a result from previous steps, we get features’
vector of dimension 72 for each observation (as we
have 12 channels, and for each we get 6 feature
values). We use these observations’ features to train
both KNN and LDA classifiers.
Results are given in table 1. We use k-fold cross-
validation (with k=5) and record the mean accuracy
of classifications.
By using STFT as time-frequency transform we
get mean accuracy rate 92.60% with KNN classifier,
and we get 88.57% accuracy with LDA classifier.
For S-Transform, we get mean accuracy 81.80%
by using KNN classifier and 84.93% by using LDA.
Table 1: Classification results, with best result for each
subject in bold.
Subject STFT ST
Classification KNN LDA KNN LDA
Right Handed Male 93.14 87.25 77.45 75.49
Left Handed Female 90.19 88.24 78.63 83.53
Right Handed Male 96.08 91.18 87.25 90.20
Right Handed Male 91.18 92.16 85.29 85.29
Right Handed Male 92.16 88.24 78.43 87.25
Right Handed Male 90.39 82.35 76.47 88.23
Right Handed Male 96.08 94.12 78.43 82.35
Right Handed Male 94.20 88.24 88.47 86.39
Right Handed Male 92.44 85.25 80.67 84.40
Right Handed Female 90.20 88.64 86.82 86.59
Average 92.60 88.57 81.80 84.93
Time-frequency Features for sEMG Signals Classification
247
For KNN classifier, we tried different values of K,
where K in {1,3,5}, and we got best mean accuracy
when K=1 with classification accuracy 92.60% then
when K=3 with accuracy 88.16% when applied with
STFT method.
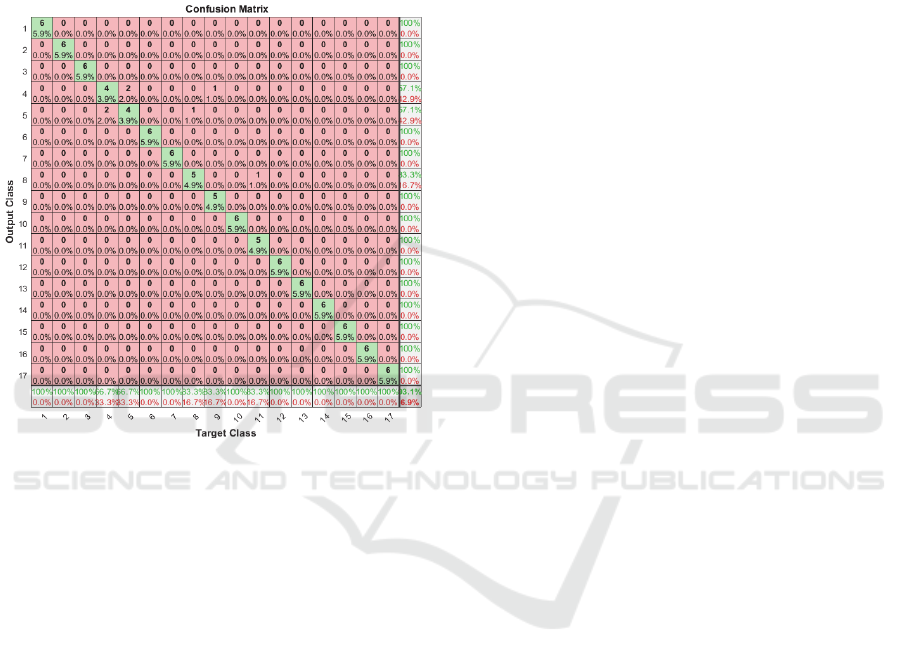
By looking on confusion matrix for classification
of subject 3 dataset, we notice that classification fails
to distinguish between two movements (4 and 5) and
that increases error rate, as shown in figure 6.
Figure 6: Confusion matrix, subject 3.
In movement number 4 subject opens four fingers
and in movement number 5 he opens five fingers, so
these two movements are near to each other’s, and in
fact it could be hard to classify unless we focus on
getting more distinguished signals while doing data
acquisitions.
As result, with STFT time-frequency transform,
we get better classification, and with adding
histogram of SVD, classification results were
significantly improved compared to similar study on
this database (Anti et al., 2014) with classification
rate 82.77% for 12 different movements.
4 CONCLUSION
In this study, we used two different time-frequency
transforms to extract features of different movements
of hand. The extracted features are evaluated by using
two classifiers.
For features extraction, we used novel method in
dimension reduction and put both left and right SVs
into consideration, by using first two bins in their
histograms.
Results show that using STFT with KNN has
better results with improved classification accuracy
92.60%. We improved classification accuracy
obtained on same database, and we showed
comparison between using two time-frequency
transforms for features extraction.
Future work will focus on adding more subjects to
evaluate the proposed method. Another optimized
time-frequency representation can be also applied and
compared with current results.
REFERENCES
N. Meselmani, M. Khrayzat, K. Chahine, "pattern
recognition of EMG signals: towards adaptive control
of Robotic Arm", IEEE International Multidisciplinary
Conf. on Eng. Tech. 2016.
Atzori, M. Ninapro Repository (2014)
http://ninapro.hevs.ch
H. Hassanpour, M. Mesbah, B. Boashash, “Time-frequency
feature extraction of newborn EEG seizure using SVD-
based techniques”. EURASIPJ. Adv. Signal Process.
2004, 898124 (2004).
Zecca, M., Micera, S., Carrozza, M.C., Dario, P., “Control
of multifunctional prosthetic Hand by processing the
electromyographic signal”. Critical Reviews in
Biomedical Engineering 30(4-6), 459–485 (2002).
K. Englehart and B. Hudgins, “A robust, real-time control
scheme for multifunction myoelectric control,” IEEE
transactions on biomedical engineering, vol. 50, no. 7,
pp. 848–854, 2003.
E. Sejdi, I. Djurovi, and J. Jiang, “Time–frequency feature
representation using energy concentration: An
overview of recent advances,” Digital Signal
Processing, vol. 19, no. 1, pp. 153–183, 2009.
Chowdhury RH, Reaz MB, Ali MA, Bakar AA, Chellappan
K, Chang TG. , "Surface electromyography signal
processing and classification techniques,” Sensors
(Switzerland), Vol 13(9), pp. 12431–12466, 2013.
Nazmi, N. et al. “A Review of Classification Techniques of
EMG Signals during Isotonic and Isometric
Contractions.” Sensors (Basel) 16 (2016).
Sun, K.; Jin, T.; Yang, D. “An Improved Time-Frequency
Analysis Method in Interference Detection for GNSS
Receivers”. Sensors 2015, 15, 9404–9426.
Canal, M.R. Comparison of Wavelet and Short Time
Fourier Transform Methods in the Analysis of EMG
Signals. J. Med. Syst. 2010, 34, 91–94.
R. G. Stockwell, L. Mansinha, and R. P. Lowe,
“Localization of the complex spectrum: The S-
transform,” IEEE Transactions on Signal Processing,
vol. 44, no. 4, pp. 998—1001, Apr. 1996.
S. Negi, Y. Kumar, and V. M. Mishra, “Feature extraction
and classification for EMG signals using linear
discriminant analysis” in Advances in Computing,
BIOSIGNALS 2020 - 13th International Conference on Bio-inspired Systems and Signal Processing
248

Communication, & Automation (ICACCA)(Fall),
International Conference on, 2016, pp. 1–6.
Leon M, Gutierrez JM, Leija L, et al. “EMG pattern
recognition using support vector machines classifier
for myoelectric control purposes.” In: Proceedings of
the 2011 Pan American health care exchanges
(PAHCE) ,28 March–1 April 2011, pp. 175–178.
Buenos Aires, Argentina: PAHCE.
Gonzalez-Ibarra JC, Soubervielle-Montalvo C, VitalOchoa
O, et al. “EMG pattern recognition system based on
neural networks.” In: Proceedings of the 2012 11th
Mexican international conference on artificial
intelligence, San Luis Potosi, Mexico, 27 October–4
November 2012, pp. 71–74. New York: IEEE.
M. Anti, G. Marra, F. Armelao, A. Percesepe, and N.
Gentiloni, “Electromyography data for non-invasive
naturally controlled robotic hand prostheses,” Nature,
vol. 1, pp. 605–10, 2014.
Moukadem, Ali, Bouguila, Zied, Abdeslam, Djaffar Ould
et al. “A new optimized Stockwell transform applied on
synthetic and real non-stationary signals”, Digital
Signal Processing, 2015, vol. 46, p. 226-238.
Raez MB, Hussain MS, and Mohd-Yasin F, 2006
Techniques of EMG signal analysis: detection,
processing, classification, and application. Biol Proced
Online. 8:11-35.
Hermens HJ, Freriks B (Eds), “The State of the Art on
Sensors and Sensor Placement Procedures for Surface
ElectroMyoGraphy: A proposal for sensor placement
procedures” Roessingh Research and Development,
Enschede, the Netherlands; 1997.
A. Wolczowski, R. Zdunek, “Electromyography and
mechanomyography signal recognition: Experimental
analysis using multi-way array decomposition methods,
Biocybernetics and Biomedical Engineering", 37(1),
103 - 113, 2017.
Time-frequency Features for sEMG Signals Classification
249
