
A Markerless Joint Detection through a Hand Geometric Representation
Aline de Faria Lemos
a
and Nagy Bal
´
azs Vince
b
Department of Mechatronics, Optics and Mechanical Engineering Informatics,
Budapest University of Technology and Economics, M
˝
uegyetem rakpart 3. Bldg D, Budapest, Hungary
Keywords:
Joint Position Estimation, Human Hand, Particle Swarm Optimization, Genetic Algorithm, Image Processing,
Optimization.
Abstract:
In several fields, such as man-machine interface and occupational therapy, the human hand-joint position is
required. Traditional methods usually rely on image processing allied with marker placement, e.g. reflexive
marker, which can be time-consuming and uncomfortable for the subject. For these reasons, scientific efforts
are being made to create reliable and convenient joint tracking. This paper proposes a methodology that
generates geometric figures to mimic the hand configuration. This process is made possible by an optimization
algorithm, which finds the most suitable placement of these geometric shapes. One time the real hand and the
created representation share similar features, the joints position can be estimated. Two optimization algorithms
were employed: particle swarm optimization and genetic algorithm. In both cases, satisfactory results were
obtained. Although, particle swarm optimization marginally outperformed the latter method.
1 INTRODUCTION
The human hand and its ability to manipulate objects
with dexterity are hallmarks of human evolution. It
is through the hand that much of the mechanical hu-
man iterations with the world take place. The hand
performs mechanical tasks ranging from the use of
high force to functions that require delicacy and pre-
cision (Leon et al., 2013; Barroso, 2010). The ver-
satility of the hand is possible due to the complexity
of its structure and its refined control, which enable
the execution of multi-digital prehension and pinch
movements (Hagert et al., 2012; Souza et al., 2015).
The study of the human hand and the characteriza-
tion of pinch function have an important role in mul-
tiple fields (Gruji
´
c and Bonkovi
´
c, 2015), such as the
study of pathologies (Kingsbury et al., 2014; Bar-
roso et al., 2011; Coimbra, 2011), rehabilitation of
upper limbs (Musiolik, 2008; Barroso et al., 2011;
Neves, 2011), development of man-machine interface
(Matsubara and Morimoto, 2013; Adams et al., 2015;
Endo and Kawasaki, 2015), design of robotic arms
and biomechanical models (Leon et al., 2013; Saikia,
2014; Quigley et al., 2014; Deimel and Brock, 2016).
The analysis of hand articular movement can be
performed by different equipment or procedures. Tra-
a
https://orcid.org/0000-0001-9898-6370
b
https://orcid.org/0000-0002-8489-7200
ditional methods usually rely on manual measure-
ments, e.g. manual goniometry, or marker-based tech-
niques, e.g. stereophotogrammetry (Barroso et al.,
2007). Although the manual goniometer is the most
frequently used technique, its inter-rater reliability is
criticized (Crasto et al., 2015). On the other hand,
marker-based techniques can be time-consuming and
uncomfortable for the subject. Nowadays, the litera-
ture contains promising markless solutions for hand
tracking and pose estimation (Zhou et al., 2016; Su-
pancic et al., 2015; Sridhar et al., 2015; Mueller et al.,
2017; Mueller et al., 2018). However, no benchmark
was established. For this reason, hand joint estima-
tion is still an open research challenge. This work
presents a methodology to generate a geometric hu-
man hand model. The underlying concept of genera-
tion process leverages image processing allied to op-
timization methods. From this model, joint positions
are estimated, which composes in the main goal of the
paper: a markerless hand joint detection method.
2 METHODOLOGY
The present study consists of a human hand joints de-
tection algorithm, which is composed of digital im-
age processing allied to optimization techniques. The
method is based on reconstructing the pose present
626
Lemos, A. and Vince, N.
A Markerless Joint Detection through a Hand Geometric Representation.
DOI: 10.5220/0008971706260633
In Proceedings of the 12th International Conference on Agents and Artificial Intelligence (ICAART 2020) - Volume 2, pages 626-633
ISBN: 978-989-758-395-7; ISSN: 2184-433X
Copyright
c
2022 by SCITEPRESS – Science and Technology Publications, Lda. All rights reserved
in certain hand image by placing polygons over the
hand dorsal surface and hand segments, creating a
low-resolution representation of the hand based on
geometric shapes where all the geometric properties
are known. For instance, hand segments can be ap-
proximated by rectangles, information about the ac-
tual shape of the segment is lost. However, informa-
tion about the position and dimension is preserved.
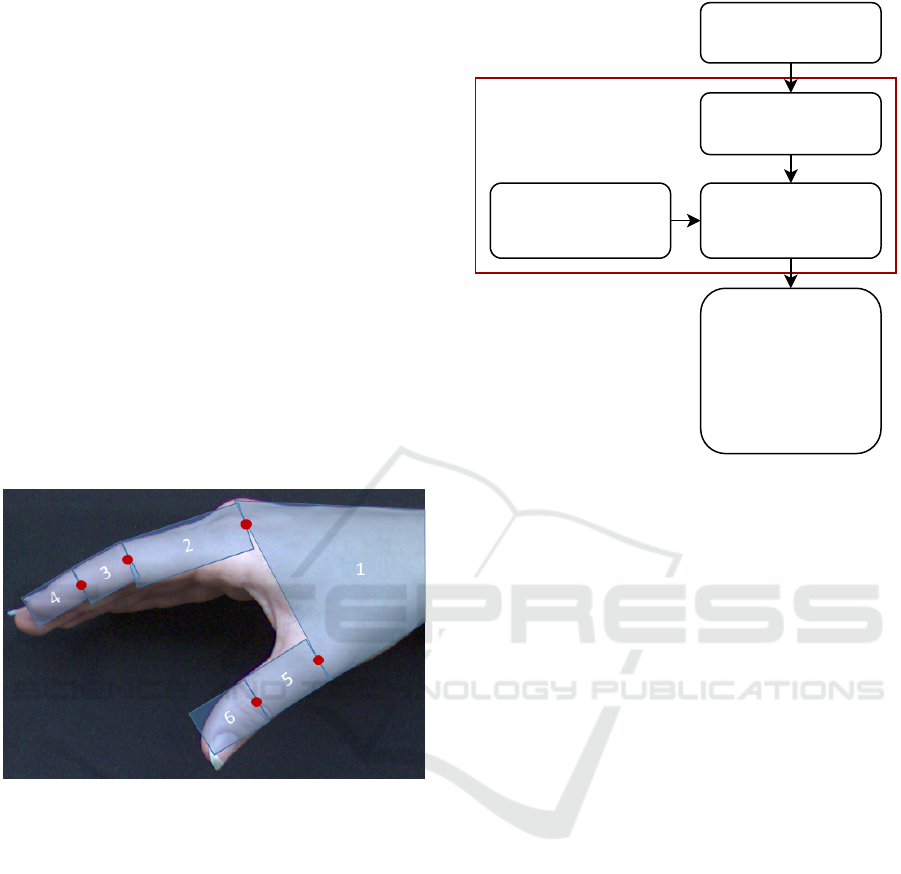
Conceptually, it is easy to grasp the feasibility of
the task in hand. The human mind can trivially draw
a geometric representation of the hand which cap-
tures relevant information about joints’ position, Fig.1
shows such representation. The procedure to auto-
matically create this representation can be interpreted
as a search algorithm, where the parameter space is
composed of shape’s definitions. Particle Swarm Op-
timization (PSO) and Genetic Algorithm (GA) were
proposed to find the most suitable configuration ac-
cording to the divergence from the hand and the ge-
ometric representation. The remainder of the section
explains in detail each step of the procedure.
Figure 1: Illustration of a possible arrangement of the drawn
polygons, in contrast to a hand picture.
2.1 Cost Function
The cost function is summarized in the Fig. 2. It re-
ceives a series of geometric figures parameters as in-
put and is composed of two modules, ”Draw poly-
gons” and ”Pattern recognition”. The first creates an
illustration of the human hand by using geometric fig-
ures, which are drawn by using the parameters con-
tained in the particle values. The second uses a pat-
tern recognition technique, based on XOR logical op-
eration, to compare the polygons image to a picture
of the human hand. The function outputs the area per-
centage of the resulting image in relation to the hand
picture. The mentioned modules are detailed in the
following subsections.
Input(polygons
parameters)
Drawabinaryimage
containingthepolygons
Binaryimageofthe
humanhand
Patternrecognition
(pixeltopixelXOR
betweenbothfigures)
Output(percentageof
blackpixelsfromthe
previousstepresulting
imageinrelationto
blackpixelspresentin
thebinarypictureofthe
humanhand)
CostFunction
Figure 2: Cost function block diagram.
2.1.1 Draw Polygons Module
”Draw polygon” is the module responsible for cre-
ating a new binary image containing six geometric
figures: one trapezium and five rectangles. These
polygons are meant to compose an illustration that
imitates the posture of a human hand in a superior
view. Fig. 1 illustrates a possible arrangement of the
geometric figures in contrast to a hand picture. The
polygons are mandatorily connected to each other by
their extremities. The advantage of this constraint is
twofold, it ensures physiology soundness (since it is
known the linkage between segments), and reduces
the complexity of the task (since it lowers the number
of parameters to be defined). These connections are
also the estimated joint positions and are illustrated by
the red dots present in Fig. 1. For the purpose of fa-
cilitating joint referencing, they were enumerated in
the following sequence: index finger metacarpopha-
langeal, proximal and distal interphalangeal joints
and thumb metacarpophalangeal and interphalangeal
joints, as illustrated in Fig. 3a
The polygons are drawn considering that the hand
is executing a cylindrical pinch movement. In this
case, the first polygon to be drawn is a trapezium,
which represents the dorsal surface of the hand. Rect-
angles 2, 3 and 4 correspond to proximal, medial and
distal phalanges of the index finger. Similarly, rectan-
gles 5 and 6 stand for proximal and distal phalanges
of the thumb.
The geometric figures are created from their ver-
tex points, which are calculated from the parameters
A Markerless Joint Detection through a Hand Geometric Representation
627
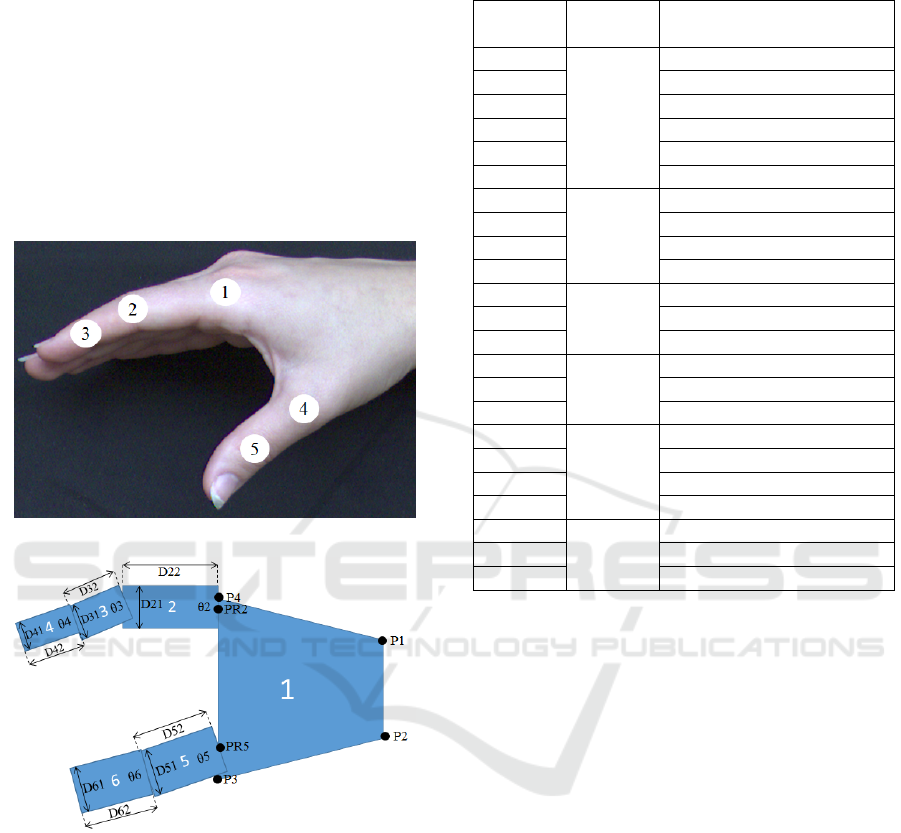
shown in Fig. 3b. They are the input of the cost func-
tion and, consequently, the particle value, which in-
cludes 23 variables. In this figure, D indicates a di-
mension, θ are the rectangles angular positions and
P is a Cartesian point. The particle includes only
the y coordinate of the points PR2, PR5, P1 and P2
and both y and x coordinates of the points P3 and P4.
The first number of this nomenclature correlates to the
polygon index. On the other hand, the second number
classifies the variable into height (1) or width (2). Ta-
ble 1 contains all cost function input variables, along
with their description.
(a)
(b)
Figure 3: Illustrations containing the adopted nomencla-
ture. a) Joint enumeration for the purpose of facilitating
joint referencing. b) Cost function input data used to create
the polygons.
2.1.2 Pattern Recognition Module
The polygons image, generated on the ”draw poly-
gons” module, is compared to a human hand picture
to achieve the polygons’ best positions and dimen-
sions. To proceed with this comparison is crucial to
segment the hand picture by extracting the hand re-
gion from the image background. Thresholding was
the elected segmentation approach for this purpose.
In this method, the hand image, acquired in RGB, is
Table 1: Description of the cost function input data used to
create the polygons.
Variable
Related
Polygon
Description
P1
y
1
y coordinate of vertex 1
P2
y
y coordinate of vertex 2
P3
x
x coordinate of vertex 3
P3
y
y coordinate of vertex 3
P4
x
x coordinate of vertex 4
P4
y
y coordinate of vertex 4
D21
2
Polygon height
D22 Polygon width
PR2
y
y coordinate of PR2 point
θ
2
Polygon angular position
D31
3
Polygon height
D32 Polygon width
θ
3
Polygon angular position
D41
4
Polygon height
D42 Polygon width
θ
4
Polygon angular position
D51
5
Polygon height
D52 Polygon width
PR5
y
y coordinate of PR5 point
θ
5
Polygon angular position
D61
6
Polygon height
D62 Polygon width
θ
6
Polygon inclination angle
converted to grayscale. Then, the foreground is ex-
tracted from the image by applying thresholding to
the grayscale image, which results in a binary image
of the hand.
A pixel to pixel XOR logical operator is applied
to perform the comparison between the polygons im-
age and the binary human hand image. It consists of
an XOR operation between each pixel of the poly-
gons image and its correspondent pixel in the hand
image, similarly to methods present in the available
literature (Bovik and Desai, 2000; Koukounis et al.,
2011; Mookdarsanit et al., 2015; de Faria Lemos
et al., 2017). An analogous procedure is illustrated
in Fig. 4. In this figure, I1 represents a setpoint im-
age to which image I2 will be compared. The pixel to
pixel XOR operation is applied to these images (sec-
ond line of the illustration), resulting in the last figure
of the illustration.
The output of the ”pattern recognition” module is
the percentage between the number of black pixels
in the resulting image of the XOR operation and the
number of black pixels in the binary hand picture.
ICAART 2020 - 12th International Conference on Agents and Artificial Intelligence
628
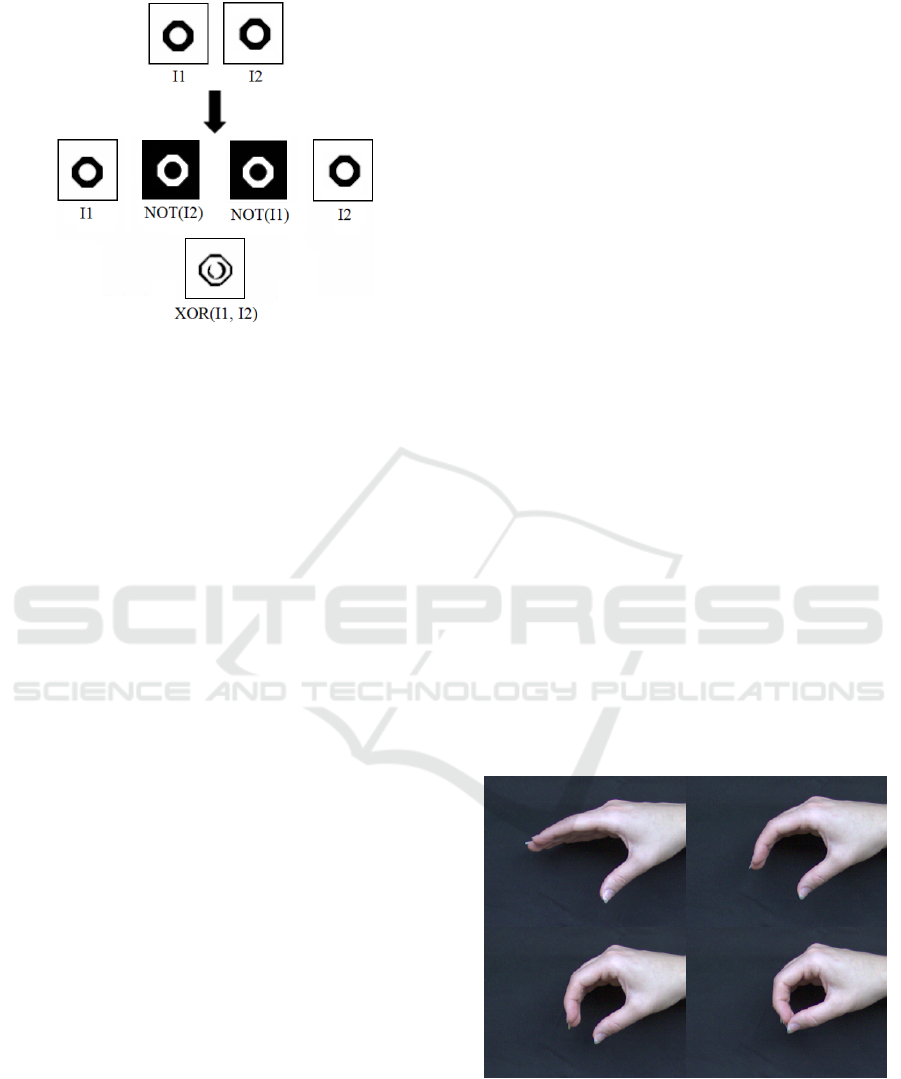
Figure 4: Illustration of a pattern recognition procedure by
using a pixel to pixel XOR operation. Source: (Bovik and
Desai, 2000), modified.
2.2 Optimization
Evolutionary algorithm is a set of algorithms applied
in complex search and optimization tasks, which re-
semble natural evolution. Based on Darwinian evolu-
tionary theory, genetic algorithms are the most pop-
ular techniques among them (Mirjalili and Lewis,
2016; Rashedi et al., 2009). In these algorithms,
a population of candidate solutions is, usually, ran-
domly generated and evaluated to select population
members who survive to reproduce. A recombination
process builds new individuals by application of the
crossing operator on the selected individuals and mu-
tation is applied to the descendants (Holland, 1992;
Holland et al., 1992; Sastry et al., 2005).
Proposed by Eberhart and Kennedy (Eberhart and
Kennedy, 1995), particle swarm is an optimization
algorithm based on social–psychological principles.
In this algorithm, all particles survive, contrary to
the selection method, used in evolutionary algorithms
(Kennedy, 2010). The method simulates birds’ preda-
tory behavior and uses the input parameters to define
a particle in the high dimension search space. The
searching direction of each particle is updated by its
best solution and also by a global best solution, which
is the best solution among all the particles that com-
pose the swarm (Rashedi et al., 2009; Feng et al.,
2018).
To optimize the cost function, described in the
previous subsection, the MatLab modules ”ga” and
”particleswarm” were elected to perform genetic al-
gorithm and particle swarm optimization, respec-
tively. The first used gaussian mutation with a migra-
tion fraction of 0.2. Similarly, crossover rate, pareto
fraction and population size were selected as 0.8, 0.35
and 200. As for the latter, the optimization parame-
ters chosen for PSO were adaptive inertia with a range
of 0.1 to 1.1, swarm size, learning factor of cognitive
component and social component were respectively
set to 100, 1.49 and 1.49. The parameter sets for
both optimization methods were chosen by an itera-
tive approach, in which the best parameter combina-
tions were selected from the several tested groups.
Both methods shared the same input images and
search spaces for comparison purposes. However, five
different scenarios were created to provide sensitivity
analysis. The range of rectangles angular positions
were fixed as 45 degrees in all simulated scenarios. In
contrast, the range of point positions and dimensions
started with the amount of 10 pixels and increased
to 20, 30, 40 and 50 pixels on subsequent scenarios.
These range values were chosen to vary around the
smallest hand segment dimension, which corresponds
to the width of the index finger distal phalanx, approx-
imately 40 pixels.
2.3 Images Acquisition
The human hand pictures used as comparison images
of the pattern recognition module are presented in
Fig. 5. These images were captured from a single sub-
ject while performing cylindrical pinch movements in
a controlled environment. They were acquired by a
Basler acA640 − 750um USB 3.0 camera with reso-
lution (HxV ), pixel size (HxV ) and frame rate of 640
px x 480 px, 4.8 µm x 4.8 µm and 751 fps equipped
with Basler lens C23 − 1216 − 2M with fixed focal
length of 12 mm, aperture range from F1.6 - F16 and
a resolution of 2 megapixels.
Figure 5: Pose images used in the experiment. These im-
ages were acquired from a single subject while performing
a cylindrical pinch movement.
A Markerless Joint Detection through a Hand Geometric Representation
629
3 RESULTS AND DISCUSSION
This work aims to estimate five human hand joint po-
sitions, which are enumerated in Fig. 3a, from hand
images. These images were acquired from a single
subject while performing a cylindrical pinch move-
ment. In total, 4 different pose images were used in
the experiment, as presented in Fig. 5. For each pose,
5 distinct ranges of search space were selected, as dis-
cussed in section 2.2, and all tests were performed
using both optimization methods: PSO and GA. In
summary, 40 particular experiments were performed,
totalizing in 200 estimated joint positions.
In order to quantify the estimated joint positions’
performance, the positions of the joints were com-
pared with the human-annotated position. Naturally,
the actual location of the joint is not a single point,
rather a region. These regions were defined as cir-
cumferences of 20 pixels radius for joints 1, 4 and 5
and 15 pixels radius for joints 2 and 3. The center
of each region was chosen as a physiologically suit-
able point for the joint position. The interpretation of
the positive result is here defined as a point that falls
inside these regions, Table 2 synthesizes the results
achieved according to each scenario. Table 2 also
shows the maximum, minimum and average perfor-
mance of the scenarios in terms of the cost function
values described in section 2.1.2.
Considering all 20 experiments performed by each
optimization method, PSO outperforms GA in the
overall accuracy of positive results, with an assertive
rate of 82% of estimated joints placed inside the fit-
ting regions, in contrast to 80% correctly estimated
by GA. PSO also achieved greater performance, with
8.8% on average in terms of the cost function values,
while GA obtained 10.1%.
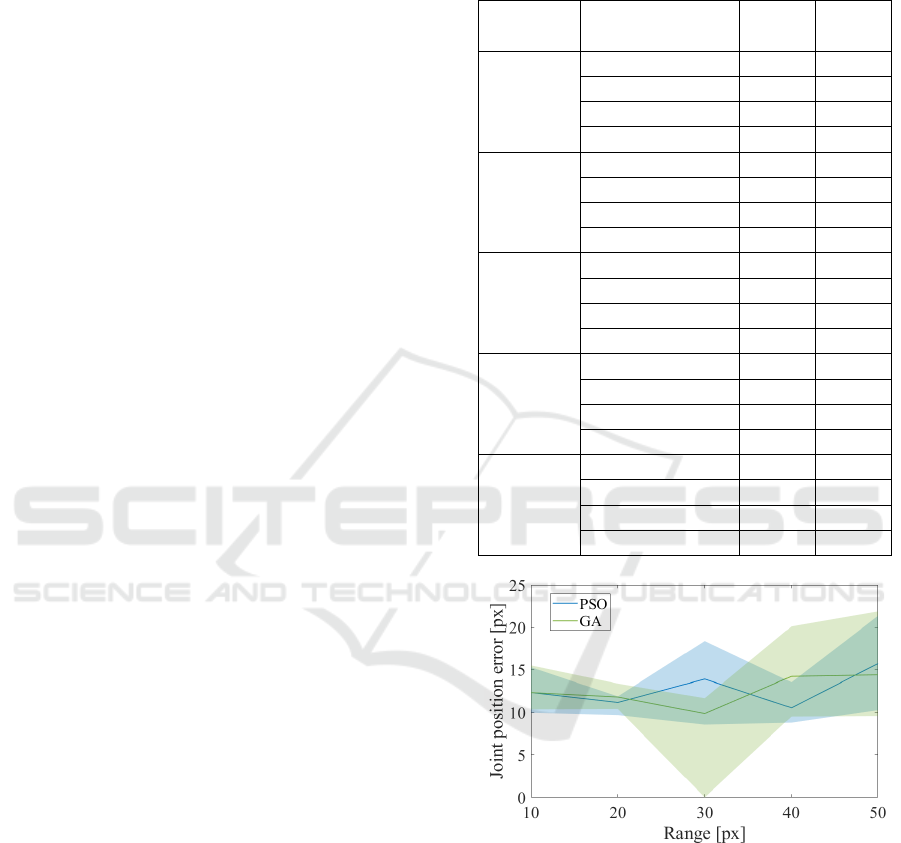
The performance of the methods can also be esti-
mated by the distance between the output and the cen-
ter of the fitting regions. These differences are labeled
from this point of the text as position errors. Fig. 6
shows the behavior of the distance from the center of
the joint over the adopted ranges. Even though a clear
relationship between the performance and adopted
range does not arise in either method, PSO showed
less variance in performance. It is worth to mention,
that the adoption of greater pixel range translates to a
more generalist method, allowing a wider gamma of
hand sizes.
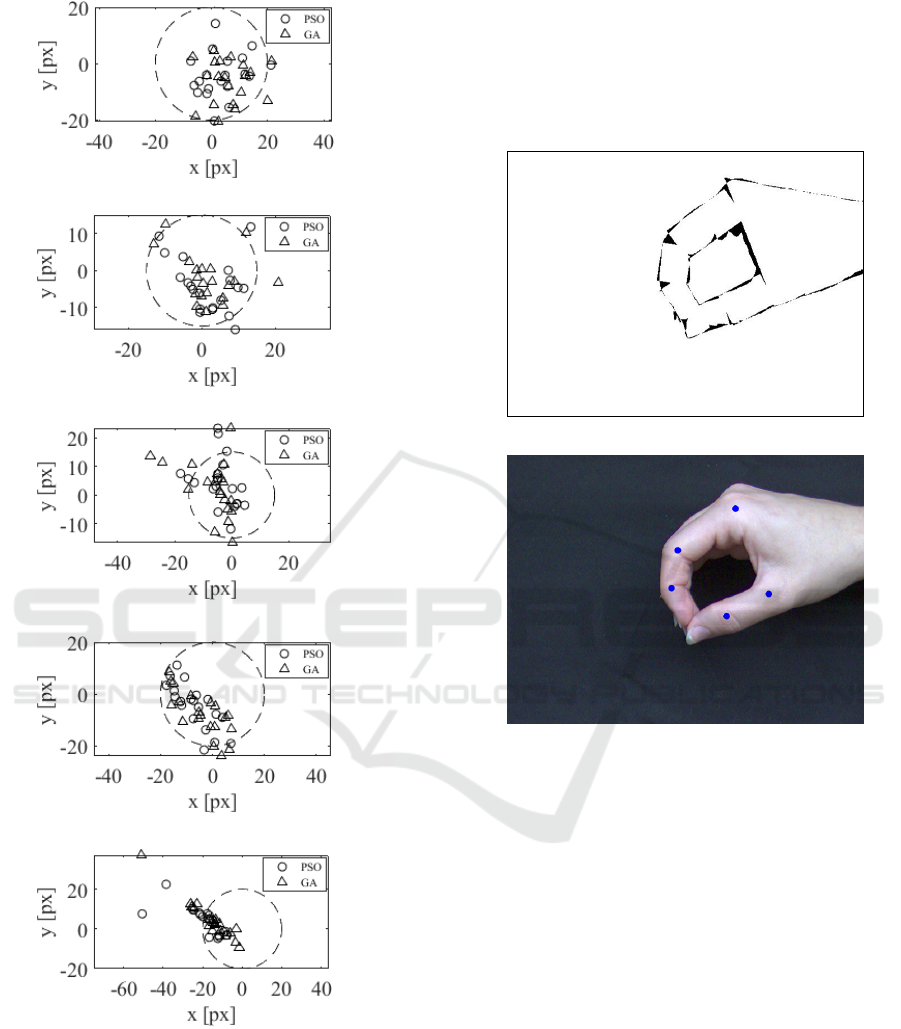
The performance of the method can also be vi-
sualized grouped by joint individually, as shown in
Fig. 7. This figure displays the dispersion of the po-
sition errors for each optimization method in contrast
to the fitting regions. At first glance, it can be noticed
that for the majority of the joints present a component
Table 2: Results achieved by both optimization methods ac-
cording to each range of search space. Maximum, mini-
mum and mean percentage refers to the performance of the
scenarios in terms of the cost function values and positive
results indicate the total of assertive estimated joints.
Adopted
Range
Comparison
Parameter
PSO GA
50 px
Max. pct. [%] 7.1 9.3
Min. pct. [%] 6.3 7.4
Mean pct. [%] 6.9 8.1
Positive results 15/20 17/20
40 px
Max. pct. [%] 8.0 12.7
Min. pct. [%] 5.8 8.7
Mean pct. [%] 7.0 10.2
Positive results 19/20 14/20
30 px
Max. pct. [%] 10.7 10.6
Min. pct. [% 7.0 8.1
Mean pct. [%] 8.8 9.5
Positive results 15/20 18/20
20 px
Max. pct. [%] 9.9 10.6
Min. pct. [%] 8.0 8.7
Mean pct. [%] 8.9 9.6
Positive results 17/20 15/20
10 px
Max. pct. [%] 17.4 17.5
Min. pct. [%] 8.8 9.0
Mean pct. [%] 12.4 12.9
Positive results 16/20 16/20
Figure 6: Sensibility analysis: Distance from region center
versus range.
of systematic error. However, the number of exper-
iments executed at this point is not large enough for
drawing conclusions. Future possibilities regarding
this fact will be mention on 4. On the other hand, it
is clear that there is a predominance of position errors
within the fitting position.
Fig. 8 exemplifies the joint tracking result for an
arbitrary position and range. The figure is referent to
the result of the Particle Swarm Optimization method.
Because of the consistency across simulations led the
ICAART 2020 - 12th International Conference on Agents and Artificial Intelligence
630
(a)
(b)
(c)
(d)
(e)
Figure 7: Dispersion of the position errors for each opti-
mization method in contrast to the fitting regions (dashed
line). a) Joint 1 - metacarpophalangeal joint of index finger;
b) Joint 2 - proximal interphalangeal joint of index finger;
c) Joint 3 - distal interphalangeal joint of index finger; d)
Joint 4 - metacarpophalangeal joint of thumb; e) Joint 5 -
interphalangeal joint of the thumb.
authors to elect it as the standard method of optimiza-
tion. In the first image, Fig.8a, it is shown the output
of the XOR operation between the binary image of
the hand and its geometric representation. While in
Fig.8b the overlapped image from the hand and the
estimated joints are exhibit.
(a)
(b)
Figure 8: Example of a joint tracking result for an arbitrary
position and range. a) Output of the XOR operation be-
tween the binary image of the hand and its geometric rep-
resentation. b) Overlapped image from the hand and the
estimated joints.
4 CONCLUSIONS AND FUTURE
WORK
The position tracking of the hand joints has a diverse
gamma of application. Even though the literature of-
fers some solution, there is no convergence or es-
tablished approach. This work presented a novel al-
gorithm which utilizes two metaheuristic search ap-
proach allied to a simple image processing technique
to build a geometric representation of the human hand
while performing cylindrical pinch. From this model
is possible to derive joint positions through marker-
less digital images, information which is crucial in
certain fields, such as occupational therapy.
A Markerless Joint Detection through a Hand Geometric Representation
631

Future works should be carried out addressing but
not limited to these shortcomings:
1. Data Collection: As pointed out previously, the
lack of standardized, open-sourced dataset still
limits research in the field. Data collection should
be carried out to support more robust solutions.
2. Models Building: The search for the most suit-
able optimization method is far from exhausted,
different solutions should be tested (e.g. artificial
immune system).
3. Models Integration: Support models can be
applied to boost effectiveness (e.g. population
creation schemes, dynamic bounds, occlusion
solver).
4. Error Analysis: Patterns in the error distribution
might arise when considering a bigger dataset,
which can be leverage (e.g. Error regression mod-
els).
REFERENCES
Adams, R., Olowin, A., and Hannaford, B. (2015). Gloved
human-machine interface. US Patent 9,104,271.
Barroso, P., Vecchio, S., Xavier, Y., Sesselmann, M.,
Ara
´
ujo, P., and Pinotti, M. (2011). Improvement of
hand function in children with cerebral palsy via an
orthosis that provides wrist extension and thumb ab-
duction. Clinical Biomechanics, 26(9):937–943.
Barroso, P. N. (2010). Nova
´
Ortese de Extens
˜
ao de Punho
e Abdutora de Polegar para Crianc¸as com Paralisia
Cerebral: Avaliac¸
˜
ao de suas Contribuic¸
˜
oes para o
Incremento da Funcionalidade Manual. PhD thesis,
Federal University of Minas Gerais.
Barroso, P. N., Nagem, D. A. P., Miranda, R. J. C., Kirk-
wood, R., and Pinotti, M. (2007). Quantitative anal-
ysis of thumb range of motion during functional ac-
tivities. 19th International Congress of Mechanical
Engineering, 1:1–6.
Bovik, A. and Desai, M. (2000). Handbook of Image and
Video Processing, chapter 2, Basic image processing
techniques, pages 21–27. Academic Press, San Diedo.
Coimbra, D. F. M. (2011). O tratamento da rizartrose: Es-
tado da arte. Instituto de Ci
ˆ
encias Biom
´
edicas Abel
Salazar.
Crasto, J. A., Sayari, A. J., Gray, R. R., and Askari, M.
(2015). Comparative analysis of photograph-based
clinical goniometry to standard techniques. Hand,
10(2):248–253.
de Faria Lemos, A., da Silva, L. A. R., Furtado, E. C., and
de Paula, H. (2017). Positioning error estimation of
steel strips in steckel rolling process using digital im-
age processing. In 2017 IEEE Industry Applications
Society Annual Meeting, pages 1–8. IEEE.
Deimel, R. and Brock, O. (2016). A novel type of compliant
and underactuated robotic hand for dexterous grasp-
ing. The International Journal of Robotics Research,
35(1-3):161–185.
Eberhart, R. and Kennedy, J. (1995). Particle swarm
optimization. In Proceedings of the IEEE inter-
national conference on neural networks, volume 4,
pages 1942–1948. Citeseer.
Endo, T. and Kawasaki, H. (2015). A fine motor skill train-
ing system using multi-fingered haptic interface robot.
International Journal of Human-Computer Studies,
84:41–50.
Feng, X., Ling, X., Zheng, H., Chen, Z., and Xu, Y. (2018).
Adaptive multi-kernel svm with spatial-temporal cor-
relation for short-term traffic flow prediction. IEEE
Transactions on Intelligent Transportation Systems,
20(99):1–13.
Gruji
´
c, T. and Bonkovi
´
c, M. (2015). Measurement and
analysis of human hand kinematics. World Academy
of Science, Engineering and Technology International
Journal of Biomedical and Biological Engineering,
9(2):97.
Hagert, E., Lee, J., and Ladd, A. L. (2012). Innervation
patterns of thumb trapeziometacarpal joint ligaments.
The Journal of hand surgery, 37(4):706–714.
Holland, J. H. (1992). Genetic algorithms. Scientific amer-
ican, 267(1):66–73.
Holland, J. H. et al. (1992). Adaptation in natural and ar-
tificial systems: an introductory analysis with appli-
cations to biology, control, and artificial intelligence.
MIT press.
Kennedy, J. (2010). Particle swarm optimization. Encyclo-
pedia of machine learning, pages 760–766.
Kingsbury, S. R., Gross, H. J., Isherwood, G., and
Conaghan, P. G. (2014). Osteoarthritis in europe:
impact on health status, work productivity and use
of pharmacotherapies in five european countries.
Rheumatology, 53(5):937–947.
Koukounis, D., Nicholson, L., Bull, D. R., and Achim, A.
(2011). Retinal image registration based on multi-
scale products and optic disc detection. In 2011 An-
nual International Conference of the IEEE Engineer-
ing in Medicine and Biology Society, pages 6242–
6245. IEEE.
Leon, B., Morales, A., and Sancho-Bru, J. (2013). From
Robot to Human Grasping Simulation, chapter 5, The
Model of the Human Hand, pages 123–174. Springer.
Matsubara, T. and Morimoto, J. (2013). Bilinear modeling
of emg signals to extract user-independent features for
multiuser myoelectric interface. IEEE Transactions
on Biomedical Engineering, 60(8):2205–2213.
Mirjalili, S. and Lewis, A. (2016). The whale optimization
algorithm. Advances in engineering software, 95:51–
67.
Mookdarsanit, P., Soimart, L., Ketcham, M., and Hnoohom,
N. (2015). Detecting image forgery using xor and
determinant of pixels for image forensics. In 2015
11th International Conference on Signal-Image Tech-
nology & Internet-Based Systems (SITIS), pages 613–
616. IEEE.
ICAART 2020 - 12th International Conference on Agents and Artificial Intelligence
632

Mueller, F., Bernard, F., Sotnychenko, O., Mehta, D., Srid-
har, S., Casas, D., and Theobalt, C. (2018). Ganerated
hands for real-time 3d hand tracking from monocular
rgb. In Proceedings of the IEEE Conference on Com-
puter Vision and Pattern Recognition, pages 49–59.
Mueller, F., Mehta, D., Sotnychenko, O., Sridhar, S., Casas,
D., and Theobalt, C. (2017). Real-time hand tracking
under occlusion from an egocentric rgb-d sensor. In
Proceedings of the IEEE International Conference on
Computer Vision, pages 1284–1293.
Musiolik, A. (2008). Multibody model of the human hand
for the dynamic analysis of a hand rehabilitation de-
vice. Universidade Tecnica de Lisboa.
Neves, D. R. (2011). Desenvolvimento de modelos
biomec
ˆ
anicos tridimensionais do membro superior:
m
˜
ao e cotovelo. Master’s thesis, Federal University
of Minas Gerais, Minas Gerais, Brazil.
Quigley, M., Salisbury, C., Ng, A. Y., and Salisbury, J. K.
(2014). Mechatronic design of an integrated robotic
hand. The International Journal of Robotics Research,
33(5):706–720.
Rashedi, E., Nezamabadi-Pour, H., and Saryazdi, S. (2009).
Gsa: a gravitational search algorithm. Information
sciences, 179(13):2232–2248.
Saikia, G. (2014). Extending modules for icub simulator
to emulate human grasp forms. In Signal Processing
and Integrated Networks (SPIN), 2014 International
Conference on, pages 636–640. IEEE.
Sastry, K., Goldberg, D., and Kendall, G. (2005). Genetic
algorithms. In Search methodologies, pages 97–125.
Springer.
Souza, L. K., Rezende, A. P., and Petten, A. M. V. N.
(2015). O efeito da
´
Ortese curta para rizartrose na
forc¸a de preens
˜
ao e forc¸a de pinc¸a: Estudo de caso
´
Unico. Revista de Terapia Ocupacional da Universi-
dade de S
˜
ao Paulo, 26:250–257.
Sridhar, S., Mueller, F., Oulasvirta, A., and Theobalt, C.
(2015). Fast and robust hand tracking using detection-
guided optimization. In Proceedings of the IEEE Con-
ference on Computer Vision and Pattern Recognition,
pages 3213–3221.
Supancic, J. S., Rogez, G., Yang, Y., Shotton, J., and Ra-
manan, D. (2015). Depth-based hand pose estima-
tion: data, methods, and challenges. In Proceedings
of the IEEE international conference on computer vi-
sion, pages 1868–1876.
Zhou, Y., Jiang, G., and Lin, Y. (2016). A novel finger
and hand pose estimation technique for real-time hand
gesture recognition. Pattern Recognition, 49:102–
114.
A Markerless Joint Detection through a Hand Geometric Representation
633
