
Impact of Security Measures on Performance Aspects in SysML Models
Maysam Zoor, Ludovic Apvrille and Renaud Pacalet
LTCI, Télécom Paris, Institut Polytechnique de Paris, France
Keywords:
Embedded Systems, Security, Performance, MBSE, Simulation, Verification.
Abstract:
Because embedded systems are now frequently connected, security must be taken into consideration during
system modeling. However adding security features can degrade performance. In this paper, the trade-off
between security and performance is tackled with a new model-based method that can automatically assess
the impact of security measures on performance. The contribution is illustrated with an industrial motor
control taken from the H2020 AQUAS project.
1 INTRODUCTION
Ensuring the safety of embedded systems implies to
also take into account security threats (Chai et al.,
2019) (Jiang et al., 2013). However security mea-
sures require extra processing time which might de-
grade system performance (Chai et al., 2019)(Li,
2018)(Kocher et al., 2004)(Apvrille and Li, 2019).
(Davis, 2014) defines the time constraints as "end-
to-end deadlines on the elapsed time between a stim-
uli and the corresponding response". (Li, 2018) added
to that the percentage of usage of system’s compo-
nents to characterize system performance.
Studying security and performance in an isolated
manner is not as efficient as considering the depen-
dency between them (Gruber et al., 2018). Also,
as stated by (Viehl et al., 2006), estimating perfor-
mance and evaluating an architectures at an early de-
sign stage is considered as "very valuable approach in
the area of SoC design".
Our contribution proposes to tackle the interde-
pendency and trade-offs between performance and se-
curity requirements of embedded systems at an early
design stage. Our new performance analysis approach
is based on simulation traces and SysML model anal-
ysis. It is expected to allow engineers to adjust bet-
ter the design in early stages of the product life cy-
cle, leading to a balanced solution with a decrease in
the development time and efforts and an increase in
product quality (Friedenthal et al., 2014). The nov-
elty of the presented performance analysis method is
its ability to provide answers to questions such as (i)
which security HW/SW might delay a critical event,
(ii) how to map security algorithms (e.g. HW/SW
components) and which more general hardware plat-
form should be used, including buses able not to delay
critical messages, including secured messages.
These questions form a subset of larger set of
questions faced by a designer during a system-level
design (Thiele et al., 2007). Answers to these ques-
tions will help designers estimate the relation between
added security and performance early in the design.
The next section studies related work. Then, sec-
tion 3 presents the SysML-Sec modeling and veri-
fication approach upon which our new contribution
is based. Our performance analysis approach is ex-
plained in section 4, and illustrated in section 5 with
a motor drive system. Finally, section 6 concludes the
paper.
2 RELATED WORK
Although the trade off between security and perfor-
mance in embedded systems has been highlighted
since years (Kocher et al., 2004), it wasn’t until re-
cently that the impact of added security on system
performance started to be studied in the design stage.
Fujdiak et al (Fujdiak et al., 2018) proposes exper-
imental measurements that demonstrate a linear rela-
tion between security levels and performance.
(Li et al., 2017) relies on a modeling and verifi-
cation tool named TTool (Apvrille, 2013) (section 3)
to study the security-performance dependency in a
disaster relief drone model. In their work, Li et al,
compared the total execution cycles of secure and
non secure designs to show the performance impacts
of security in concrete systems. Yet, designers have
Zoor, M., Apvrille, L. and Pacalet, R.
Impact of Security Measures on Performance Aspects in SysML Models.
DOI: 10.5220/0008970203730380
In Proceedings of the 8th International Conference on Model-Driven Engineering and Software Development (MODELSWARD 2020), pages 373-380
ISBN: 978-989-758-400-8; ISSN: 2184-4348
Copyright
c
2022 by SCITEPRESS – Science and Technology Publications, Lda. All rights reserved
373
no way to figure out which HW/SW elements really
caused extra delays.
To enhance this security-performance trade-off
study, the latency concept was added to TTool (Li,
2018). TTool can thus now measure the min, max
and average latency between (safety critical) events.
Yet, the explanation of why the latency has increased
when updating a model still relies on manual analysis
of — sometimes very long — simulation traces.
Another approach to study the trade-off between
security and performance is based on the interaction
between two different tools as presented in (Fujdiak
et al., 2019). In this interaction, TTool was used to
help decide which security level shall be selected with
regards to the desired performance by comparing the
final system response time of a model for different
security levels.
Time analysis can be performed using multiple ap-
proaches. These approaches can be classified into dif-
ferent categories. Simulation and formal approaches
are the most used ones in the domain of performance
estimation of embedded systems (Thiele et al., 2007)
(Viehl et al., 2006). While simulation tools and indus-
trial frameworks e.g. Koski (Kangas et al., 2006) can
only consider a limited set of execution traces and cor-
ner cases are usually unknown (Thiele et al., 2007),
formal approaches like timed automata are usually
limited on scope to the model under analysis where
sharing of resources leading to complex interactions
among components is difficult to take into considera-
tion.
To overcome the limitations encountered when us-
ing either methods, (Thiele et al., 2007) and (Viehl
et al., 2006) combined simulation and formal ap-
proaches to analyze system performance. However
in these approaches, verifying the security of a model
and the impact of the added security method on the
functional and architecture aspects is not supported.
The model-based environment TimeSquare
(DeAntoni and Mallet, 2012), supporting the Clock
Constraint Specification Language (CCSL), provides
facilities for performance analysis, in particular for
the analysis of execution traces. Yet, it lacks security
verification and architecture exploration techniques.
Based on this overview, we will take advantage of
the already developed security-performance trade-off
analysis within TTool and more precisely its model-
ing profile named SysML-Sec to study the effect of
security features (added computations, added com-
munications and increased message sizes) onto sys-
tem performance.
3 SysML-Sec
3.1 Method
Sysml-Sec is one of the modeling profiles supported
by the free and open-source toolkit named TTool
(Apvrille, 2013). Sysml-Sec (Apvrille and Roudier,
2013) extends SysML for the design of safe and se-
cure embedded systems while taking performance as-
pects into account. SysML-Sec methodology allows
system designers to iterate over safety and security
features and continuously check if the system require-
ments still hold. This verification can be done along
the three stages of the SysML-Sec method (see Fig-
ure 1): analysis, HW/SW Partitioning and Software
Design (Apvrille and Li, 2019).
After the analysis stage where requirements at-
tacks and faults are captured, system design includes
system-level HW/SW partitioning and software de-
sign. First, in the HW/SW partitioning stage, the
architecture and high-level functional behavior are
modeled at a high-level of abstraction and then linked
in the mapping stage, as defined in the Y-Chart ap-
proach (Kienhuis et al., 2001). Second, the design of
software components is performed (Li, 2018).
Verification can be performed with a press-button
approach from most diagrams to determine if the de-
fined requirements are satisfied. TTool can perform
verifications using formal techniques (e.g., model-
checking) and simulations. Safety verification relies
on the TTool model checker. Security verification re-
lies on an external toolkit called ProVerif (Blanchet
et al., 2018). Performance verification relies on a
System-C like simulator of TTool.
HW/SW Partitioning
Application
Architecture
Mapping
Software Design
Code
Generation
(Formal) Verification
Legend
Modeling
Verification
Method Flow
Analysis
Requirements
Attack Trees
Fault Trees
Sec/Saf/Perf
(Formal) Verification or
Design Space Exploration
Figure 1: SysML-Sec modeling profile used in TTool.
3.2 HW/SW Partitioning
The paper now focuses on HW/SW partitioning. A
HW/SW partitioning P is formally defined as the
composition of a Functional Model FM, an Architec-
MODELSWARD 2020 - 8th International Conference on Model-Driven Engineering and Software Development
374

ture Model AM and a Mapping Model MM (Li, 2018):
P = (FM, AM, MM) (1)
3.2.1 Application/Functional Modeling
A Functional Model FM is captured with SysML
block diagrams. FM has a set of Tasks T and of com-
munications Comm between tasks (Li, 2018):
FM = (T, Comm) (2)
Each task t ∈ T has a set of attributes Attr and a
behavior O described with an activity diagram built
upon a set of operators:
t = (Attr, O ) (3)
Operators (equation 4) can be divided into 3 oper-
ator categories. Control operators CtrlOp handle the
execution flow of a task e.g. loops and tests. Commu-
nication operators CommOp refer to Channels, Events
or Requests: channels model data exchange, events
are used for synchronization and requests model task
spawning. Last, Complexity operators CompOp cap-
ture computation complexity e.g. in terms of int op-
erations (ExecI). An operator θ ∈ O is defined as
follows:
θ ∈{StartState, StopState, ForLoop, Choice,
Sequence, SelectEvt, SendEvent, ReadChannel,
W riteChannel, SendRequest, ReadRequestArg,
WaitEvent, ExecI, ExecC, Delay, Random}
(4)
The next operator(s) for each θ are known as a set of
sub
O
. CtrlOp operators may have several next opera-
tors depending on the guard conditions. The connec-
tion between θ and its next operators in sub
O
will be
denoted as ControlFlow
(θ →sub
O
)
.
3.2.2 Architecture Modeling
An Architecture Model AM is built upon a set of
hardware nodes and links Links between nodes de-
scribed with a UML Deployment Diagram. Hard-
ware nodes are split into of three sets: execution
(ExecNode), communication (CommNode) and stor-
age nodes (StNode). An Architecture Model is de-
fined as folllows:
AM = (ExecNode, CommNode, StNode, Links) (5)
3.2.3 Mapping Modeling
A mapping model specifies where tasks and there
communications are allocated to hardware compo-
nents using UML deployment diagrams. Tasks
mapped to processors are software implemented
while tasks mapped to Hardware Accelerators are
hardware implemented. A task t mapped in a parti-
tioning p is denoted as t
p
.
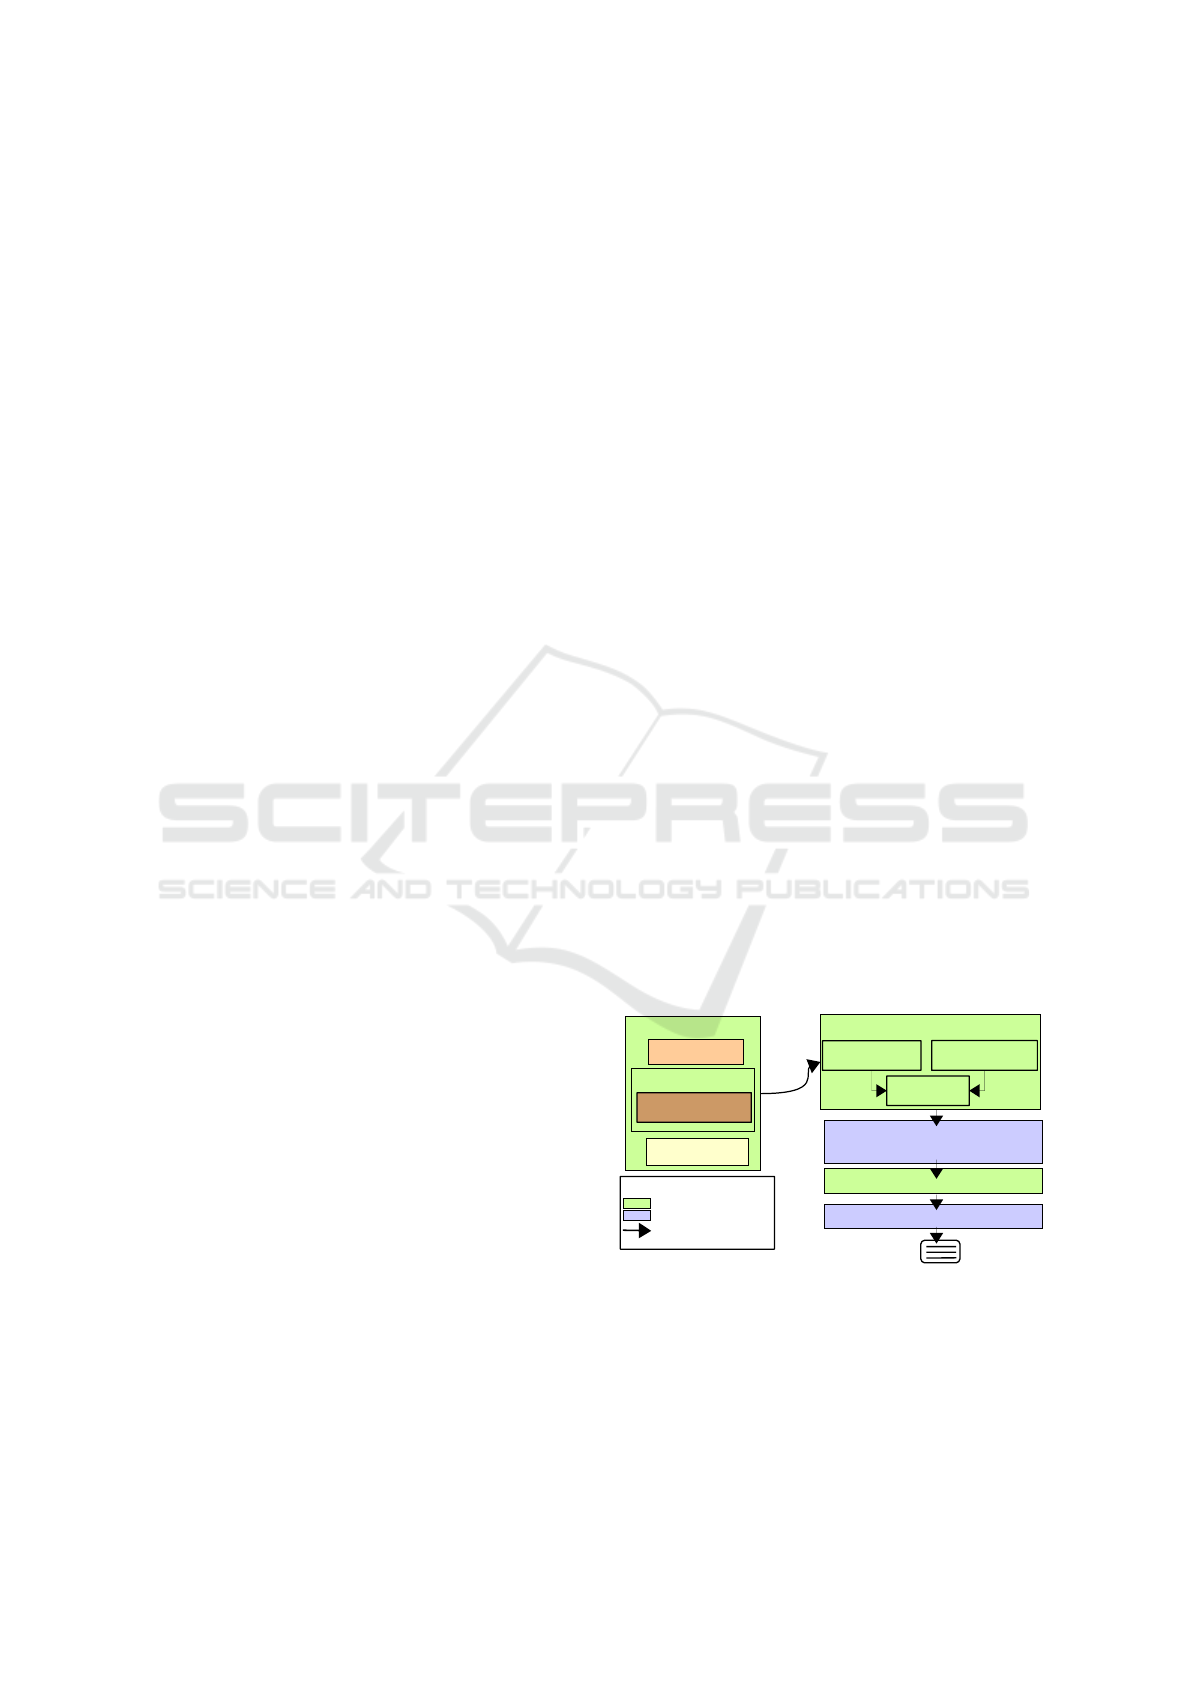
4 PERFORMANCE EVALUATION
Simulation of mapping models helps understanding
system performance especially after security mea-
sures have been added. Yet, understanding the pre-
cise cause of extra latencies when adding extra mech-
anisms requires to improve the ways simulation traces
can be investigated. To so do, we introduce a new
way (shown in Figure 2) to compare parts of simula-
tion traces (called "simulation trace analysis" or STA)
related to an extra mechanism.
1. A simulation trace is computed using TTool’s
simulator
2. Among the operators O of all tasks in T , the de-
signer selects two of them between which the la-
tency will be analyzed.
3. The mapping model is transformed into a directed
graph so as to analyze the dependencies inside of
the simulation trace
4. The Simulation trace, the two operators, and the
directed graph are injected into our simulation
trace analyzer (detailed below).
Of course, all other verification techniques (e.g. ver-
ifying security properties) are still available and used
for their respective purposes.
4.1 Latency Graph Generation
Latency graphs are directed graphs. A mapping
model is transformed into a latency graph G consist-
ing of a set of vertices’s ν and a set of directed edges
ε.
G = (ν, ε) (6)
A vertex in the set ν represents either a task, or a task
operator in the functional model, or a hardware node
in the architecture model
ν ⊆ N
AM
∪ N
FM
(7)
where N
AM
∈ {CommNode, StoreNode, ExecNode}
and N
FM
∈ {T, θ } An edge in the set ε represents an
element of an activity diagram i.e.
ε ⊆ Links ∪Comm ∪ControlFlow
(θ →sub
O
)
(8)
Algorithm 1 (simplified version: loops and sequences
are not shown) builds the graph according to operators
listed in equation 4.
Impact of Security Measures on Performance Aspects in SysML Models
375
(Formal) Verification
Result
Mapping
This Work :
Detailed Latency Analysis
Simulation
Traces
[t
1
,t
2
]
Simulation
Trace Analysis
(STA)
Latency
Directed
Graph
CPU_Send
Bus
send
Data_t1
send
Data_t1
send
Data_t1
CPU_Receive
compute compute
receive
Data_t2
send
Data_t1
Performance
Security
ProVerif
(3rd Party)
C++
Simulator
Activity
Diagram
STA Inputs
Verification
Tool
Mapping
Output
chl
data(1)
chl
data(1)
evt
compute1()
<<CPURR>>
CPU_send
f::sendData
<<Bus>>
Bus0
f::data
channel
<<CPURR>>
CPU_Receive
f::receive
f::compute
HW/SW
Partitioning
Figure 2: Detailed Latency Analysis Method added to SysML-sec.
4.2 Detailed Latency Analysis Method
4.2.1 Simulation Transaction
TTool’s simulator for mapped models is transaction-
based (Knorreck, 2011), and takes into account both
HW and SW elements. For short, a simulation trans-
action contains the following attributes:
• device, task and operator: device executed an
operator of task
• startTime and endTime (in clock cycles)
• length: number of clock cycles needed to execute
the transaction
4.2.2 Simulation Trace
The simulation of a mapped model p for a time inter-
val [t
1
, t
2
] outputs a simulation trace s
t
1
,t
2
p
built upon n
simulation transactions st
x
:
s
t
1
,t
2
p
= {st
1
, . . . , st
n
} (9)
4.2.3 Latency between Operators
Let θ
A
andθ
B
be the two operators between which the
latency is studied in s
p
. All transactions st ∈ s
t
1
,t
2
p
where st.operator = θ
A
are added to Occ
θ
A
(ordered
by start time). Same for Occ
θ
B
. Equation 10 defines
Occ
θ
A
.
Occ
θ
A
= {st
0
A
, st
1
A
, . . . , st
n
A
} (10)
The time delay between the i
th
transaction in Occ
θ
A
and Occ
θ
B
referred to as latency λ
i
can be calculated
as:
λ
i
= endTime
(st
i
B
∈Occ
θ
B
)
− startTime
(st
i
A
∈Occ
θ
A
)
(11)
To compute λ
i
, Occ
θ
A
and Occ
θ
B
should each contain
a transaction at the i
th
position related to θ
A
and θ
B
respectively. In case this condition is not satisfied, or
in case the designer is interested in the max and min
latencies, the algorithm for calculating min and max
latencies (Li, 2018) is applied on Occ
θ
A
and Occ
θ
B
.
TTool can now display λ
i
as well as λ
min
and λ
max
representing the minimum and maximum latency val-
ues between Occ
θ
A
and Occ
θ
B
.
4.2.4 Latency Analysis
Algorithm 2 can compute the reason for the time de-
lay between the i
th
occurrence of the selected op-
erators. It first extracts only all relevant transac-
tions i.e. the ones related to the studied latency. To
do so, the algorithm searches the trace s
p
for trans-
actions that occurred between the startTime
st
i
A
and
endTime
st
i
B
denoted as s
0
p
. It takes as input θ
A
, θ
B
,
startTime
st
i
A
, endTime
st
i
B
, s
p
, and the generated la-
tency graph G. When the considered time delay is
λ
min
or λ
max
, the same algorithm (algorithm 2) is
used however startTime
st
i
A
and endTime
st
i
B
are re-
placed by either startTime
st
min
A
and endTime
st
min
B
or
startTime
st
max
A
and endTime
st
max
B
respectively. How-
ever not all transactions in s
0
p
are directly related to
the delay between startTime
st
i
A
and endTime
st
i
B
. In
order to extract which transactions are involved in
this delay, we rely on graph g: we first build all
possible paths Pa from θ
A
to θ
B
. For each trans-
action in st ∈ s
0
p
, if st belongs to Pa then we con-
sider that st is mandatory i.e. it contributes directly
to the delay λ
i
, thus it is added to an array named
onPathTransactions. In case there is no path between
node
θ
A
and node
θ
B
, then a transaction is considered
MODELSWARD 2020 - 8th International Conference on Model-Driven Engineering and Software Development
376

Algorithm 1: Latency Graph Generation.
Data: Mapping Diagram
Result: Latency Graph
1 foreach node in AM | node
∈ {CommNode, StoreNode} do
2 addVertex(node) ;
3 foreach Comm | ∃ mapping (node,Comm)
do
4 addVertex(Comm);
5 addEdge(node, Comm);
6 end
7 end
8 foreach node in AM | node ∈ExecNode do
9 addVertex(node);
10 foreach task | ∃ mapping (node,task) do
11 addVertex(task);
12 addEdge(node, task);
13 while ∃ operator θ | θ ∈ O
task
do
14 previousOp.add({θ, sub
O
});
15 if θ instanceof StartState then
16 addVertex(θ );
17 addEdge(task, θ );
18 else if θ instanceof StopState then
19 addVertex(θ );
20 foreach θ
i
| θ
i
∈ previousOp
do
21 if θ ∈ sub
O
i
then
22 addEdge(θ
i
, θ );
23 if θ
i
∈ sub
O
j
| sub
O
j
∈
previousOp and θ
j
instanceof ForLoop
or Sequence then
24 addEdge(θ , θ
j
);
25 end
26 . . .
27 end
28 else
29 addVertex(θ );
30 foreach θ
i
| θ
i
∈ previousOp
do
31 if θ ∈ sub
O
i
then
32 addEdge(θ
i
, θ );
33 end
34 end
35 end
36 end
37 end
38 foreach link in Links do
39 addEdge(link
start
,link
end
)
40 end
41 foreach taskComm in Comm do
42 addEdge(taskComm
send
,taskComm
rec
)
43 end
as mandatory if it corresponds to a node node
θ
that
has path from node
θ
A
or a path to node
θ
B
.
In addition to the traces added to
onPathTransactions, s
0
p
might contain transac-
tions that are not on the path between node
θ
A
and
node
θ
B
but which may be executed on the same
hardware as either θ
A
or θ
B
. These transactions,
saved in hardwareDelayTran array, might contribute
to λ
i
because of the scheduling policies: they might
delay transactions related to onPathTransactions
thus contributing to an increase in λ
i
.
TTool can display the result of algorithm 2 with
a table. In this table, each row corresponds to one
hardware node in the system and each column rep-
resents one time slot in the simulation. Transac-
tions are placed according to when and where they
were executed. The transactions that belong to
onPathTransactions are displayed in green and the
ones belonging to hardwareDelayTran are displayed
in red, thus giving an immediate view of the simu-
lation transactions and their related SysML elements
involved in an extra delay. In the scope of this paper,
the transactions in hardwareDelayTran are colored
red regardless if their scheduling increased the delay
between startTime
st
i
A
and endTime
st
i
B
or not. We in-
tend to address this limitation (future work). Also,
our algorithm does not (yet) handle extra delays due
to contentions on communication and storage nodes.
5 CASE STUDY
A motor drive system —defined in the scope of the
H2020 AQUAS project (AQU, 2013)— shows our
performance analysis contribution from SysML mod-
els. The system consists of 3 main components: a mo-
tor, a motor controller and a client application. The
motor controller receives speed and direction values
from the client application and accordingly generates
the right PWM (Pulse Width Modulation) signals and
sends them to the motor. In addition, the motor con-
troller regularly monitors the position data from the
motor to accordingly adjust PWM signals as needed.
Two requirements are considered in the paper:
1. A maximum delay between a user setting speed
and direction values in the client application and
time at which the motor controller takes these new
values into consideration (safety requirement)
2. The speed and direction values sent from the
client application to the controller should remain
confidential (security requirement)
Impact of Security Measures on Performance Aspects in SysML Models
377

Algorithm 2: Simulation trace analysis.
Data: θ
A
,θ
B
, startTime
st
i
A
,endTime
st
i
B
, s
p
,
g
Result: Detailed time analysis between θ
A
,θ
B
1 foreach SimulationTransaction st in s
p
do
2 if st.startTime >= startTime
st
i
A
3 and st.endTime =< endTime
st
i
B
then
4 s
0
p
.add(st)
5 if ∃ path(node
θ
A
→ node
θ
B
) in g
then
6 if node
θ
st
∈ path then
7 onPathTransactions.add(st)
break;
8 else if st.deviceName ==
hardware
θ
A
||θ
B
then
9 hardwareDelayTran.add(st);
10 end
11 else
12 if ∃ path(node
θ
A
→ node
θ
st
) || ∃
path( node
θ
st
→ node
θ
B
) then
13 onPathTransactions.add(st)
14 else if st.deviceName ==
hardware
θ
A
||θ
B
then
15 hardwareDelayTran.add(st);
16 end
17 end
18 end
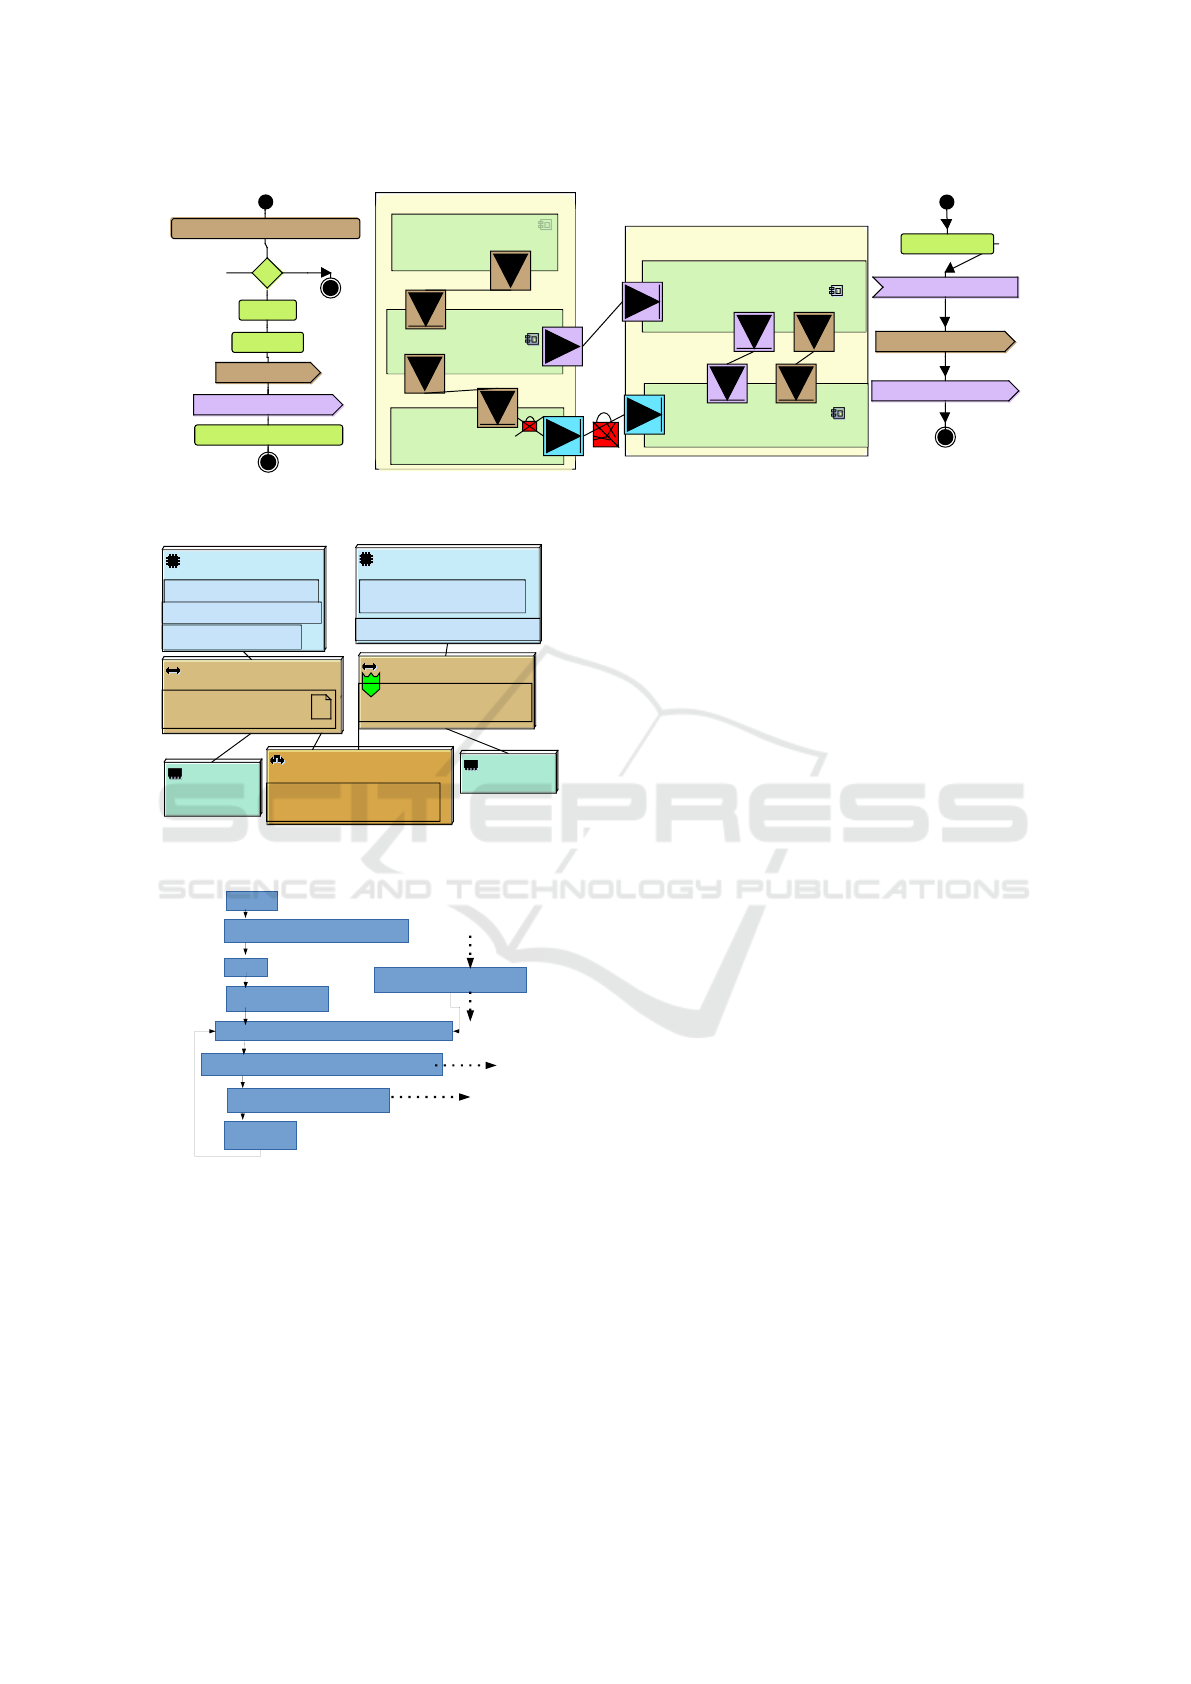
5.1 HW/SW Partitioning Models
The functional model consists of 3 main tasks (Fig-
ure 3): Client_App, Motor_Control_App, and Mo-
tor. The Client_App gets speed and direction from
a user and sends them to the Main_Loop in Mo-
tor_Control_App through the Server_Control_App.
In each periodic iteration of Main_Loop, the speed
and direction of the motor are deduced by reading the
position data and current value sent from the Motor
via Motor_Control_Power. Then the deduced val-
ues are compared with the required values of both
the speed and direction. In case an adjustment is re-
quired, the Main_Loop sends updated PWM signals
to the Motor_Control_Power. Motor_Control_Power
transforms these signals into supply voltages and is-
sues these signals to the motor.
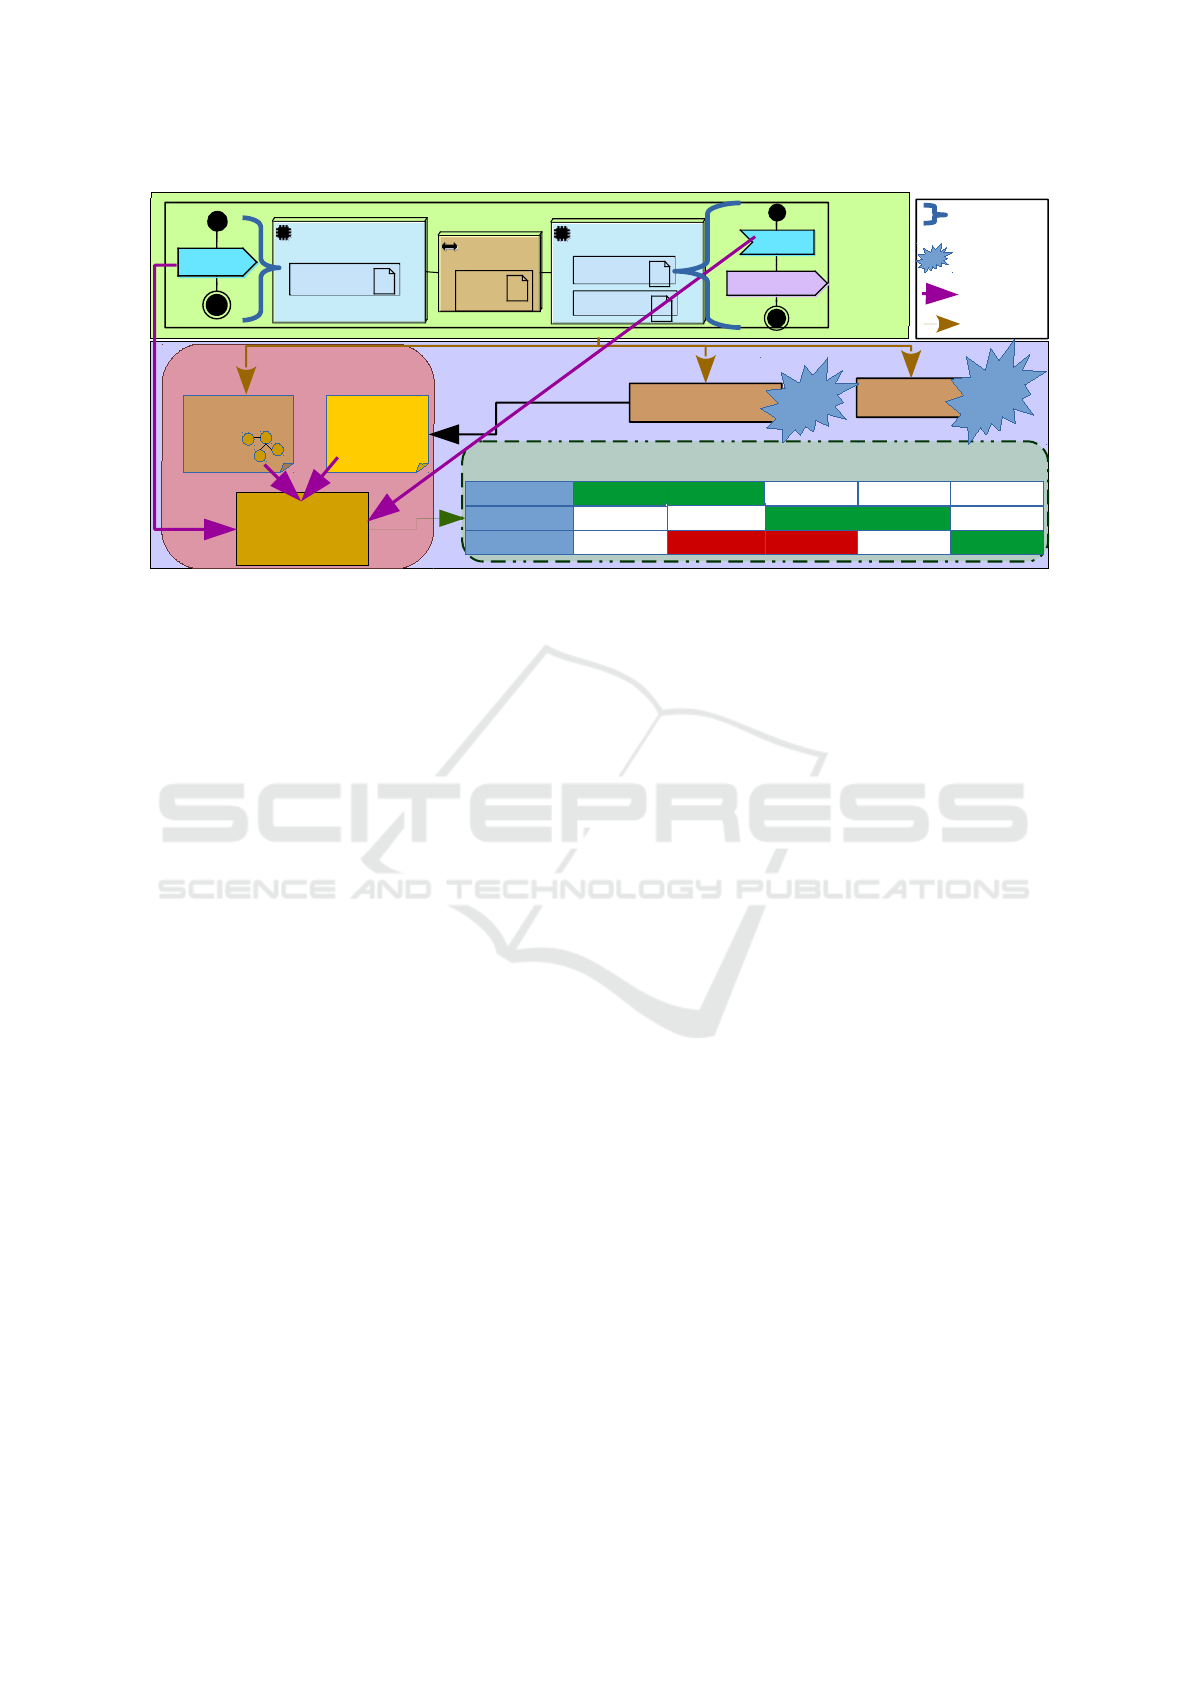
Due to limited space, Figure 4 shows only
Client_App and Server_Control_App applications and
details the activity diagrams of only one task of each:
Update_MotorData and ReceiveMotorSD_Control,
shown on the left and right in Figure 4 where start and
stop operators are colored black, request operators are
in brown, event operators are in purple and action op-
MOTOR_CONTROL_APP
CLIENT
APP
M
O
T
O
R
SERVER_
CONTROL_
APP
MAIN_LOOP
MOTOR_
CONTROL
_POWER
Speed/Direction
Voltage
Position/Current
PWM
Figure 3: Case Study Overview.
erators are in green. The functional tasks in Figure
4 are mapped on the architecture shown in Figure 5,
with two CPUs (blue) and two memories (green) con-
nected by buses (brown) and bridges (orange).
5.2 System Verification
A simulation trace showing the latency between send-
ing a new input in the Client_App (our operator "A"
i.e. θ
A
) and receiving this input in Main_Loop (op-
erator "B" i.e. θ
B
) is computed. The Latency Anal-
ysis tool of TTool takes as input this trace, the two
operators (θ
A
,θ
B
), and the model so as to generate
the latency graph. The latency graph of Receive-
MotorSD_Control is given in Figure 6. The dot-
ted edges in Figure 6 are logical dependency edges
from/towards vertexes that are not shown in the graph.
The latency detailed analysis shows that the time be-
tween θ
A
and θ
B
is 273 cycles. Figure 7 displays
the detailed latency of the simulation trace. As men-
tioned earlier, the green colored cells in Figure 7 are
the transactions corresponding to nodes (node
θ
) that
are on the path from to θ
B
, while those colored red
are transactions not on the path but executed on the
same hardware as θ
A
or θ
B
and might add delay due
to scheduling.
To prove that the confidentiality requirement be-
tween Client_App and Server_Control_App is satis-
fied, TTool relies on ProVerif. In a first verification
run the proof fails (as indicated by the crossed red
lock in Figure 4). To address confidentiality, encryp-
tion/decryption operators are added as described in
(Li, 2018). We chose the AES algorithm and set the
computational complexity to 3000 as indicated in (Fu-
jdiak et al., 2019). The verification now outputs a
green lock in Figure 4: confidentiality is satisfied.
The latency detailed analysis for the secure model
tells us that the time between θ
A
and θ
B
is now 6301
cycles. Figure 8 shows that the transactions that were
executed during this delay start differing from the non
secure model at cycle 11 where the encryption proce-
dure starts. Studying the two latency detailed analysis
figures allows us to conclude that the increase in time
between the secure and non secure model is due to
the added encryption/decryption. Moreover, the la-
tency detailed analysis helps us to understand when
the encryption/decryption started/ended and how did
MODELSWARD 2020 - 8th International Conference on Model-Driven Engineering and Software Development
378
Server_Control_Application
receivesMotorSD_Data
S
W
receivesMotorSD_Control
Client_Application
checkNewIput
send_MotorData
Update_MotorData
evt
sendCommand(time)
req
MotorSDData1(time)
evt
checkCommand(time)
Loop for ever
req
newData(data)
evt
sendCommand1(time)
data=8
time=100
set_updateFlag=false
getReqArg (set_updateFlag)
[]
[else]
[set_updateFlag]
Figure 4: Functional View.
<<BUS-RR>>
Bus0
FV::sendCommandData
channel
<<BRIDGE>>
App_to_ControlBoard
FV::sendCommandData
channel
<<CPURR>>
CPU0
FV::receivesMotorSD_Control
FV::receivesMotorSD_Data
<<CPURR>>
CPU_Application
FV::send_MotorData
FV::Update_MotorData
FV::checkNewIput
<<MEMORY>>
App_Mem
<<BUS-RR>>
Bus1
FV::sendCommandData
channel
<<MEMORY>>
Memory
Figure 5: Mapping View.
sendCommand(time)
CPU0
receivesMotorSD_Control
start
Loop for ever
wait event: sendCommand(time)
send request: MotorSDData(time)
checkCommand(time)
stop state
Send
Request
send
Event
Figure 6: Excerpt of the Latency Graph.
it effect the scheduling of tasks.
In case the latency violated safety or performance
requirements, the system designer can either add
hardware accelerators for encryption/decryption, or
more powerful processing units, or use other security
algorithms, or try a different mapping, or finally ad-
just the scheduling policy of a CPU.
6 CONCLUSION AND
PERSPECTIVES
The semi-automated performance analysis technique
introduced in this paper allows system designers to
study the trade-off between security and performance
at high level of abstraction. To do so, simulation
traces are analyzed based on a generated directed
graph that corresponds to the model under investiga-
tion.
This work was integrated in SysML-Sec and
TTool. A use case from the AQUAS H2020 project
was used to highlight the advantages of knowing the
transactions causing delays between two operators.
The presented approach could probably be ex-
tended to also cover safety aspects in a combined
safety/security/performance holistic co-analysis. This
extension will be the objective of future works
ACKNOWLEDGEMENTS
The AQUAS project is funded by ECSEL JU under
grant agreement No 737475
REFERENCES
(2013). Aggregated quality assurance for systems (aquas).
https://aquas-project.eu. Accessed: 2019-09-24.
Apvrille, L. (2013). TTool. https://ttool.telecom-paris.fr.
Accessed: 2019-09-24.
Apvrille, L. and Li, L. W. (2019). Harmonizing safety,
security and performance requirements in embedded
systems. In Design, Automation and Test in Europe
(DATE’2019), Florence, Italy.
Apvrille, L. and Roudier, Y. (2013). SysML-Sec: A SysML
environment for the design and development of secure
Impact of Security Measures on Performance Aspects in SysML Models
379
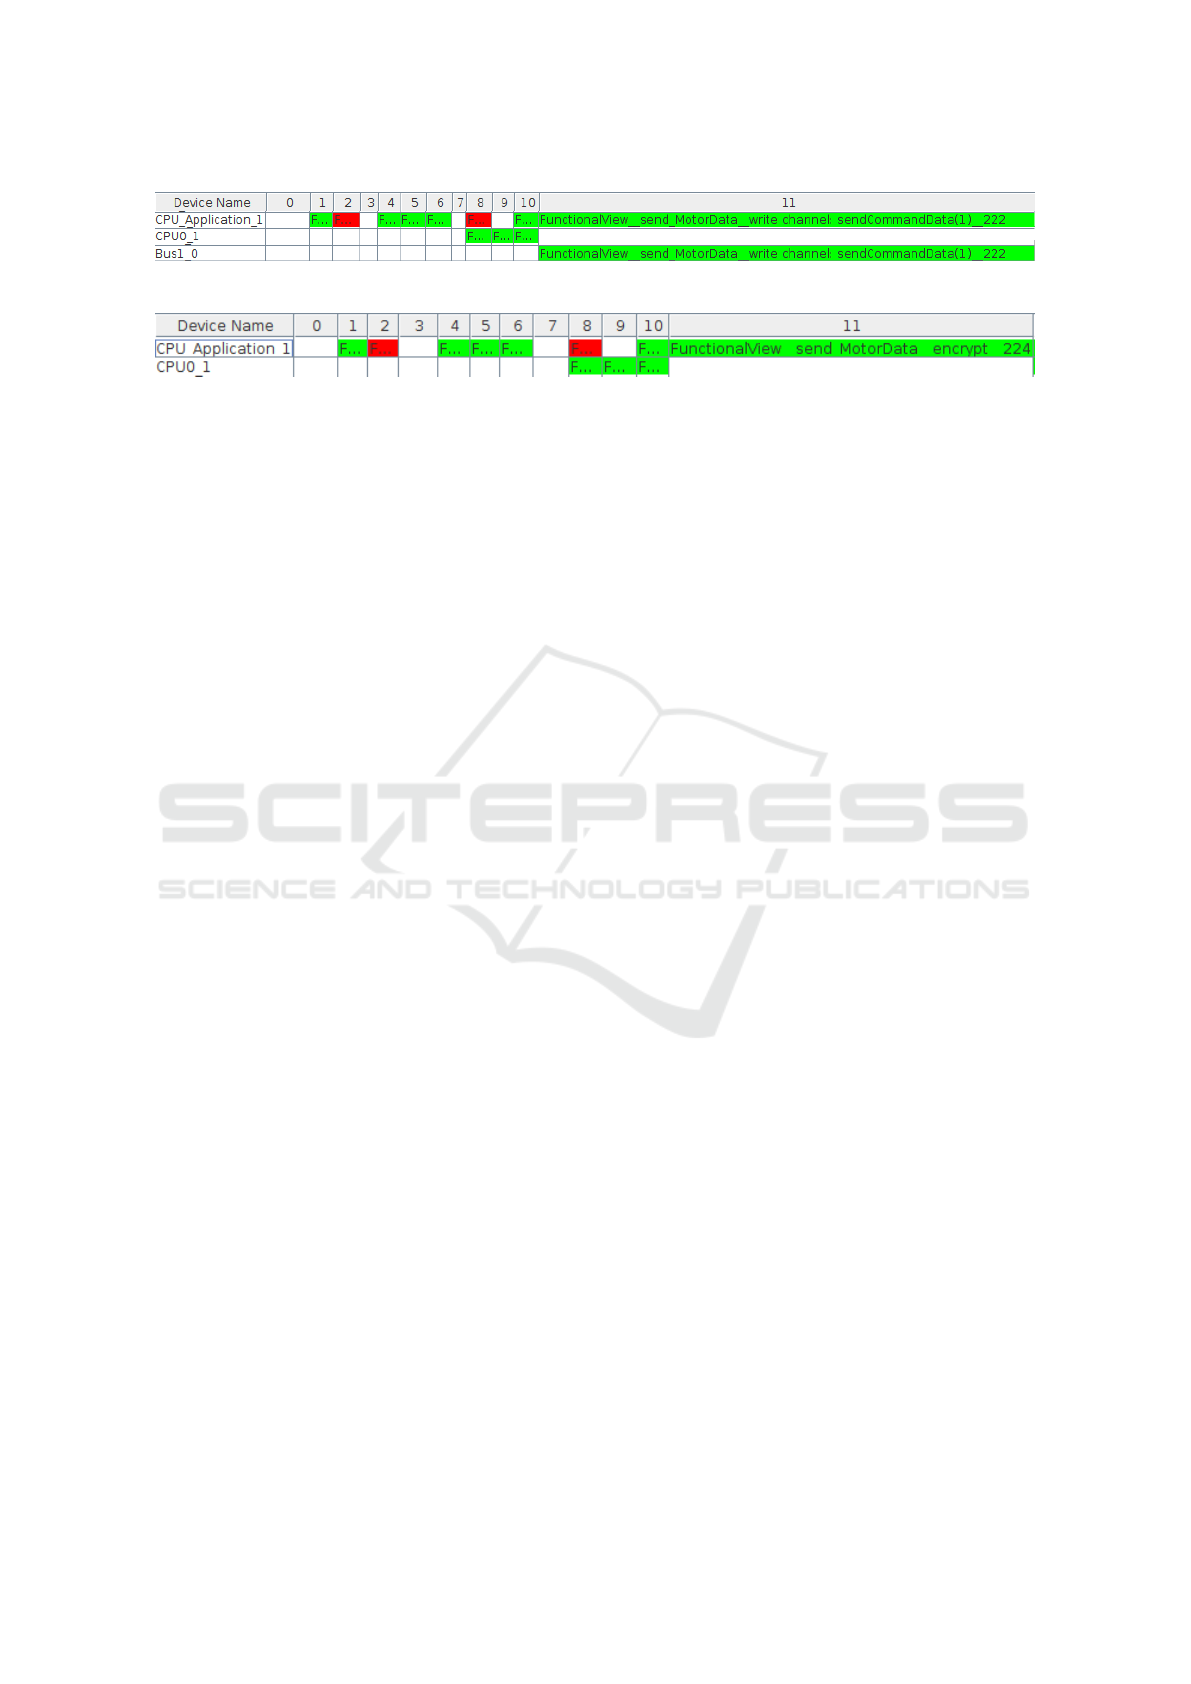
Figure 7: Detailed Latency between θ
A
and θ
B
.
Figure 8: Detailed Latency between θ
A
and θ
B
in Secure Model.
embedded systems. APCOSEC, Asia-Pacific Council
on Systems Engineering, pages 8–11.
Blanchet, B., Smyth, B., Cheval, V., and Sylvestre, M.
(2018). Proverif 2.00: Automatic cryptographic pro-
tocol verifier, user manual and tutorial. Version from,
pages 05–16.
Chai, H., Zhang, G., Zhou, J., Sun, J., Huang, L., and Wang,
T. (2019). A short review of security-aware techniques
in real-time embedded systems. Journal of Circuits,
Systems and Computers, 28(02):1930002.
Davis, R. I. (2014). A review of fixed priority and edf
scheduling for hard real-time uniprocessor systems.
ACM SIGBED Review, 11(1):8–19.
DeAntoni, J. and Mallet, F. (2012). Timesquare: Treat your
models with logical time. In International Conference
on Modelling Techniques and Tools for Computer Per-
formance Evaluation, pages 34–41. Springer.
Friedenthal, S., Moore, A., and Steiner, R. (2014). A prac-
tical guide to SysML: the systems modeling language.
Morgan Kaufmann.
Fujdiak, R., Blazek, P., Apvrille, L., Martinasek, Z.,
Mlynek, P., Pacalet, R., Smekal, D., Mrnustik, P.,
Barabas, M., and Zoor, M. (2019). Modeling the
trade-off between security and performance to sup-
port the product life cycle. In 2019 8th Mediterranean
Conference on Embedded Computing (MECO), pages
1–6. IEEE.
Fujdiak, R., Mlynek, P., Blazek, P., Barabas, M., and Mr-
nustik, P. (2018). Seeking the relation between per-
formance and security in modern systems: Metrics
and measures. In 2018 41st International Conference
on Telecommunications and Signal Processing (TSP),
pages 1–5. IEEE.
Gruber, T., Schmittner, C., Matschnig, M., and Fischer, B.
(2018). Co-engineering-in-the-loop. In International
Conference on Computer Safety, Reliability, and Se-
curity, pages 151–163. Springer.
Jiang, W., Guo, Z., Ma, Y., and Sang, N. (2013).
Measurement-based research on cryptographic algo-
rithms for embedded real-time systems. Journal of
Systems Architecture, 59(10):1394–1404.
Kangas, T., Kukkala, P., Orsila, H., Salminen, E., Hännikäi-
nen, M., Hämäläinen, T. D., Riihimäki, J., and Ku-
usilinna, K. (2006). Uml-based multiprocessor soc
design framework. ACM Transactions on Embedded
Computing Systems (TECS), 5(2):281–320.
Kienhuis, B., Deprettere, E. F., Van der Wolf, P., and
Vissers, K. (2001). A methodology to design pro-
grammable embedded systems. In International
Workshop on Embedded Computer Systems, pages
18–37. Springer.
Knorreck, D. (2011). UML-based design space exploration,
fast simulation and static analysis. PhD thesis, Tele-
com ParisTech.
Kocher, P., Lee, R., McGraw, G., Raghunathan, A.,
Moderator-Ravi, S., and Moderator-Ravi, S. (2004).
Security as a new dimension in embedded system de-
sign. In Proceedings of the 41st annual Design Au-
tomation Conference, pages 753–760. ACM.
Li, L. (2018). Approche orientée modèles pour la sûreté et
la sécurité des systèmes embarqués. PhD thesis, Paris
Saclay.
Li, L. W., Lugou, F., and Apvrille, L. (2017). Security-
aware modeling and analysis for hw/sw partitioning.
In 5th International Conference on Model-Driven En-
gineering and Software Development (Modelsward),
Porto, Portugal.
Thiele, L., Wandeler, E., and Haid, W. (2007). Performance
analysis of distributed embedded systems. In Interna-
tional Conference On Embedded Software: Proceed-
ings of the 7 th ACM & IEEE international conference
on Embedded software, volume 30, pages 10–10. Cite-
seer.
Viehl, A., Schönwald, T., Bringmann, O., and Rosenstiel,
W. (2006). Formal performance analysis and simu-
lation of uml/sysml models for esl design. In Pro-
ceedings of the conference on Design, automation and
test in Europe: Proceedings, pages 242–247. Euro-
pean Design and Automation Association.
MODELSWARD 2020 - 8th International Conference on Model-Driven Engineering and Software Development
380
