
Real-time Sign Detection and Recognition for Self-driving Mini Rovers
based on Template Matching and Hierarchical Decision Structure
Quang Nhat Nguyen Le, Abir Bhattacharyya, Mamen Thomas Chembakasseril and Ronny Hartanto
Faculty of Technology and Bionics, Rhine-Waal University of Applied Sciences, Kleve, Germany
Keywords:
Real-time Traffic Sign Detection and Recognition, Computer Vision, Autonomous Systems, Mini-rovers.
Abstract:
Sign detection and recognition play vital roles in the field of self-driving vehicles. The aim of this paper is to
introduce a real-time methodology that can be implemented on affordable single-board computers to classify
varied traffic signs from the camera feed. The approach is to detect and recognise the colour and shape of
the signs at first, then use the acquired information to access a hierarchy structure of the database in order
to extract features of pre-existing templates. Finally, the template matching algorithm is applied to compare
those features with potential Region Of Interest (ROI) based on a threshold value. We installed our system on a
mini rover and tested it on a control urban traffic scenario. The measurements showed processing time ranging
from 230ms to 800ms and 480ms to 1900ms on Jetson Nano and Raspberry Pi 3 Model B+ respectively.
1 INTRODUCTION
Two of the most essential skills for drivers who com-
mute on the roads are traffic signs detection and
recognition. Traffic signs provide information regard-
ing the state of the road (city road, urban road, pri-
ority road, etc.) or indicate the proper behaviours to
drivers and pedestrians (drive slowly, give way, stop,
yield, etc.). While human drivers can perform consid-
erably well those tasks, the accuracy of their decisions
can be affected by many subjective/objective factors
such as physical condition (e.g. tired, drug effect, bad
mood, etc.), environment conditions (snow, rain, ex-
treme illumination, etc.) (Fletcher et al., 2003). In
addition, self-driving vehicles have generated signif-
icant research interest in the last few years as a solu-
tion to resolve traffic congestion, traffic emission as
well as enhance safety and efficiency in daily com-
mute and logistic(Dobrev et al., 2017). Nevertheless,
few researchers have addressed the problem of traf-
fic sign detection and recognition in self-driving vehi-
cles and the analysis of adapting those methods in the
dynamic of physical vehicles. Therefore, the require-
ment of a real-time and reliable tool for sign detection
and recognition is critically crucial.
The motivation of this paper is to develop an au-
tonomous self-driving mini rover for the autonomous
vehicle traffic competition – JRC AUTOTRAC 2020:
How the future road transport will look like? (Catta-
neo, 2019). In this competition, there would be an
urban simulation scenario in which the rover must
follow the instruction of traffic signs but still main-
tain the correct paths and avoid crashes with other
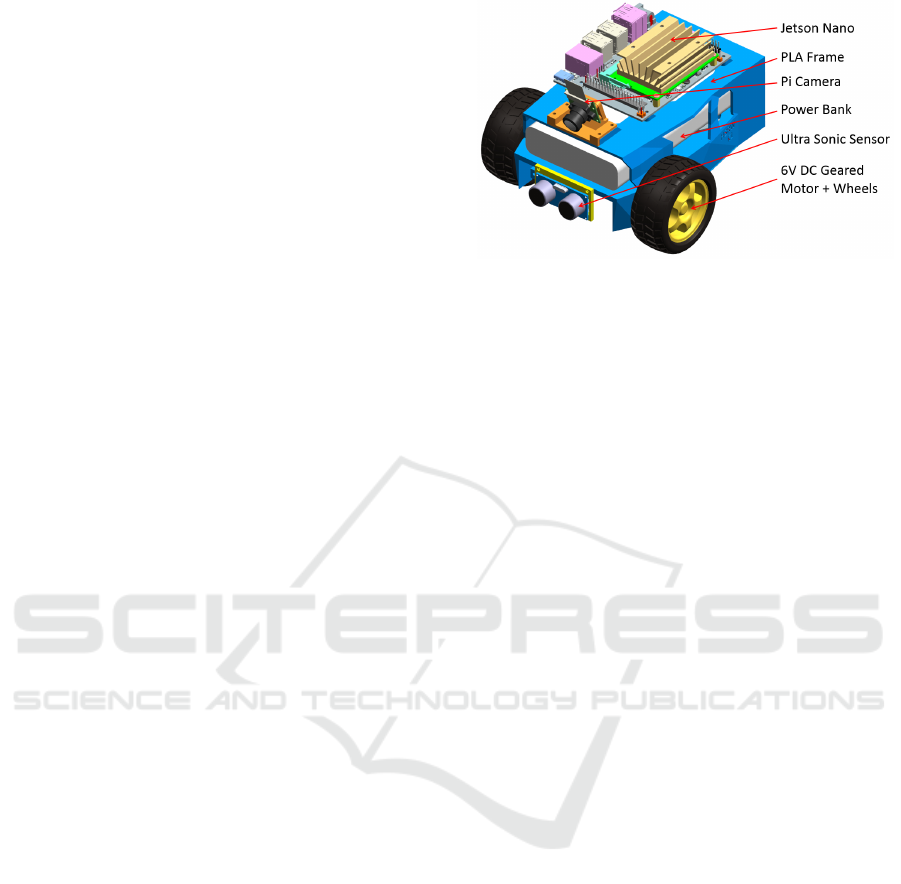
rovers. The rover should not exceed the dimension
of 150x200x200mm and weight of 2kg. (Fig. 1).
Several approaches regarding traffic sign detec-
tion and recognition were illustrated in the last decade
such as Support Vector Machine (SVM) (Maldonado-
Bascon et al., 2007) (Greenhalgh and Mirmehdi,
2012), Neural Networks (NNs) (Chiung-Yao Fang
et al., 2003), You Only Look Once (YOLO) (Zhang
et al., 2017), Template matching base on priori knowl-
edge(Piccioli et al., 1996). State of the art meth-
ods including Machine Learning (SVM, NNs, YOLO,
etc.) have demonstrated their outstanding perfor-
mance, however, they either require a bulky stationery
processing unit or might be problematic in real-time
application (Chen et al., 2014). Due to the fact that
our robot - Hammy is a small mobile rover which
travels in scale model of control urban environment,
plus there are a limited number of traffic signs need
to be classified in the competition, we developed a
system which did not demand excessive computation
and was able to perform adequately on common em-
bedded systems such as Jetson Nano and Raspberry
Pi 3 Model B+.
In this paper, a system for traffic sign detection
and recognition based mainly on template matching
and other techniques of Computer Vision is intro-
duced. Later, experiments of this system on Hammy
208
Le, Q., Bhattacharyya, A., Chembakasseril, M. and Hartanto, R.
Real-time Sign Detection and Recognition for Self-driving Mini Rovers based on Template Matching and Hierarchical Decision Structure.
DOI: 10.5220/0008969702080215
In Proceedings of the 12th International Conference on Agents and Artificial Intelligence (ICAART 2020) - Volume 1, pages 208-215
ISBN: 978-989-758-395-7; ISSN: 2184-433X
Copyright
c
2022 by SCITEPRESS – Science and Technology Publications, Lda. All rights reserved
among different control urban environments are dis-
cussed.
2 SYSTEM ARCHITECTURE
One of the priorities of Hammy is the ability to self-
drive and behave associating with traffic signs, lanes
and other objects on the roads. For this reason, the
rover requires an engine unit to deliver torque; a con-
trol unit to process data from sensing system and per-
form computations; and a portable power source.
As for the engine unit, the 2 common selections
are combustion engine and electric motor. The first
one can provide greatly high torque but can be con-
siderably heavy and bulky. Furthermore, combustion
engine is also noisy, difficult to control and requires a
large transmission unit to deliver the torque. Electric
motor does not generate as high torque as combustion
engine but has a much smaller weight. It is also eas-
ier to control and more environmentally friendly com-
pared to combustion engine. Because the purpose of
this paper is to develop a reliable solution and algo-
rithm for self-driving scaled-model vehicles, experi-
ments would be conducted in small scale and labora-
tory tracks. Therefore, 2 DC motors equipped with
gearboxes were selected which would drive 2 wheels
separately.
The sensing system consists of an Ultrasonic
Sensor HC-SR04, 2 Reflective Infrared IR Optical
Sensors (Optional) and a Camera Raspberry Pi V2.
Hammy would depend mainly on the data from the
camera to adjust its motor speed as well as steer-
ing angle. It should be noticed that humans use
only biological vision without the need of any dis-
tance/infrared/LIDAR (Light Detection and Ranging)
sensors, but still can perform very precisely driv-
ing task. Hence, self-driving algorithm of Hammy
was developed principally focused on computer vi-
sion with the reference of data from external sensors
in an attempt to improve the accuracy of the decision.
Hammy requires a portable but adequate process-
ing unit in order to compute data from the camera and
sensors. In our experiment, Jetson Nano - a small but
powerful computer was selected. Later, a less power-
ful but more affordable single-board computer: Rasp-
berry Pi 3 Model B+ was experimented.
Generally, when Hammy approaches to a poten-
tial traffic sign, it firstly tries to detect and recognise
the colour and contour of the sign through its camera.
The closer it reaches to sign, the larger of colour area
it detects. If this area exceeds a defined threshold,
the rover will slow down/stop and try to recognize the
sign from the ROI using template matching. Since
Figure 1: CAD design of Hammy.
traffic sign usually follows a size standard, ROI can
be defined utilizing the center of colour area as well
as the sign’s width and length. If the confidence of
classification is satisfactory, Hammy will act regard-
ing the indication of the sign. Fig. 2 demonstrates the
software architecture of our system.
3 METHODOLOGY
3.1 Camera Calibration
Distortion and bad representative colour are common
flaws when capturing images from cameras. Those
flaws can generate disturbing effects on the input im-
ages (e.g. straight-line turns to curved line, incorrect
colour level) and deteriorate noticeably the perfor-
mance of Hammy in detecting and recognizing traffic
signs. In an attempt to avoid those unfavourable el-
ements, it is necessary to perform camera and colour
calibration before conducting further steps.
The most common method for camera calibration
is to utilize a planar pattern which contains at least
two distinguishable dimensions (Zhang, 2000). In
this paper, a chess board frame was used as the ref-
erence pattern for Hammy’s camera calibration.
According to (Zhang, 2000), considering (x
i
, y
i
)
and (x, y) are respectively processed distortion-free
coordinates and real distorted coordinates, the distor-
tion effect can be solved as below:
x
i
= x + x
h
k
1
(x
2
+ y
2
) + k
2
(x
2
+ y
2
)
2
i
y
i
= y + y
h
k
1
(x
2
+ y
2
) + k
2
(x
2
+ y
2
)
2
i
(1)
in which k
1
and k
2
are the radial distortion coeffi-
cients. OpenCV library (Bradski, 2000) was adopted
to extracts radial distortion coefficients from sample
images.
Real-time Sign Detection and Recognition for Self-driving Mini Rovers based on Template Matching and Hierarchical Decision Structure
209
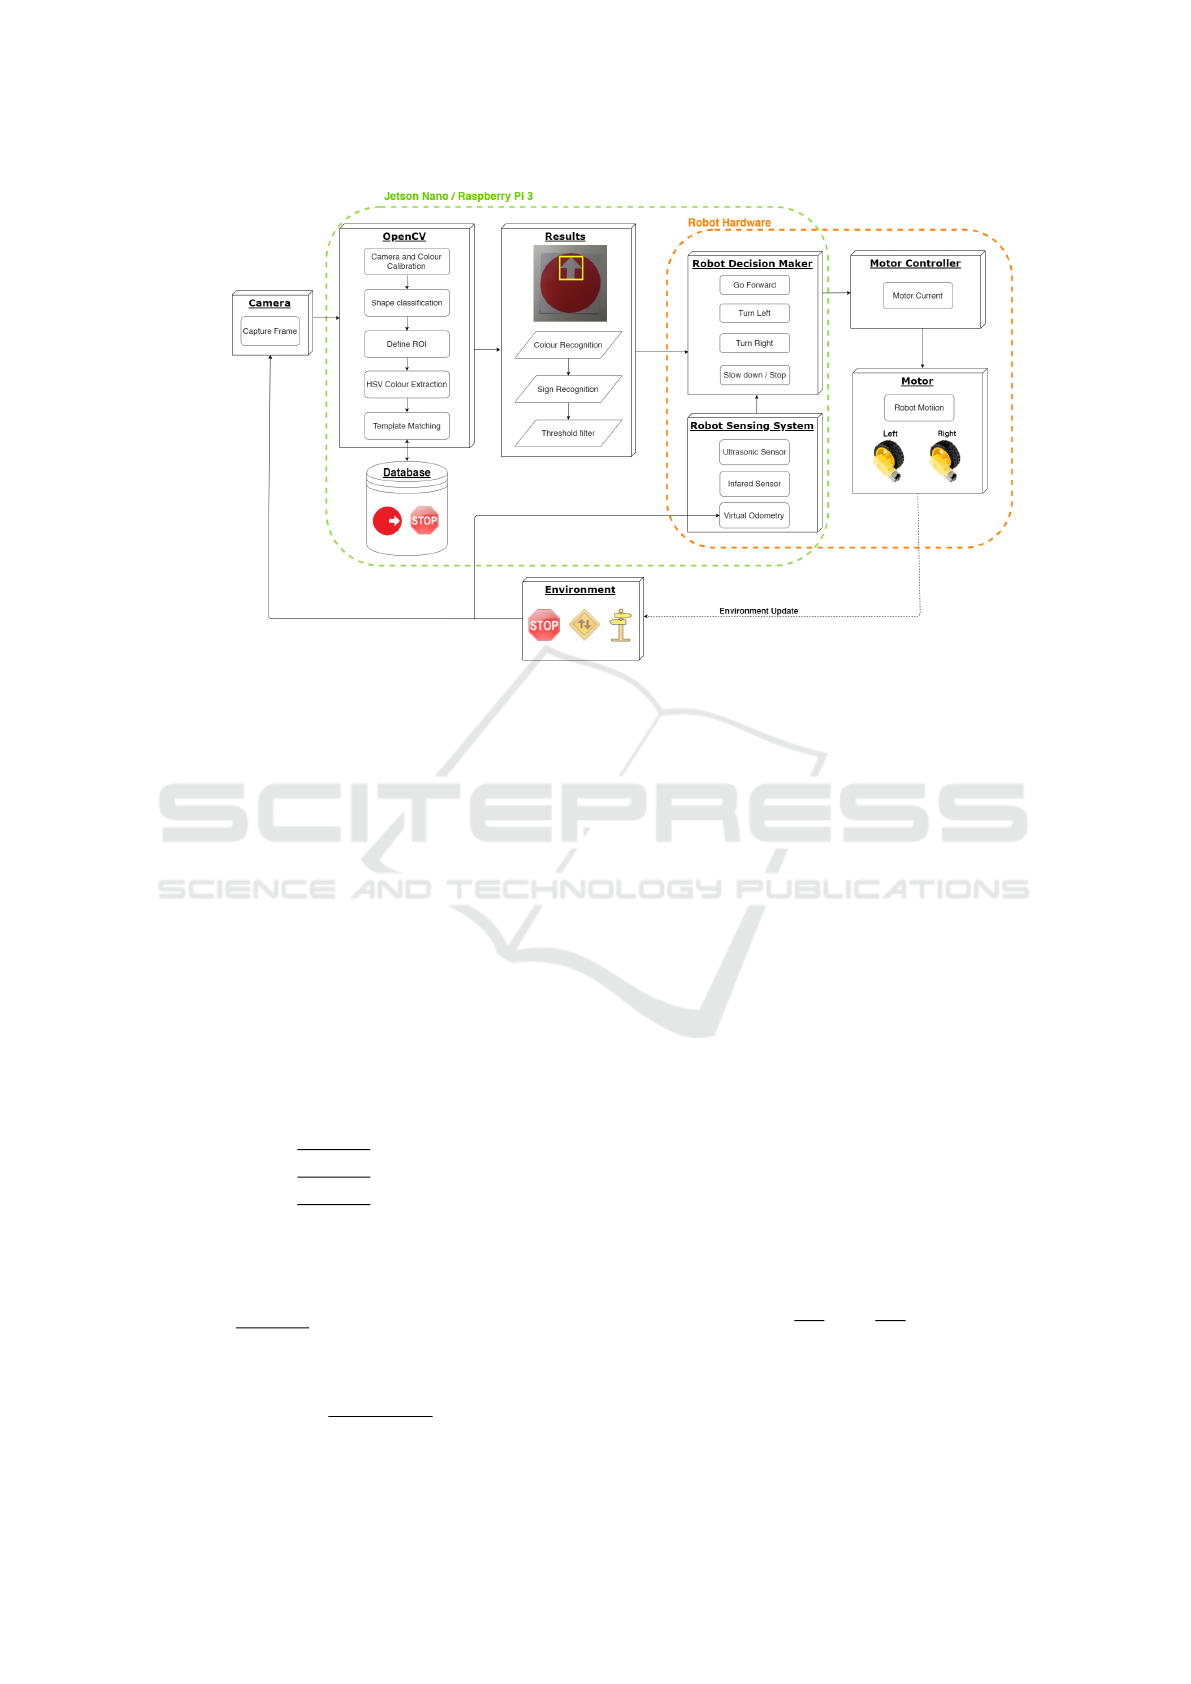
Figure 2: Schematic of the Hammy software architecture.
In several circumstances, the illumination of ex-
ternal environment and affect unfavourably to the
recognition ability of Hammy. For instance, high in-
tensity of light can cause the rover mistaking between
”red” and ”pink”. Hammy can avoid that by conduct-
ing colour calibration based on HSV(Hue, Saturation,
Value) colour space to classify different colours. It
was proved that HSV is able to classify colours bet-
ter than both CIELAB and RGB (Reg, Green, Blue)
colour space (Paschos, 2001). Basic colours includ-
ing Red, Yellow, Green, Blue can be converted from
RGB to HSV by below equations(Saravanan, 2010):
With value of RGB in range [0,1]:
H :=
0, if MAX = MIN
⇔ R = G = B
60 ·
0 +
G−B
MAX−MIN
, if MAX = R
60 ·
2 +
B−R
MAX−MIN
, if MAX = G
60 ·
4 +
R−G
MAX−MIN
, if MAX = B
(2)
if H < 0 then H := H + 360
S
HSV
:=
(
0, if MAX = 0 ⇔ R = G = B = 0
MAX−MIN
MAX
, otherwise
(3)
V := MAX (4)
L :=
MAX +MIN
2
(5)
3.2 Sign Detection
The process of sign detection contains two steps:
colour contour detection and shape detection. In order
to extract the colour contour of the sign, a state of the
art contour detector technique integrating both local
and global cues was utilized (Maire et al., 2008). This
technique was claimed to deliver best performance
on the Berkeley Segmentation Dataset benchmark in
2008. Hammy would reduce the level of noise by
Gaussian Blur(Nixon and Aguado, 2012) before ac-
tivating contour detector on HSV colour space of the
frame. A pre-defined range was adapted to prevent
the system from wasting its resources on detecting un-
wanted colours. The center of colour contour must be
specified so that our system can perceive the ROI and
concentrate on it. This could be done by calculating
the central moment (m
i j
) and extrapolating the central
coordinates from it (Yang and Albregtsen, 1996):
mu
ji
=
∑
x,y
(array(x, y) · (x − x
0
)
j
· (y − y
0
)
i
(6)
where (x
0
, y
0
) is the mass center:
x
0
=
m
10
m
00
;y
0
=
m
01
m
00
(7)
To classify the shape of a traffic sign, the captured
frame was converted to grayscale(Saravanan, 2010)
in an attempt to optimize resource utilization. Canny
Edge detection (Canny, 1986) was implemented to
ICAART 2020 - 12th International Conference on Agents and Artificial Intelligence
210
highlight the captured sign contour. Subsequently, the
Douglas - Peucker algorithm was integrated to count
the numbers of vertices from the traffic sign’s con-
tour extraction. This algorithm would convert a curve
created by multiple line segments into a similar curve
with fewer vertices (Prasad et al., 2012). Therefore
the shape of a traffic sign can be determined by count-
ing the number of total vertices. With numbers of ver-
tices equal to three, four and five the shape will be
triangle, square/rectangle, and pentagon respectively.
In case the numbers of vertices are considerably large,
the shape would be assigned as circle (a circle is com-
posed of vast numbers of line vertices).
3.3 Sign Recognition
In an attempt to interpret the sign, Hammy would
access the pre-existing database associating to infor-
mation extracted from the colour and shape of the
traffic sign and execute template matching algorithm
(Pereira and Pun, 2000). The database should contain
images of traffic sign in which users want Hammy to
recognize. The template T slides over the original Im-
age I and gives a resultant matrix R which contains
the pixel locations in terms of (x, y) where the pixels
matched. If there are no pixels detected this matrix
R would be null. In terms of visualisation, the ma-
trix R is basically a black image except for the region
where it matched, which would then be represented as
a bright spot. If the same template may appear mul-
tiple times the image would then have multiple bright
spots on the same dark image.
OpenCV library (Bradski, 2000) provides several
equations to calculate the region where features of a
template are matched. These equations perform the
appropriate function between the template T and the
original image I, which returns either the minimum or
the maximum values based on the equation chosen.
In this experiment the normalised coefficient correla-
tion was used given by the equation below (Goshtasby
et al., 1984):
R(x, y) =
∑
x
0
,y
0
(T
0
(x
0
, y
0
) · I
0
(x + x
0
, y + y
0
))
q
∑
x
0
,y
0
T
0
(x
0
, y
0
)
2
·
∑
x
0
,y
0
I
0
(x + x
0
, y + y
0
)
2
(8)
The resultant matrix in this case is of the shape of
the original image with a value between 0 and 1 in
each pixel position. A threshold is then used to de-
termine the pattern location of the matching position.
The higher of the threshold, the higher accuracy re-
quired for the template to match the captured images.
4 EXPERIMENTS AND RESULT
The frame of Hammy was designed with CAD soft-
ware and then fabricated with 3D printer. A recharge-
able 5V-2A power bank with storage of 20,000 mAh
is mounted inside the frame. During experiments with
all processing unit, motors and sensors operating con-
tinuously, Hammy could last up to 5-6 hours. The op-
erating duration can be extended by replacing Jetson
Nano with Raspberry Pi 3, yet the difference was in-
significant. Hammy weighs approximately 1kg and
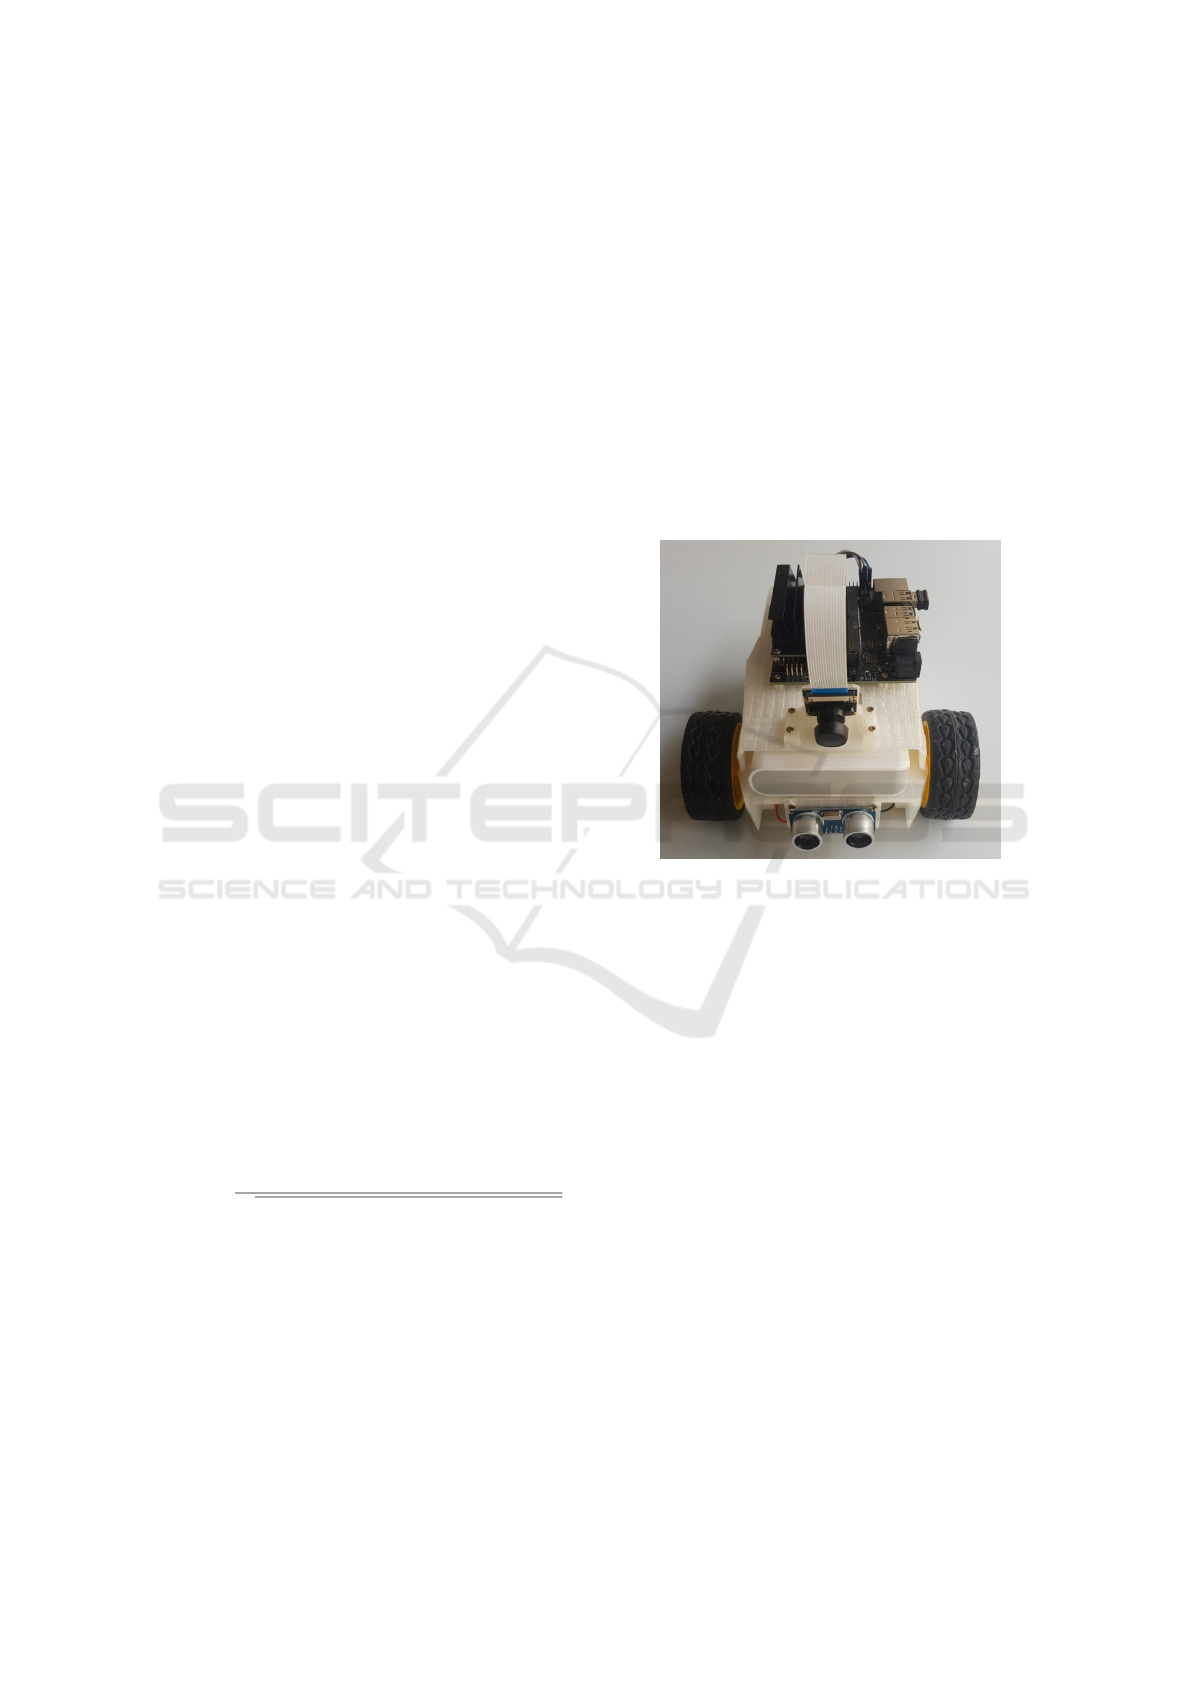
has the dimension of 140x190x120mm. Fig. 3 illus-
trates the physical prototype of Hammy which was
conducted in our research.
Figure 3: Prototype of Hammy.
To evaluate the performance of our algorithm, an
urban scenario consisting of Hammy and a traffic sign
stationed along the road was constructed (Fig. 4). The
system was installed on both Jetson Nano and Rasp-
berry Pi 3 Model B+ and tested in different lighting
conditions: lack of illumination (dark - 2 Lux), natu-
ral illumination with daylight (ambient - 64 Lux) and
indoor illumination with artificial light (lighted - 197
Lux). An experiment is considered successful when
the rover stops before the sign and behaves accord-
ingly to the indication demonstrated by traffic sign.
From recorded data, the temporal performance, as
well as the responsiveness of our system, were evalu-
ated.
4.1 Accuracy Performance
As mentioned in the methodology section, our sys-
tem depends heavily on the colour contour extraction
and shape recognition. One of those processes that
does not function properly will lead to the break of
the whole system. We tested our system on a set of
200 image samples similar to Fig. 5 and recorded
Real-time Sign Detection and Recognition for Self-driving Mini Rovers based on Template Matching and Hierarchical Decision Structure
211
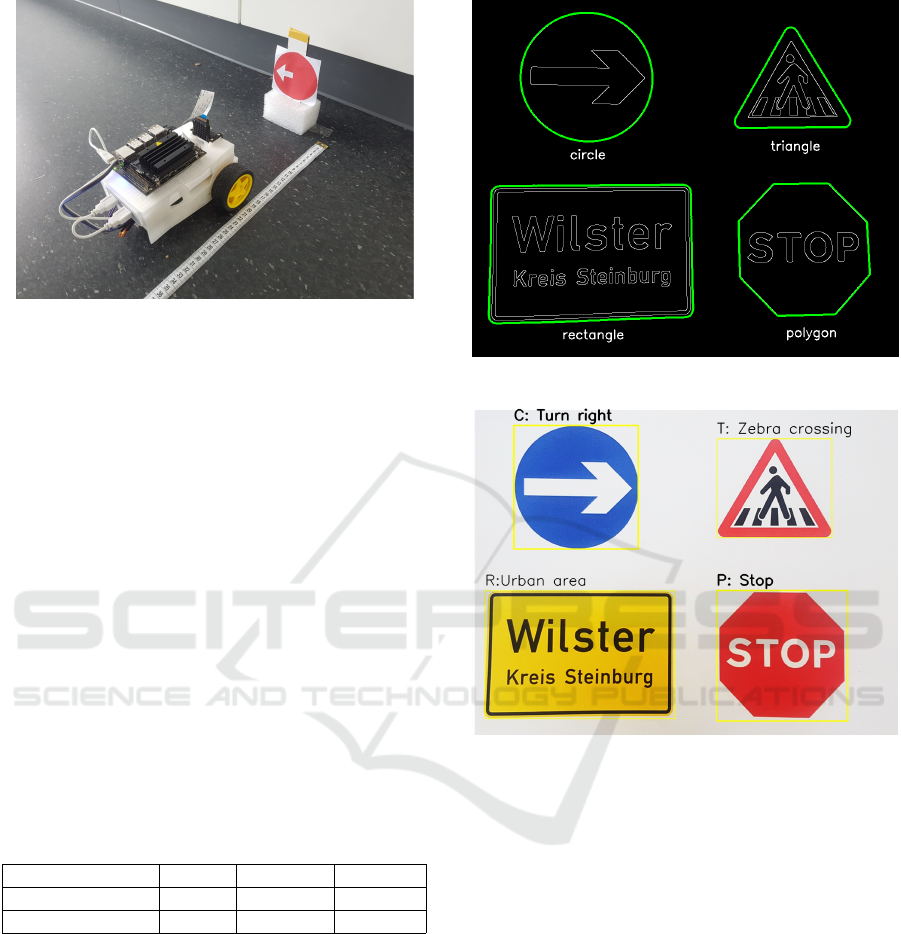
Figure 4: Testing the temporal performance and system re-
sponsiveness on Hammy.
the certainty of our system on Table 1. The result
illustrates that while the accuracy of sign detection
was relatively high (around 90%), this value on sign
recognition was noticeably lower as less than 81%,
especially in dark condition. Fortunately, our sys-
tem architecture does not depend on a single data to
deliver the decision. Conventional cameras usually
record 24 frames per second, which means in one sec-
ond Hammy can access and predict a collection of
24 images. Obviously, it is not efficient to process
all images in one frame throughout, thus a portion of
each image collection in one second is gathered for
the process. The control unit of Hammy could also be
intervened to orient the visual angle of camera, there-
fore new data can be collected in case previous data is
challenging for decision making. Fig. 5a and Fig. 5b
demonstrates the result after applying sign detection
and sign recognition on an image.
Table 1: Accuracy performance of sign detection and sign
recognition on 200 samples.
Dark Ambient Lighted
Sign detection 87.5% 90.5% 92.5%
Sign recognition 75% 80.5% 80.5%
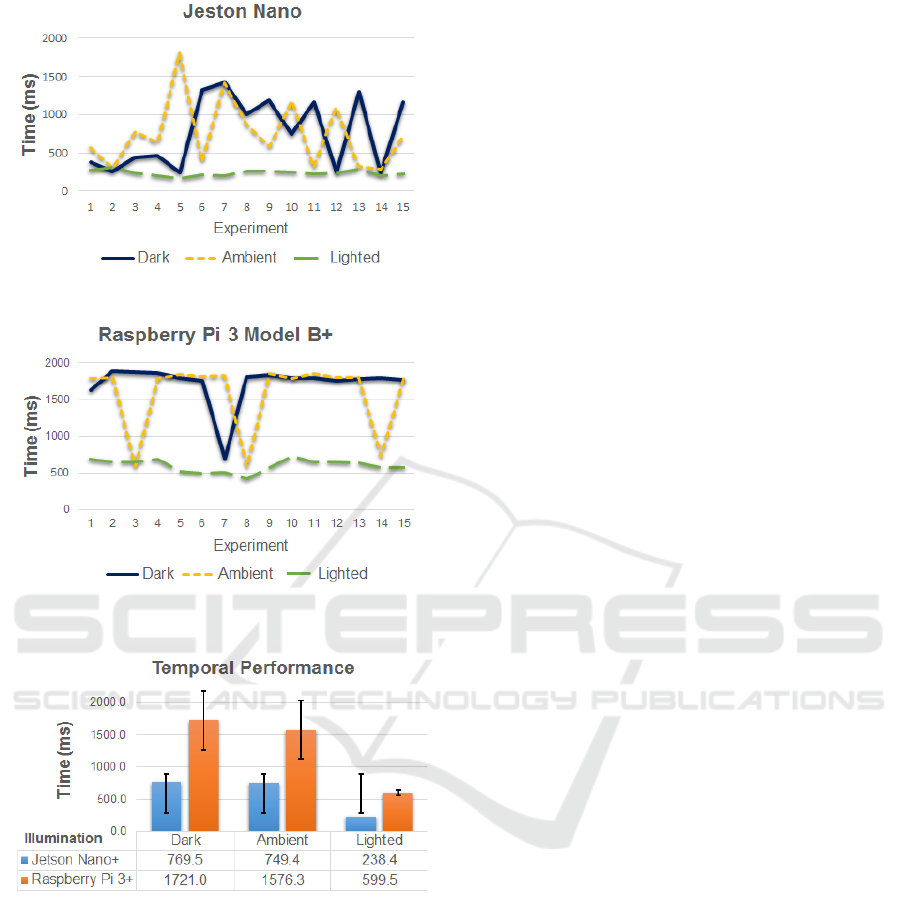
4.2 Temporal Performance
As can be seen in Fig. 2, Hammy perceives the fi-
nal result of traffic sign through consecutive steps:
Colour recognition, Sign recognition and Threshold
filter. To measure the temporal performance of our
algorithm, a python module called timer was imple-
mented with a starting point and a end point set before
the first step and after the last step respectively. The
results are summarised in Fig. 6.
It is evident that the algorithm achieved the best
performance in lighting condition when the process-
(a)
(b)
Figure 5: a) Shape extraction and classification of traffic
signs. b) Template matching following the database’s hier-
archy tree.
ing time fluctuated evenly around 238.4ms on Jetson
Nano and 599.5ms on Raspberry Pi 3 Model B+. The
standard deviation was also the smallest among three
conditions, which indicates the system works most
stable in lighting condition. Meanwhile in dark and
ambient condition, it showed poorer performances as
approximately double on Jetson Nano and triple on
Raspberry Pi 3 . The results indicate that our method
depends heavily on the lighting condition since colour
region and sign edges can contrast better to the back-
ground. In addition, Jetson Nano delivers better per-
formance in comparison to Raspberry Pi 3 thanks to
its integrated 128-core Maxwell GPU, yet this differ-
ence is not significant. With processing time less than
2s for all three conditions, the system performance on
both of them satisfied our requirement in the ability
of real-time operation. Nevertheless, it should be no-
ICAART 2020 - 12th International Conference on Agents and Artificial Intelligence
212
(a)
(b)
Figure 6: a) Temporal performance in three different illu-
minating conditions. b) Comparison of the temporal per-
formance between Jetson Nano and Raspberry Pi 3 Model
B+.
ticed that the system normally breaks if the sign is
affected by external factors (hidden by obstacles, dis-
colouration, deformation, etc) since its features can
not be exposed to fit with the template extracted from
the database. Such problems can be solved by con-
ducting Machine Learning methodologies including
SVM (Greenhalgh and Mirmehdi, 2012) and Neu-
ral Networks (Zhang et al., 2017) (Zhu et al., 2016)
(Eykholt et al., 2017). Those methods was proved to
deliver reliably and precisely the prediction without
the need of collecting all the features from the tem-
plate. Regardless, Machine Learning methods usually
are resource-intensive and require graphic processing
unit (GPU) to increase the speed of their computation.
4.3 System Responsiveness
One of the most important characteristics of self-
driving vehicles is the ability to rapidly respond to ex-
ternal factor in real-time. In this experiment, Hammy
ran on a straight path with 65% maximum velocity
and a turning sign was installed on its route (Fig.
4). As mentioned above, when Hammy approached
closer to the traffic sign it would try to extract the
colour region and the shape of potential traffic signs
from the captured frame. When the confidence of
the colour and shape recognition reached a defined
threshold (calibrated 25cm in front of the traffic sign),
Hammy would stop, access the database and extract
the features of pre-existing templates based on the hi-
erarchy tree. Subsequently, the rover made its deci-
sion by comparing the extricated features with scep-
tical ROI and selecting the best one. Similar to the
temporal performance experiment, we tested Hammy
in three different illuminating condition and plotted
the data as can be seen in Fig. 7.
It can be observed that the stopping distance of
Hammy fluctuates unevenly in the range of 23cm
to 29cm in three lighting conditions. The tolerance
compared to the desired stopping distance (25cm)
is around ±4cm. The average of responsive dis-
tance in dark condition is approximately 26.13cm
while this number in ambient and lighting conditions
are 25.73cm and 25.67cm. The experiment results
show that the lack of illumination might deteriorate
Hammy’s ability to detect and recognise traffic signs.
However, this tolerance is acceptable since the devi-
ation (±4cm) is relatively small and can be compen-
sated by Hammy’s controller.
5 CONCLUSIONS
In the last decade, many researches in the field of
traffic sign detection and recognition have been de-
veloped, still few of them have indicated an effective
real-time solution for self-driving rovers which can be
implemented on small, affordable single-board com-
puters. Therefore, we presented a system for traffic
sign detection and recognition which is cost-effective
and compatible with two of the most popular embed-
ded boards: Jetson Nano and Raspberry Pi. The idea
is to formerly detect and classify colour and shape of
Real-time Sign Detection and Recognition for Self-driving Mini Rovers based on Template Matching and Hierarchical Decision Structure
213
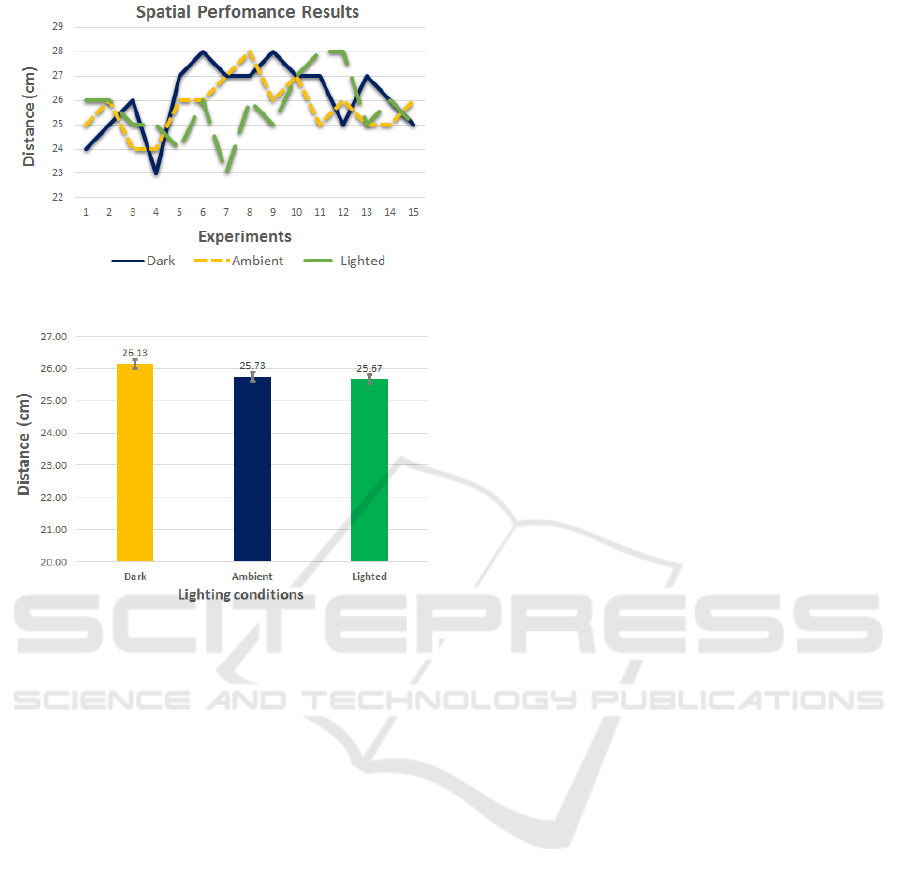
(a)
(b)
Figure 7: a) Spatial performance result among three illumi-
nating conditions. b) Average of spatial performance.
the traffic sign, then use this information as correlated
conditions to go deeper into the database branches
where sign templates are stored. In the next step,
features of all templates are extracted and compared
with ROI from video stream and those which have the
highest similarity will be selected. The advantage of
this methodology is that it consumes a limited amount
of computational power due to the hierarchical struc-
ture of the algorithm. Yet, this system depends heav-
ily on the subtle changes in the external environment
and the sufficiency of the database. For example, the
colour can be misclassified if the real sign discolours
over time, or the system will not able to recognise
shape contour if the sign is hidden by obstacles. The
system shows potential in areas which do not con-
sist of too many appearance-affecting factors such as
hospitals, factories, schools, laboratory, indoor areas,
etc. It can also be implemented as an assisting module
running parallel with other modules on an embedded
system to perform multi-tasks, especially when this
system has limited computational resources.
Future work should focus on algorithms that can
reduce the affection of external environment factors to
the sign detection and recognition process. Additional
sensors can be equipped to improve the accuracy of
decision such as colour sensor or LIDAR (Light De-
tection and Ranging) (Zhou and Deng, 2014).
ACKNOWLEDGEMENTS
This research was supported by Rhine-Waal Univer-
sity of Applied Sciences. We would like to thank
Mr. Frank Kremer and Mr. Freidrich Muhs for as-
sistance with the electronic configuration of Hammy.
We would also like to show our gratitude to HSRW
Fablab Kamp-Linfort, HSRW Robotic Lab for pro-
viding us equipment and assist to develop our re-
search.
REFERENCES
Bradski, G. (2000). The OpenCV Library. Dr. Dobb’s Jour-
nal of Software Tools.
Canny, J. (1986). A computational approach to edge de-
tection. IEEE Transactions on pattern analysis and
machine intelligence, (6):679–698.
Cattaneo, B. (2019). JRC AUTOTRAC 2020 How the fu-
ture road transport will look like ?
Chen, Y., Lin, Z., Zhao, X., Wang, G., and Gu, Y. (2014).
Deep learning-based classification of hyperspectral
data. IEEE Journal of Selected Topics in Applied
Earth Observations and Remote Sensing, 7(6):2094–
2107.
Chiung-Yao Fang, Sei-Wang Chen, and Chiou-Shann Fuh
(2003). Road-sign detection and tracking. IEEE
Transactions on Vehicular Technology, 52(5):1329–
1341.
Dobrev, Y., Vossiek, M., Christmann, M., Bilous, I., and
Gulden, P. (2017). Steady delivery: Wireless local po-
sitioning systems for tracking and autonomous navi-
gation of transport vehicles and mobile robots. IEEE
Microwave Magazine, 18(6):26–37.
Eykholt, K., Evtimov, I., Fernandes, E., Li, B., Rahmati, A.,
Xiao, C., Prakash, A., Kohno, T., and Song, D. (2017).
Robust physical-world attacks on deep learning mod-
els. arXiv preprint arXiv:1707.08945.
Fletcher, L., Apostoloff, N., Petersson, L., and Zelinsky,
A. (2003). Vision in and out of Vehicles. Intelligent
Systems, IEEE, 18:12–17.
Goshtasby, A., Gage, S. H., and Bartholic, J. F. (1984).
A two-stage cross correlation approach to template
matching. IEEE Transactions on Pattern Analysis and
Machine Intelligence, (3):374–378.
Greenhalgh, J. and Mirmehdi, M. (2012). Real-Time De-
tection and Recognition of Road Traffic Signs. IEEE
Transactions on Intelligent Transportation Systems,
13(4):1498–1506.
ICAART 2020 - 12th International Conference on Agents and Artificial Intelligence
214

Maire, M., Arbel
´
aez, P., Fowlkes, C., and Malik, J. (2008).
Using contours to detect and localize junctions in nat-
ural images. In 2008 IEEE Conference on Computer
Vision and Pattern Recognition, pages 1–8. IEEE.
Maldonado-Bascon, S., Lafuente-Arroyo, S., Gil-Jimenez,
P., Gomez-Moreno, H., and Lopez-Ferreras, F. (2007).
Road-Sign Detection and Recognition Based on Sup-
port Vector Machines. IEEE Transactions on Intelli-
gent Transportation Systems, 8(2):264–278.
Nixon, M. and Aguado, A. S. (2012). Feature Extraction
and Image Processing for Computer Vision. Aca-
demic Press.
Paschos, G. (2001). Perceptually uniform color spaces for
color texture analysis: an empirical evaluation. IEEE
Transactions on Image Processing, 10(6):932–937.
Pereira, S. and Pun, T. (2000). Robust template matching
for affine resistant image watermarks. IEEE transac-
tions on image Processing, 9(6):1123–1129.
Piccioli, G., De Micheli, E., Parodi, P., and Campani, M.
(1996). Robust method for road sign detection and
recognition. Image and Vision Computing, 14(3):209–
223.
Prasad, D. K., Leung, M. K., Quek, C., and Cho, S.-Y.
(2012). A novel framework for making dominant
point detection methods non-parametric. Image and
Vision Computing, 30(11):843 – 859.
Saravanan, C. (2010). Color Image to Grayscale Image
Conversion. In 2010 Second International Confer-
ence on Computer Engineering and Applications, vol-
ume 2, pages 196–199.
Yang, L. and Albregtsen, F. (1996). Fast and exact compu-
tation of cartesian geometric moments using discrete
green’s theorem. Pattern Recognition, 29(7):1061–
1073.
Zhang, J., Huang, M., Jin, X., and Li, X. (2017). A Real-
Time Chinese Traffic Sign Detection Algorithm Based
on Modified YOLOv2. Algorithms, 10(4):127.
Zhang, Z. (2000). A Flexible New Technique for Camera
Calibration. IEEE Transactions on Pattern Analysis
and Machine Intelligence, 22.
Zhou, L. and Deng, Z. (2014). Lidar and vision-based
real-time traffic sign detection and recognition algo-
rithm for intelligent vehicle. In 17th International
IEEE Conference on Intelligent Transportation Sys-
tems (ITSC), pages 578–583.
Zhu, Z., Liang, D., Zhang, S., Huang, X., Li, B., and Hu,
S. (2016). Traffic-sign detection and classification
in the wild. In Proceedings of the IEEE Conference
on Computer Vision and Pattern Recognition, pages
2110–2118.
Real-time Sign Detection and Recognition for Self-driving Mini Rovers based on Template Matching and Hierarchical Decision Structure
215
