
A Novel Approach for Modelling the Relationship between Blood
Pressure and ECG by using Time-series Feature Extraction
Stefan Kochev
1 a
, Neven Stevchev
2 b
, Svetlana Kocheva
3 c
, Tome Eftimov
4 d
and Monika Simjanoska
1 e
1
Faculty of Computer Science and Engineering, Ss. Cyril and Methodius University,
Rugjer Boshkovikj 16, 1000 Skopje, North Macedonia
2
PZU d-r Andon Kochev, Javor bb, Radovish, North Macedonia
3
Medical Faculty, Ss. Cyril and Methodius University, 50th Division 6, 1000 Skopje, North Macedonia
4
Computer Systems Department, Jo
ˇ
zef Stefan Institute, Jamova cesta 39, 1000 Ljubljana, Slovenia
Keywords:
ECG, Blood Pressure, Machine Learning, Feature Extraction, Time-series Analysis.
Abstract:
This paper addresses the ECG-blood pressure relationship - a fact that physicians have discussed for years.
The hypothesis set in the paper is that blood pressure is related to electrocardiogram (ECG) and that the
systolic blood pressure (SBP) and diastolic blood pressure (DBP) values can be predicted by using information
only from a given ECG signal. Therefore, we established a protocol for creating a database considering
measurements from real patients in ambulance environment, and consequently developed methodology for
analysing the collected measurements. The proposed methodology follows two steps: i) first the signals are
considered as time series data, and ii) a time series feature extraction method is applied to extract the important
features from the ECG signals. Hereafter, a novel Machine learning method is applied (CLUS) that produced
best results among the traditionally-used Machine learning methods. The best results obtained are 12.81 ±
2.66 mmHg for SBP and 8.12 ± 1.80 mmHg for DBP. After introducing calibration method the obtained mean
absolute errors (MAEs) reduced to 6.93 ± 4.70 mmHg for SBP, and 7.13 ± 4.48 mmHg for DBP. Given the
latest literature, the results are appropriately compared and confirm the relation between the ECG signal and
the blood pressure.
1 INTRODUCTION
Cardiovascular diseases (CVDs) are among the top
five causes of death worldwide according to World
Health Organization research (Organization et al.,
2016). Ischemic heart disease and stroke are at the
top of this list. This fact indicates the particular im-
portance of prevention as well as early diagnosis and
treatment of CVDs. Blood pressure (BP) is one of the
vital signs used to diagnose these diseases. Regular
BP monitoring is especially important to detect pos-
sible changes in the functioning of the cardiovascular
system.
Recently, there is an expansion of wearable de-
a
https://orcid.org/0000-0001-9889-2286
b
https://orcid.org/0000-0003-3034-2995
c
https://orcid.org/0000-0002-5627-7899
d
https://orcid.org/0000-0001-7330-1902
e
https://orcid.org/0000-0002-5028-3841
vices equipped with biosensors designed to monitor
the activity of the human body by measuring some
of the vital signs. They come in the form of smart
watches, smart hand bracelets, belts, rings, smart
glasses, etc. Usually, smart watches are equipped
with motion detection sensors and Photoplethysmog-
raphy (PPG) sensors. Detailed analysis of these
measurements can provide important information to
physicians about the functioning of the cardiovascular
system of the patients. Even though the smart watches
and the wearable sensors are still not equipped with
BP sensors, the newest generation of smart watches
provides dual-electrode ECG sensors, e.g. the famous
Apple Watch in the latest two versions (fourth and
fifth), is equipped with ECG functionality (Hernando
et al., 2018). This is very important for the research
presented in this paper, since the main goal is to lever-
age the ECG signal in order to estimate the BP condi-
tion of the patient.
228
Kochev, S., Stevchev, N., Kocheva, S., Eftimov, T. and Simjanoska, M.
A Novel Approach for Modelling the Relationship between Blood Pressure and ECG by using Time-series Feature Extraction.
DOI: 10.5220/0008967202280235
In Proceedings of the 13th International Joint Conference on Biomedical Engineering Systems and Technologies (BIOSTEC 2020) - Volume 4: BIOSIGNALS, pages 228-235
ISBN: 978-989-758-398-8; ISSN: 2184-4305
Copyright
c
2022 by SCITEPRESS – Science and Technology Publications, Lda. All rights reserved

Several studies have been performed on the re-
lationship between blood pressure and morphologi-
cal characteristics of the ECG, which confirm that
there is no strong relationship between the morpho-
logical characteristics of the signal and hypertension
(Schroeder et al., 2003; Hassan et al., 2008). How-
ever, in the most recent research (Mousavi et al.,
2019a), this hypothesis is rejected since the results
clearly show ECG-BP relation based on the morpho-
logical characteristics of the ECG signal.
In this paper, a new approach for exploring the
ECG-BP relationship is proposed. The core of the
new approach is in the feature engineering phase. The
ECG signal is considered as time series data and Ma-
chine Learning models have been trained, which use
a space of 794 discriminatory time series features.
The paper is organized as follows. Section 2
presents the most reliable work related to the research
presented in this paper. The related work is orga-
nized in a table, which also encompasses our results,
to make it easily comparable with the literature. Since
we follow the regular procedure for biomedical signal
processing proposed in (Najarian and Splinter, 2005),
the first step to describe the biological system of inter-
est in the paper is described in Section 3. The sensors
used, the database, the preprocessing, the features se-
lection, and the complete Machine learning approach
are described in Section 4. Section 5 presents the re-
sults and the discussion, whereas the final conclusions
are presented in Section 6.
2 RELATED WORK
More attempts have been made to establish the rela-
tionship between BP and some parameters that can be
measured with wearable devices, such as PPG sensor.
However, the majority of them have used a combina-
tion of multiple sensors and vital signs information,
which requires an installation of additional measure-
ment devices. Only a few papers are studying the re-
lationship between the BP and the ECG only.
Given the published results in the literature, in Ta-
ble 1 we present many of the achievements evaluated
in the literature by the mean absolute error and stan-
dard deviation, MAE ± SD. The second cluster of re-
sults in the same table relate to the latest research pub-
lished in 2018 and 2019. In the third cluster, found in
the table, the results published in this paper are iso-
lated so that they can be easily compared with the re-
sults published in the literature.
From the related literature, we have identified only
four other studies in which ECG has been used to as-
sess BP. However, the methods in two of the studies
use an additional sensor (PPG sensor).
All the errors are measured in mmHg unit.
3 THE BIOLOGICAL SYSTEM
Electrocardiography is a standard method of record-
ing the impulses of electrical activity of the heart mus-
cle. The graphical representation of the heart’s elec-
trical bio-potentials is called an electrocardiogram
(ECG). Deviations from the normal ECG shape occur
at numerous cardiac abnormalities, including changes
in rhythm (such as atrial fibrillation and ventricular
Table 1: Related work comparison.
Research Source Num. sub-
jects
Age Records Method MAE SBP MAE DBP MAE MAP
(Gao et al., 2016) PPG 65 22–65 78 Wavelet, SVM 5.1 ± 4.3 4.6 ± 4.3 N/A
(Ahmad et al., 2012) ECG, PTT 10 24–63 150 Numerical solution ±5.93 ±4.76 ±4.23
(Chen et al., 2013) BCG, ECG 5 / / Analytical solution 9 ± 5.6 1.8 ± 1.3 N/A
(Daimiwal et al., 2014) PPG 16 18–48 / Frequency analysis 0.8 ± 7 0.9 ± 6 N/A
(Chan et al., 2001) ECG, PPG, PAT / / / Analytical solution 7.49 ± 8.8 4.07 ± 5.6 N/A
(Kachuee et al., 2015) PPG MIMIC II
(Saeed et al.,
2011)
adults 4254 Linear regression,
SVM
13.84 ± 17.56 6.96 ± 9.16 8.54 ± 10.87
(Yamanaka et al., 2016) PTT 127 / / Wavelet ±7.63 H/B H/B
(Ding et al., 2016) PTT, PPG 27 21–29 / Analytical solution −0.37 ± 5.21 −0.08 ± 4.06 −0.18 ± 4.13
(Su et al., 2018) ECG + PCG 84 / / Deep RNN [3.84-5.81] (RMSE) [1.80-5.21] (RMSE)
(Katayama et al., 2018) FBG sensor 77 21-87 132 PLSR, ANN Unknown: 12±17
(Zakrzewski and Anthony, 2018) Ultrasound (images) 24 / / Regression, Bland-
Altman
10.21 8.23
(Mousavi et al., 2019b) PCG 400 1323 DT,SVR, ABR,RFR [4.17-7.51] (SD) [8.90-18.54] (SD)
(Wu et al., 2018) ECG + PCG 85 / / DNN 3.63 2.45
(Fan et al., 2018) PCG 6 20-35 / Gaussian model 8.42±8.81 12.34±7.10
(Mousavi et al., 2019a) ECG 7 50-81 7 morphological fea-
tures, McSharry’s
method
1.125 ± 3.125 N/A N/A
(Yang et al., 2018) ECG, PPG 14 N/A N/A Lasso regression,
SVM
12.38 ± 16.17 6.34 ± 8.45 N/A
(Simjanoska et al., 2018) ECG 72 16 – 83 1253 Complexity analysis 7.93 ± 8.16 6.41 ± 7.5 5.72 ± 6.69
Our approach ECG 69 18 - 89 2073 tsfresh + CLUS 12.81 ± 2.66 8.12 ± 1.80 N/A
Our approach (calibrated) ECG 69 18 - 89 2073 tsfresh + CLUS 6.93 ± 4.70 7.13 ± 4.48 N/A
A Novel Approach for Modelling the Relationship between Blood Pressure and ECG by using Time-series Feature Extraction
229

tachycardia), inadequate blood flow to the coronary
artery, and electrolyte disturbances.
Blood pressure is defined as the force by which
blood presses on the walls of the arteries at different
stages of a cardiac cycle, and is measured in millime-
ters of mercury (mmHg). Usually BP is presented as
two values, that is, systolic and diastolic blood pres-
sure. Systolic blood pressure (SBP) is the pressure at
which the blood presses on the walls of the arteries
when the heart is pumped, i.e., the highest pressure in
a heart cycle (known as a pumping phase). Diastolic
blood pressure (DBP) is the pressure on the walls of
the arteries in the phase of filling the heart with blood,
that is, when the heart rests between two beats (or the
lowest blood pressure between two beats). Usually
greater attention is given to SBP as a major factor
for CVDs. According to recent studies, the risk of
death from ischemic heart disease and stroke is dou-
bled with every rise of 20 mmHg of systolic and 10
mmHg of DBP for people from 40 to 89 years (Asso-
ciation et al., 2014).
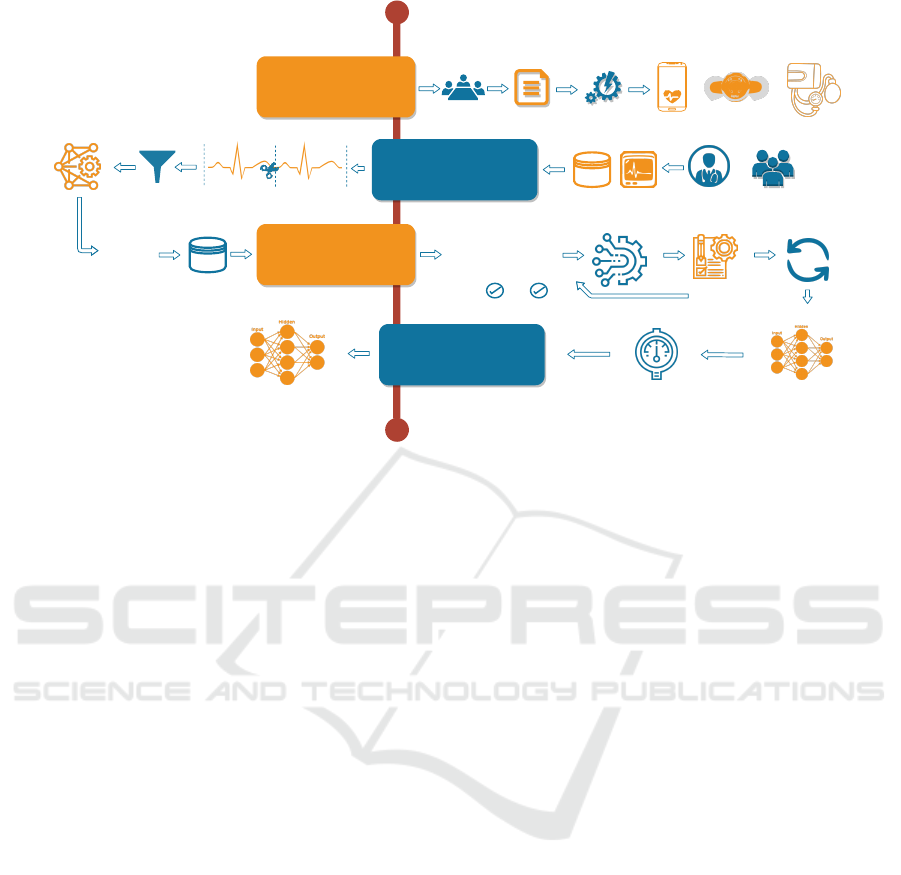
4 METHODOLOGY
To develop models that can be used for predicting
blood pressure using ECG time series, we propose our
own methodology that consists of four main steps:
• Data collection;
• Preprocessing of ECG signals;
• Training regression models for blood pressure
prediction;
• Methodology evaluation.
The methodology flowchart is presented in Figure 1.
Further, each step is described in detail.
4.1 Data Collection
The data collected in our study consists of 69 partic-
ipants, who agreed to be a part of the study. For the
data collection process, we established a protocol for
creating a data set that considers patients’ measure-
ments obtained in an ambulance environment.
The reason for creating the de novo database, in-
stead of using publicly available resources as Phys-
ionet’s Charis database, is the fact that the partici-
pants involved in the Charis database suffered trau-
matic brain injuries (Kim et al., 2016). Considering
such brain injuries, all of those patients would exhibit
a special case of hypertension, referred to as isolated
systolic hypertension, thus obtaining SBP of ≥ 140
and DBP of < 90 (Simjanoska et al., 2018). This
makes Charis database unacceptable for our study
since we would lack patients with normal blood pres-
sure values. In addition to this reason is the fact that
we want to prove the usefulness of the biosensors
technology in a case when there is a lack of medical
equipment.
Before the ECG signal and BP measurements
were collected, we obtained a study approval from the
Ethics committee, which is a part from the Faculty of
Medicine within “Ss. Cyril and Methodius” Univer-
sity in Skopje. Additionally, each participant signed
an agreement that their information can be used for
the purpose of the research study. The participants
data is anonymized.
The measurements were collected in a clinical
conditions with a help of physician. The physician
helped preparing the participant before measurements
start, by setting participants in the appropriate seating
position, way of breathing and their posture. After
that, the ECG signal is measured for three minutes
using a commercially available ECG device, known
as Zephyr ECG (Zephyr Technology, 2017). The
reliability of the device is previously confirmed in
other studies (Hailstone and Kilding, 2011). Addi-
tionally, at the beginning and at the end of the ECG
measurement, the physician measured the SBP and
DBP for every participant by using a standardized de-
vice for blood pressure (i.e. the traditional cuff-based
method). The data is taken into consideration only if
the two (consecutive) pairs of BP measurements are
in the range of ± 5 mmHg. The average of the two
pairs is taken as a final BP reading, assigned to the 3
minutes long ECG.
4.2 ECG Signals Preprocessing
After the data is collected, the next step is to prepro-
cess the data in order to create a training corpus that
will be used to train regression models for BP predic-
tion. The preprocessing step consists of several sub-
steps:
• Segmentation;
• Noise removal;
• Feature engineering.
4.2.1 Segmentation
Since we are working with ECG signals that are time
series from three minutes, we segmented each signal
into segments with a signal length of 10 s. Addition-
ally, to each segment we assigned the SBP and DBP
real values from the whole ECG signal.
BIOSIGNALS 2020 - 13th International Conference on Bio-inspired Systems and Signal Processing
230
1
2
3
4
Data
collection
Ethics committee
Research
approval
Mobile
Application
Development
Zephyr
Sense
Android
Application
+
Zephyr ECG
sensor
Expert
+
Participants
+
Cuff-based blood
pressure monitor
ECG signal samples
+ blood pressure
dataset
Preprocessing
+
Segmentation
...
...
10 seconds
10 seconds
Noise removal
Feature
engineering
1.15, 0.13, ...
2.19, 1.23, ...
4.12, 5.78, ...
0.76, 4.43, ...
...
Feature
vectors
Training
dataset
dataset
Regression
models training
1.15, 0.13, 0.33, 0.55, 0.76, ...
2.19, 1.23, 0.05, 0.88, 0.93, ...
4.12, 5.78, 0.21, 0.78, 0.70, ...
0.76, 4.43, 0.22, 0.21, 0.98, ...
4.12, 5.78, 0.21, 0.78, 0.70, ...
...
Feature selection
Hyperparameter tuning
and evaluation
Repeat and select
the best model
Methodology
evaluation
Training a regression
model
0
1
120
80
Regression model
Final regression models
Model callibration
Figure 1: Methodology flowchart.
4.2.2 Noise Removal
When measuring ECG signals, the signal obtained
contains a noise, that can be caused either by the de-
vice, or the environment where the measurements are
performed. For this reason, bandpass filters can be
used for noise removal. In this research, Butterworth
bandpass filter is selected that can be used with cut-off
frequency between 0.05 Hz and 100 Hz. The selec-
tion of the frequencies is supported by the results pub-
lished in (Simjanoska et al., 2018; Simjanoska et al.,
2019).
4.2.3 Feature Engineering
In order to extract useful information from the ECG
signal, we have come up with a new form of repre-
senting the ECG signal data in terms of time-series
features.
Manual definition and computation of an ECG
time series features is a time-consuming process
which requires an expert knowledge. An approach
of manual definition and computation of ECG fea-
tures has been already studied in a previous research
(Simjanoska et al., 2018; Simjanoska et al., 2019).
The new approach proposed in this paper deals with
automation of the feature engineering step, utilizing
the tsfresh library for ECG feature extraction (Christ
et al., 2018).
TSFresh is a python library that deals with au-
tomatic feature extraction for representing a time se-
ries data. Utilizing this library, 794 features can be
extracted for every 10s-long segment. There are 65
unique features, described in the documentation of the
tsfresh library (TSFresh, 2016). The number of 794
features for every segment is a result of computing
many of these features with different parameter set-
tings. Some of the features computed by the tsfresh
library are: absolute energy, absolute sum of changes,
autocorrelation, entropy, binned entropy, number of
values above and below the average, friedrich coeffi-
cients, skewness, symmetry looking, etc.
4.3 Regression Models Creation
The next challenge was creating regression models
that will be able to predict the real SBP and DBP val-
ues. For this reason, the training corpus that is de-
scribed by the tsfresh features is used again. In order
to shrink the feature space consisting of 794 features,
feature selection techniques are applied. Two differ-
ent approaches are used to train regression models.
In the first scenario, two different single linear regres-
sion models are trained (one for SBP and the other for
DBP). In this scenario, the SBP and DBP values are
assumed to be independent. To create the models we
evaluate Random Forest (Liaw et al., 2002), Gradient
Boosting (Friedman, 2002), Bagging (Sutton, 2005),
and XGBoost (Chen et al., 2015) methods. In the sec-
ond scenario, one multi-target linear regression model
is trained by using Clus Random Forest (Kocev et al.,
2013). In this scenario, the SBP and DBP values are
assumed to be dependent.
A Novel Approach for Modelling the Relationship between Blood Pressure and ECG by using Time-series Feature Extraction
231

4.3.1 Calibration
Since we are working with sensors that measure vital
signs and also moving in the direction of personalized
medicine, in most cases we should adapt the models
with regard to the user. In our approach, we propose
a calibration which includes several user’s segments
in the training set used to train the regression mod-
els. This is motivated from the reason that on that
way the model can learn the specific relations that ex-
ist between the ECG and BP for the specific user. It
can be used as online learning approach, where at the
beginning, a pretrained model is provided, and after
receiving several segments from the user, the model
will start to adapt.
4.4 Methodology Evaluation
In order to evaluate the regression models, and
eliminate the possibility of overfitting, a Leave-one-
participant-out validation is used. Again, all the seg-
ments from one participant are used for testing, and
the segments from the other participants are used to
train a model. After applying the trained model, mean
absolute error (MAE) is calculated for each segment
from the testing participant. Eventually, the average
MAE is calculated considering all the segments from
the testing participant. In addition to MAE, the stan-
dard deviation (SD) is also calculated. This process
is repeated for every participant, and finally, the aver-
age MAE and SD from the values associated to every
participant, are reported.
5 RESULTS AND DISCUSSION
In this section we describe the data set used for our
experiments, as well as the obtained results from the
regression models, followed by a discussion.
5.1 Data
The data set consists of ECG signals and BP measure-
ments for each of the 69 participants, including 43
men and 26 women of age in range 18-89. The ECG
signal is acquired using the Zephyr ECG device. Sys-
tolic and diastolic BP readings, acquired with a stan-
dard cuff-based BP device, are assigned to each ECG
signal.
For 55 of the participants, an ECG signal of 3 min-
utes length is measured. The sampling frequency of
the Zephyr ECG device is 250Hz, providing a signal
of 45,000 points in length (3min x 60sec x 250Hz =
45,000 ECG signal points). For 5 of the participants,
an ECG of different length is measured. For the rest of
9 participants, several distinct ECG signals of differ-
ent length, accompanied with BP readings, have been
acquired.
The segmentation step results in total of 2073 seg-
ments with a signal length of 10 seconds. This in-
cludes 990 ECG segments for 55 of the participants
with 3 minutes long ECG signal and 1083 segments
for the rest of 14 participants for which several ECG
signals of different length have been acquired.
5.2 Feature Selection
The “curse of dimensionality” is a problem that
typically arises when analyzing a data in high-
dimensional feature space. The feature space of 794
attributes is a high-dimensional space, and as it turns
out, many of these features are correlated. To reduce
the number of features, correlation analysis is per-
formed (Ji et al., 2001), followed by removing fea-
tures with a Pearson’s correlation greater than 0.75.
After that, a model-based feature selection is used, re-
moving the least significant features, with respect to
the feature weights computed by the Gradient Boost-
ing model (Xu et al., 2014). It is important to be
mentioned that the final set of features depends on
the training data used in each iteration (according to
the leave-one-participant out rules), since the train-
ing data is used for the correlation analysis and the
model-based selection of features.
In most cases, the combination of these two ap-
proaches results in a feature space of around 450 fea-
tures and better regression models as explained in the
following steps.
5.3 Regression
To predict the SBP and DBP value, five different re-
gression algorithms are applied: i) Random Forest, ii)
Gradient Boosting, iii) Bagging Regressor, iv) XG-
Boost Regressor, and v) CLUS. As evaluation metric
mean absolute error (MAE) is selected together with
the standard deviation (SD) averaged across all pa-
tients, as reported in Table 2.
Using the table, it can be seen that CLUS provided
most promising results that are also in the range of
state-of-the-art approaches used for the same prob-
lem. In this case, only one multi-target regression
model is trained. It achieved an average error of 12.81
± 2.66 mmHg for the SBP and 8.12 ± 1.80 mmHg for
the DBP. The other models that learn separate linear
regression models for SBP and DBP, and therefore,
treating them as two independent problems, provide
larger errors.
BIOSIGNALS 2020 - 13th International Conference on Bio-inspired Systems and Signal Processing
232

5.3.1 Calibration
The proposed calibration method can be evaluated
with nine of the participants, as only for these par-
ticipants several distinct measurements (ECG signal
+ BP readings) have been taken. The distinct mea-
surements for one participant are taken during several
days. The BP values vary for each of the measure-
ments. To show the calibration process, in Table 3,
we presented the calibration results for these nine par-
ticipants. In that case, one participant’s measurement
is included in the training phase, while the testing is
done on the other participant’s measurements.
Considering the calibration results provided in the
table, it can be seen that it really helps the model to
adapt the relations between the ECG signal and BP of
a specific user, which results in smaller errors, even
though only one participant’s measurement is used in
the training set. Taking into account the results in Ta-
ble 2, it can be concluded that the model performs
very well even without calibration applied, meaning
at most of the cases (except for patient 5 at the SBP
case, and patients 6 and 7 at DBP case), the errors are
near or even less than those reported in the same ta-
ble. However, when the calibration is applied, those
errors are reduced and meet the expectations from the
model.
When compared to the results in the literature
where the authors used distribution-based calibration
methodology (Simjanoska et al., 2018), and obtained
MAEs of 7.72 mmHg for SBP, 9.45 mmHg for DBP
and 8.13 mmHg for MAP, our results showing MAEs
of 6.93 ± 4.70 mmHg for SBP and 7.13 ± 4.48
mmHg for DBP, indicate that the proposed methodol-
ogy is competitive to those presented in state-of-the-
art literature.
Even though the calibration can be considered as
limitation and this problem should be addressed in the
future work, however, many smart devices applica-
tions nowadays require personal information before
they can be accurately used.
6 CONCLUSION
This paper presents a novel methodology for BP pre-
diction by using information only from ECG signal.
The methodology addresses the hypothesis whether
the BP is related and can be predicted from ECG.
For the goal to accept the hypothesis, we performed
experiment in which we developed a procedure for
collecting ECG signals measured at patients in ambu-
lance environment, by using commercial and reliable
biosensor (Zephyr), as well as a certified cuff-based
device for measuring the reference BP values. The
methodology developed consists of multiple steps in-
cluding preprocessing the signals, feature extraction
and Machine learning methods to build the models for
the BP prediction given the ECG signal. The core of
importance of the proposed methodology is in the fea-
ture extraction process at which a suitable time-series
method is applied to form the reliable feature space.
The best results obtained are 12.81 ± 2.66 mmHg
for SBP and 8.12 ± 1.80 mmHg for DBP. After in-
troducing calibration method the results significantly
improved, and the obtained MAEs reduced to 6.93
± 4.70 mmHg for SBP, and 7.13 ± 4.48 mmHg for
DBP. Given the latest literature, the results obtained
from the proposed methodology confirm the relation
between the ECG signal and the blood pressure.
Table 2: Regression models evaluation metrics.
Algorithm Systolic MAE Systolic SD Diastolic MAE Diastolic SD
1 Random Forest 13.99 4.13 8.65 2.71
2 Gradient Boosting 13.68 3.88 8.97 2.48
3 Bagging Regressor 13.62 3.86 8.87 2.91
4 XGBoost Regressor 13.71 3.81 8.95 2.47
5 CLUS 12.81 2.66 8.12 1.80
Table 3: Calibration evaluation on distinct testing set.
part. ID Systolic MAE Diastolic MAE Calibrated Systolic MAE Calibrated Diastolic MAE
1 7.51 ±5.25 6.35 ±4.82 5.86 ±3.62 4.05 ±4.81
2 8.71 ±4.87 8.11 ±5.63 5.72 ±3.93 5.88 ±4.61
3 4.05 ±3.54 8.11 ±3.92 3.81 ±3.53 7.55 ±3.97
4 11.64 ±6.37 6.96 ±4.35 11.25 ±6.21 6.84 ±4.34
5 13.72 ±6.65 6.55 ±4.12 7.22 ±4.59 6.40 ±4.01
6 6.31 ±3.16 21.82 ±6.31 6.15 ±4.04 17.41 ±7.36
7 7.97 ±3.54 17.11 ±4.83 6.77 ±3.66 5.61 ±2.72
8 12.02 ±7.62 6.26 ±6.84 10.14 ±6.32 5.44 ±5.09
9 6.69 ±6.70 6.93 ±4.06 5.44 ±6.39 5.02 ±3.12
A Novel Approach for Modelling the Relationship between Blood Pressure and ECG by using Time-series Feature Extraction
233

ACKNOWLEDGEMENTS
We would like to thank all participants that contribute
to the study. We would also like to thank the medical
staff employed at PZU d-r Andon Kochev, Javor bb,
Radovish, North Macedonia.
This work was supported by the Slovenian Re-
search Agency Program P2-0098 and has received
funding from the European Union’s Horizon 2020 re-
search and innovation programme under grant agree-
ment No 863059 and No 769661.
Information and the views set out in this publica-
tion are those of the authors and do not necessarily re-
flect the official opinion of the European Union. Nei-
ther the European Union institutions and bodies nor
any person acting on their behalf may be held respon-
sible for the use that may be made of the information
contained herein.
REFERENCES
Ahmad, S., Chen, S., Soueidan, K., Batkin, I., Bolic, M.,
Dajani, H., and Groza, V. (2012). Electrocardiogram-
assisted blood pressure estimation. IEEE Transactions
on Biomedical Engineering, 59(3):608–618.
Association, A. H. et al. (2014). Understanding blood pres-
sure readings. Updated November, 17.
Chan, K., Hung, K., and Zhang, Y. (2001). Noninva-
sive and cuffless measurements of blood pressure for
telemedicine. In Engineering in Medicine and Biol-
ogy Society, 2001. Proceedings of the 23rd Annual In-
ternational Conference of the IEEE, volume 4, pages
3592–3593. IEEE.
Chen, T., He, T., Benesty, M., Khotilovich, V., and Tang,
Y. (2015). Xgboost: extreme gradient boosting. R
package version 0.4-2, pages 1–4.
Chen, Z., Yang, X., Teo, J. T., and Ng, S. H. (2013).
Noninvasive monitoring of blood pressure using op-
tical ballistocardiography and photoplethysmograph
approaches. In Engineering in Medicine and Biol-
ogy Society (EMBC), 2013 35th Annual International
Conference of the IEEE, pages 2425–2428. IEEE.
Christ, M., Braun, N., Neuffer, J., and Kempa-Liehr, A. W.
(2018). Time series feature extraction on basis of scal-
able hypothesis tests (tsfresh–a python package). Neu-
rocomputing, 307:72–77.
Daimiwal, N., Sundhararajan, M., and Shriram, R. (2014).
Respiratory rate, heart rate and continuous measure-
ment of bp using ppg. In Communications and Signal
Processing (ICCSP), 2014 International Conference
on, pages 999–1002. IEEE.
Ding, X.-R., Zhang, Y.-T., Liu, J., Dai, W.-X., and Tsang,
H. K. (2016). Continuous cuffless blood pressure es-
timation using pulse transit time and photoplethysmo-
gram intensity ratio. IEEE Transactions on Biomedi-
cal Engineering, 63(5):964–972.
Fan, X., Ye, Q., Yang, X., and Choudhury, S. D. (2018).
Robust blood pressure estimation using an rgb cam-
era. Journal of Ambient Intelligence and Humanized
Computing, pages 1–8.
Friedman, J. H. (2002). Stochastic gradient boosting. Com-
putational statistics & data analysis, 38(4):367–378.
Gao, S. C., Wittek, P., Zhao, L., and Jiang, W. J. (2016).
Data-driven estimation of blood pressure using photo-
plethysmographic signals. In Engineering in Medicine
and Biology Society (EMBC), 2016 IEEE 38th An-
nual International Conference of the, pages 766–769.
IEEE.
Hailstone, J. and Kilding, A. E. (2011). Reliability and va-
lidity of the zephyr
TM
bioharness
TM
to measure respi-
ratory responses to exercise. Measurement in Physical
Education and Exercise Science, 15(4):293–300.
Hassan, M. K. B. A., Mashor, M., Nasir, N. M., and Mo-
hamed, S. (2008). Measuring of systolic blood pres-
sure based on heart rate. In 4th Kuala Lumpur Interna-
tional Conference on Biomedical Engineering 2008,
pages 595–598. Springer.
Hernando, D., Roca, S., Sancho, J., Alesanco,
´
A., and
Bail
´
on, R. (2018). Validation of the apple watch for
heart rate variability measurements during relax and
mental stress in healthy subjects. Sensors, 18(8):2619.
Ji, X.-j., Li, S.-z., and Li, T. (2001). Application of the
correlation analysis in feature selection. Journal of
Test and Measurement Technology, 15(1):15–18.
Kachuee, M., Kiani, M. M., Mohammadzade, H., and Sha-
bany, M. (2015). Cuff-less high-accuracy calibration-
free blood pressure estimation using pulse transit time.
In Circuits and Systems (ISCAS), 2015 IEEE Interna-
tional Symposium on, pages 1006–1009. IEEE.
Katayama, K., Ishizawa, H., Koyama, S., and Fujimoto, K.
(2018). Improvement of blood pressure prediction us-
ing artificial neural network. In 2018 IEEE Interna-
tional Symposium on Medical Measurements and Ap-
plications (MeMeA), pages 1–5. IEEE.
Kim, N., Krasner, A., Kosinski, C., Wininger, M., Qadri,
M., Kappus, Z., Danish, S., and Craelius, W. (2016).
Trending autoregulatory indices during treatment for
traumatic brain injury. Journal of clinical monitoring
and computing, 30(6):821–831.
Kocev, D., Vens, C., Struyf, J., and D
ˇ
zeroski, S. (2013).
Tree ensembles for predicting structured outputs. Pat-
tern Recognition, 46(3):817–833.
Liaw, A., Wiener, M., et al. (2002). Classification and re-
gression by randomforest. R news, 2(3):18–22.
Mousavi, S. S., Charmi, M., Firouzmand, M., Hemmati, M.,
and Moghadam, M. (2019a). A new approach based
on dynamical model of the ecg signal to blood pres-
sure estimation. In 2019 4th International Conference
on Pattern Recognition and Image Analysis (IPRIA),
pages 210–215. IEEE.
Mousavi, S. S., Firouzmand, M., Charmi, M., Hemmati,
M., Moghadam, M., and Ghorbani, Y. (2019b). Blood
pressure estimation from appropriate and inappropri-
ate ppg signals using a whole-based method. Biomed-
ical Signal Processing and Control, 47:196–206.
BIOSIGNALS 2020 - 13th International Conference on Bio-inspired Systems and Signal Processing
234

Najarian, K. and Splinter, R. (2005). Biomedical signal and
image processing. CRC press.
Organization, W. H. et al. (2016). Global status report
on noncommunicable diseases 2010. geneva: Who;
2011. World Health Organization.
Saeed, M., Villarroel, M., Reisner, A. T., Clifford, G.,
Lehman, L.-W., Moody, G., Heldt, T., Kyaw, T. H.,
Moody, B., and Mark, R. G. (2011). Multiparameter
intelligent monitoring in intensive care ii (mimic-ii):
a public-access intensive care unit database. Critical
care medicine, 39(5):952.
Schroeder, E. B., Liao, D., Chambless, L. E., Prineas,
R. J., Evans, G. W., and Heiss, G. (2003). Hyper-
tension, blood pressure, and heart rate variability: the
atherosclerosis risk in communities (aric) study. Hy-
pertension, 42(6):1106–1111.
Simjanoska, M., Gjoreski, M., Gams, M., and Made-
vska Bogdanova, A. (2018). Non-invasive blood pres-
sure estimation from ecg using machine learning tech-
niques. Sensors, 18(4):1160.
Simjanoska, M., Papa, G., Seljak, B., and Eftimov, T.
(2019). Comparing different settings of parameters
needed for pre-processing of ecg signals used for
blood pressure classification. In 12th International
Conference on Bio-inspired Systems and Signal Pro-
cessing, pages 62–72.
Su, P., Ding, X.-R., Zhang, Y.-T., Liu, J., Miao, F., and
Zhao, N. (2018). Long-term blood pressure predic-
tion with deep recurrent neural networks. In 2018
IEEE EMBS International Conference on Biomedical
& Health Informatics (BHI), pages 323–328. IEEE.
Sutton, C. D. (2005). Classification and regression trees,
bagging, and boosting. Handbook of statistics,
24:303–329.
TSFresh (2016). List of features computed by the tsfresh li-
brary. https://tsfresh.readthedocs.io/en/latest/text/list\
of\ features.html.
Wu, D., Xu, L., Zhang, R., Zhang, H., Ren, L., and Zhang,
Y.-T. (2018). Continuous cuff-less blood pressure es-
timation based on combined information using deep
learning approach. Journal of Medical Imaging and
Health Informatics, 8(6):1290–1299.
Xu, Z., Huang, G., Weinberger, K. Q., and Zheng, A. X.
(2014). Gradient boosted feature selection. In Pro-
ceedings of the 20th ACM SIGKDD international con-
ference on Knowledge discovery and data mining,
pages 522–531. ACM.
Yamanaka, S., Morikawa, K., Yamamura, O., Morita, H.,
and Huh, J. Y. (2016). The wavelet transform of
pulse wave and electrocardiogram improves accuracy
of blood pressure estimation in cuffless blood pressure
measurement.
Yang, S., Zaki, W., Morgan, S., Cho, S.-Y., Correia, R.,
Wen, L., and Zhang, Y. (2018). Blood pressure esti-
mation from photoplethysmogram and electrocardio-
gram signals using machine learning.
Zakrzewski, A. M. and Anthony, B. W. (2018). Noninva-
sive blood pressure estimation using ultrasound and
simple finite element models. IEEE Transactions on
Biomedical Engineering, 65(9):2011–2022.
Zephyr Technology (2017). Zephyr bioharness 3.0 user
manual. https://www.zephyranywhere.com/media/
download/bioharness3-user-manual.pdf.
A Novel Approach for Modelling the Relationship between Blood Pressure and ECG by using Time-series Feature Extraction
235
