
Characterization Procedure of the Flight Laser Modules for the
ExoMars Raman Laser Spectrometer
Marina Benito-Parejo
1a
, Pablo Rodríguez-Pérez
2b
, Ángel Marín
1
, José A. Rodríguez-Prieto
1
,
Rosario Canchal
2
, Andoni Moral
2
and Fernando Rull
3
1
Ingeniería de Sistemas para la Defensa de España ISDEFE, Calle Beatriz de Bobadilla 3, 28040 Madrid, Spain
2
Instituto Nacional de Técnica Aeroespacial INTA, Ctra Ajalvir Km4, 28850 Torrejón de Ardoz, Spain
3
Universidad de Valladolid UVA, Parque Tecnológico Boecillo, 47151, Valladolid, Spain
Keywords: ExoMars, Raman Laser Spectrometer, Raman Laser Module, Raman Laser Flight Models.
Abstract: Several space missions have been sent to the surface of Mars carrying scientific instruments to study the
environment. However, only one of these missions included a laser: the ChemCam instrument on-board
NASA’s Curiosity mission. In 2020, two missions will be launched to study the Martian surface and search
for signs of life: NASA’s Mars mission carrying SuperCam instrument that will perform Raman spectroscopy
and LIBS technique; and ESA’s mission, ExoMars, with a Raman Laser Spectrometer (RLS) as part of the
rover’s payload that will study the Martian surface. One of the critical points of the RLS instrument is the
laser, due to the strict technological requirements that must be met to satisfy scientific and environmental
requirements. This paper summarizes the electro-optical characterization campaigns that passed the Flight
Model (FM) and the Flight model Spare (FS).
1 INTRODUCTION
The surface of Mars has already been studied for
some decades, since the arrival of the first rover in
1997, the NASA’s Pathfinder mission rover,
Sojourner, being the first probe to touch down on the
Martian surface. It was also a NASA mission that
took the following rovers to Mars, this time two twin
vehicles with the same instruments: Spirit and
Opportunity. They landed in opposite regions of the
planet in January 2004 with the aim of finding
evidence of water on Mars. In 2011, NASA gave up
contact with Spirit, and with Opportunity in 2018
(Mann, 2019).
NASA’s most recent rover to touch down on Mars
is Curiosity, which landed in 2012 and is the only
rover still active (Mars Exploration Program, 2019).
It is the largest vehicle on the Martian surface and its
main objective is to determine if Mars ever had what
all life needs: durable water and appropriate chemical
ingredients. This rover is still operative and could last
longer than the previous ones because it is powered
by a nuclear battery instead of solar panels. It was in
a
https://orcid.org/0000-0001-6192-2197
b
https://orcid.org/0000-0001-7534-0884
this mission that the first specific scientific laser for
Mars exploration was sent, in the ChemCam
instrument on-board Curiosity (Mann, 2019).
The ChemCam instrument used the laser-induced
breakdown spectroscopy (LIBS) technique, with a
pulsed laser. This laser, about 600g weight, uses three
Neodymium-doped Potassium-Gadolinium
Tungstate (Nd:KGW) crystals and emits pulses at
1067 nm. It is used to vaporize rock surfaces and
soils, creating a plasma of their component gases. The
generated plasma is characterized by a spectrometer,
included also in ChemCam (NASA Science, 2019).
Although in 2018 Curiosity discovered organic
materials (Mann, 2019), the LIBS approach does not
allow detecting low presence of organic molecules
(Ciminelli, Del’Olio & Armensie, 2016).
The ChemCam successor, SuperCam instrument
included in next NASA Mars mission, to be launched
in 2020, will not only use the LIBS technique but also
Raman spectroscopy in a range up to 12m away from
the rover. The objective of this mission is to look for
signs of past or present life, and to see if humans
could one day explore Mars (NASA, 2019). The
Benito-Parejo, M., Rodríguez-Pérez, P., Marín, Á., Rodríguez-Prieto, J., Canchal, R., Moral, A. and Rull, F.
Characterization Procedure of the Flight Laser Modules for the ExoMars Raman Laser Spectrometer.
DOI: 10.5220/0008966701070113
In Proceedings of the 8th International Conference on Photonics, Optics and Laser Technology (PHOTOPTICS 2020), pages 107-113
ISBN: 978-989-758-401-5; ISSN: 2184-4364
Copyright
c
2022 by SCITEPRESS – Science and Technology Publications, Lda. All rights reserved
107
SuperCam laser uses a Neodymium-doped Yttrium
Aluminum Garnet (Nd:YAG) crystal and emits one
laser beam at 1064nm and another one at 532nm
(Wiens, Maurice & Perez, 2017). LIBS spectroscopy
uses the 1064 nm beam while the 532 nm beam is
used for Raman spectroscopy. Mars2020 rover will
also include an ultraviolet laser, about 400g weight,
to perform proximity Raman with the Scanning
Habitable Environments with Raman &
Luminescence for Organics & Chemicals instrument,
SHERLOC, (Beegle et al, 2015).
The next European Martian mission, an
astrobiology program by ESA and the Russian space
agency Roscosmos, ExoMars mission will be also
launched in 2020. In contrast with previous missions,
ExoMars will be the first mission capable of moving
around the Martian surface while studying the
composition of materials at depth thanks to a drill that
will extract samples up to 2m below the surface
(ESA, 2019). The scientific objectives of the
ExoMars mission are: searching for possible
biosignatures of past Martian life, characterizing the
water and geochemical distribution as a function of
depth in the shallow surface to better understand the
evolution and habitability of Mars, and achieving
incremental steps for future return samples missions
(ESA Scientific Exploration, 2019).
ExoMars mission will carry, in its analytical
laboratory (ALD), two instruments with laser devices
(Vago et al., 2017):
The Raman Laser Spectrometer (RLS)
The Mars Organic Molecule Analyser (MOMA)
The goal of MOMA is to seek signs of past life on
Mars by analysing a wide range of organic
compounds in the collected soil samples, studying
large molecules, inorganic minerals and volatile
organic molecules using a UV laser. From a
Neodymium/chromium-doped YAG (Nd:Cr:YAG)
crystal, its 1064 nm beam is converted to its
frequency-quadrupled of 266 nm as output beam
(Goesmann, et al. 2017).
The other laser on-board ExoMars rover belongs
to the RLS instrument, which seeks to search
biosignatures and biomarkers on Mars using Raman
Spectroscopy (European Space Agency, 2013). This
very useful technique is used to identify mineral
phases produced by water-related processes. In
addition, it will help identify organic compounds and
search for microbial life by identifying the mineral
products and indicators of biologic activities. RLS
will provide geological and mineralogical context
information with a non-destructive technique that will
allow a cooperative working with the other
instruments in ALD, and cross-correlate scientific
data (Rull, et al. 2017).
2 RAMAN LASER
SPECTROMETER
DESCRIPTION
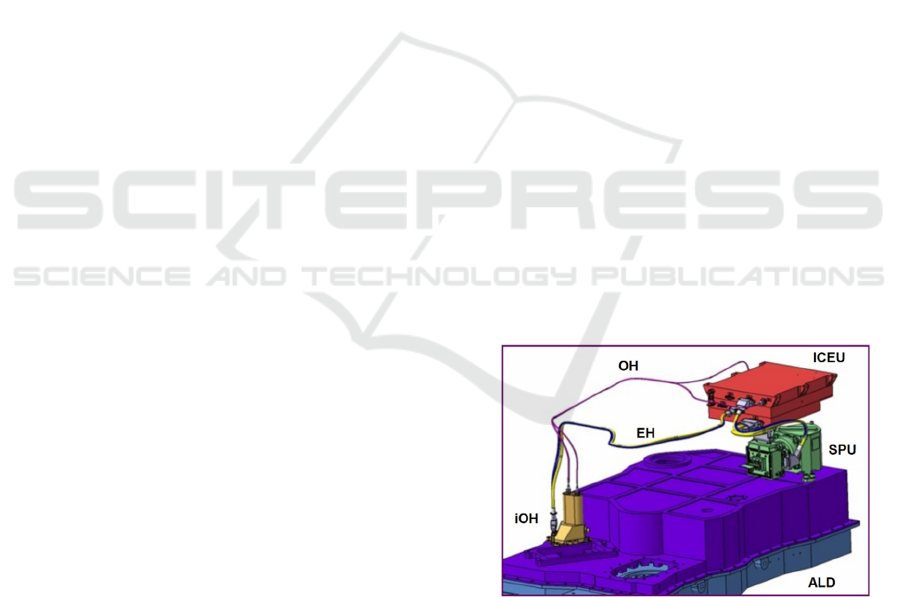
RLS instrument consist of three main units:
Spectrometer Unit (SPU)
Internal Optical Head (iOH)
Instrument Control and Excitation Unit (ICEU)
The Raman Laser Module (RLM) is located in the
ICEU, and its excitation signal is carried by means of
optical harness (OH#1) to the iOH to illuminate the
sample. Another fibre (OH#2) collects the Raman
signal to the SPU so it can be processed. These three
units, in addition to being connected by optical fibres,
are also interconnected by electrical harness (EH) that
distributes signal transmission and power supply
between them. Some of the main technical
characteristics of the instrument are the following
(Moral, et al. 2018):
2.4 kg of mass
Work performance in thermal environments
between -40ºC and 0ºC, and non-operational
survival between -60ºC and +50ºC
Power consumption between 20W and 30W,
depending on the temperature range and
operational mode.
Figure 1: ExoMars Rover ALD with the RLS units layout.
The RLS laser module is one of the most critical
parts of the Raman instrument and for its design,
scientific requirements and functionalities had to be
taken into account. Thus, as top-level scientific
requirements for the instrument, the following
parameters were taken (Rull, et al. 2011):
PHOTOPTICS 2020 - 8th International Conference on Photonics, Optics and Laser Technology
108
Spectral range of 150 to 3800 cm
-1
, so that all
important spectral bands can be detected in
Martian exploration.
Spectral resolution of at least 6 cm
-1
(up to 2000
cm
-1
wave numbers) or 8 cm
-1
(for wave numbers
higher than 2000 cm
-1
), so that the instrument is
able to differentiate between two Raman bands.
Maximum power on the sample of 0.3 – 0.6
kW/cm
2
, depending on the sample: to obtain the
highest possible Raman signal without burning
the sample.
Spot size of 50 µm.
2.1 Laser Module Optical
Characteristics
According to these requirements, the Raman Laser
Module (RLM) was designed and assembled with
(Moral et al. 2018):
Wavelength of 532 nm ± 0.5nm. This is the most
suitable for planetary Raman laser spectroscopy
because it not only stimulates Raman resonance
signals in biomolecules but also has a great
performance for geology (Rull & Martínez-Frías,
2006).
Optical output power from 20 mW to 30 mW.
High enough to obtain an adequate signal-to-noise
ratio (SNR) in the Raman signal but without
burning or altering the sample.
Redundant laser design. Two lasers channels are
included in the unit, as a risk mitigation strategy.
Main peak stability of ±10pm. The stability of the
main peak wavelength is vital to avoid Raman
signals disturbed by variations in the wavelength
of the emitted signal.
Main peak linewidth of 29pm, in order to achieve
the spectral resolution at instrument level.
Side mode suppression ratio below -20dB.
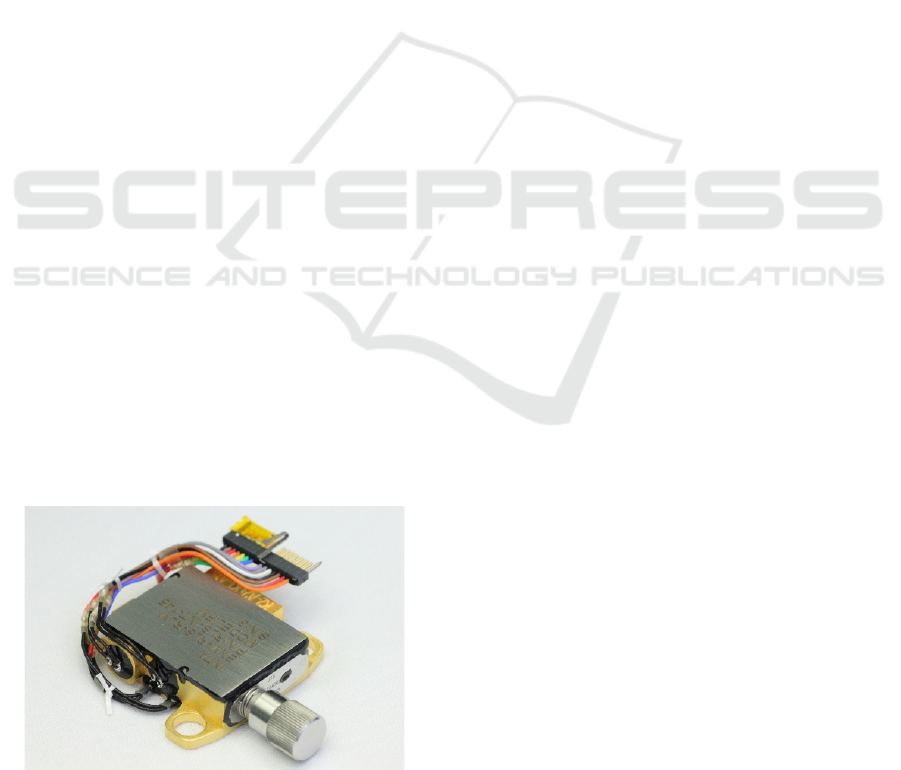
Figure 2: Flight Model of Raman Laser Module.
Both, the spectral behaviour and the level of
optical output power are the most important points,
and keeping them stable implies a very precise
temperature control. Thus, thermal control is one of
the critical parameters that must be taken over RLM.
The device has two thermal sensors embedded in the
module, capable of independently measuring the
temperature inside the housing of the laser module.
These thermal sensors, together with an external
thermo-electric module (TEM) and the associated
electronics and software allow a precise control of
thermal conditions inside the RLM, necessary to
achieve the required spectral stability. The range of
working temperatures, or setpoints, admitted by the
pumping diodes is 15ºC to 45ºC. However, the
operational temperature of the laser module itself was
confined between 20ºC and 30ºC, i.e. close to the
room temperature used during the optical components
alignment procedure. Therefore, electro-optical
characterization focused on that temperature interval.
In order to find the exact working points for each
laser contained inside the RLM, LD1 and LD2, it is
necessary to know the optical behaviour of each one
in a temperature range around 25ºC, as well as in a
feeding current range between current threshold and
the maximum current provided by the flight laser
driver, that are 0.5A and 1.5A, respectively. It is not
only important to characterize the behaviour of the
main peak at 532 nm: the pumping laser diode (PLD)
wavelength is also useful for monitoring purposes.
Even though, by design, the externally available PLD
output power is very low, its spectral contribution
could still be distinguished with a high enough SNR.
The PLD emission wavelength, close to 808 nm, is
directly related to the device temperature. Monitoring
the PLD wavelength while changing the temperature
and feeding current setpoints, for LD1 and for LD2,
will facilitate us to check the thermal operation of the
RLM, and later correlate these measurements with
those obtained after the RLM integration into the
ICEU.
These critical parameters were the main ones to
cope with in the characterization campaigns of the
flight models. Specific tests were designed to fulfil
these functional characteristics and the requirements
imposed on the RLS instrument.
3 FLIGHT MODEL OPTICAL
TEST CAMPAIGN
The RLM Flight Model (FM) characterization
campaign consisted on a series of tests designed to
characterize and evaluate the behaviour of the
Characterization Procedure of the Flight Laser Modules for the ExoMars Raman Laser Spectrometer
109
selected device, aimed to select the working points
that met the requirements. In particular, the strategy
of the Raman laser flight model characterization
campaign comprised two main steps:
Gross output power and spectral performance
assessment over a wide temperature and current
range. This first step is performed to estimate one
or several potential setpoints within each laser
unit.
Fine output power and spectral performance
assessment in the proximity of the candidate
setpoints in order to confirm its feasibility and
check the performance stability at the selected
setpoint.
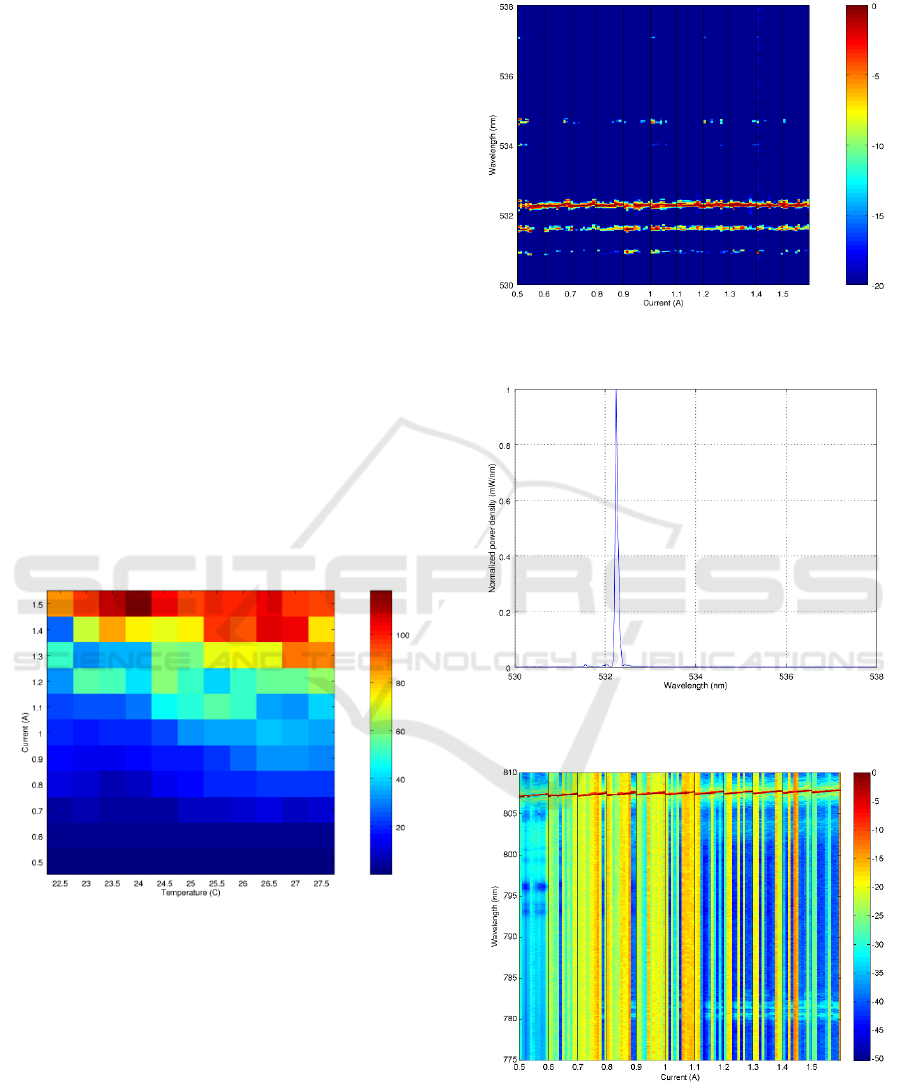
3.1 Characterization Results
The goal of this global search is to pick up a starting
temperature and current setpoint for a detailed
assessment of laser performances. For that, a test was
carried out by sweeping in temperature (from 22.5ºC
to 27.5ºC) and currents (from 0.5A to 1.5A), and
recording in each step both output power and
spectrum using a beamsplitter (BS) fibre. As an
example, optical output power values and spectrum
are represented in Figure 3 and Figure 4, respectively.
Figure 3: Optical output power (mW) 2D map from RLM
FM LD1.
From these figures, we can identify the potential
setpoints, those temperature-current areas where the
optical power value is between 20 - 30 mW and the
secondary peak is below -20dB (Figure 5).
The spectral range recorded is 400 nm to 1100 nm,
so Nd:YAG peak at 1064 nm and PLD wavelength at
808 nm can be assessed. PLD wavelength variations
due to temperature and current in the test carried out
are relevant (Figure 6), and therefore PLD peak
information is also reported during our automated
tests (Figure 7).
Figure 4: Spectral performance close to 532nm in
normalized power density (dB/nm) from RLM FM LD1.
Figure 5: Spectrum centred in 532 nm from RLM FM LD1,
in the selected setpoint.
Figure 6: Spectral performance close to PLD wavelength in
normalized power density (dB/nm) from RLM FM LD1.
This test was repeated in the same temperature
and current ranges, but recording only optical power,
PHOTOPTICS 2020 - 8th International Conference on Photonics, Optics and Laser Technology
110
in order to obtain LIV (power, current and voltage)
curves.
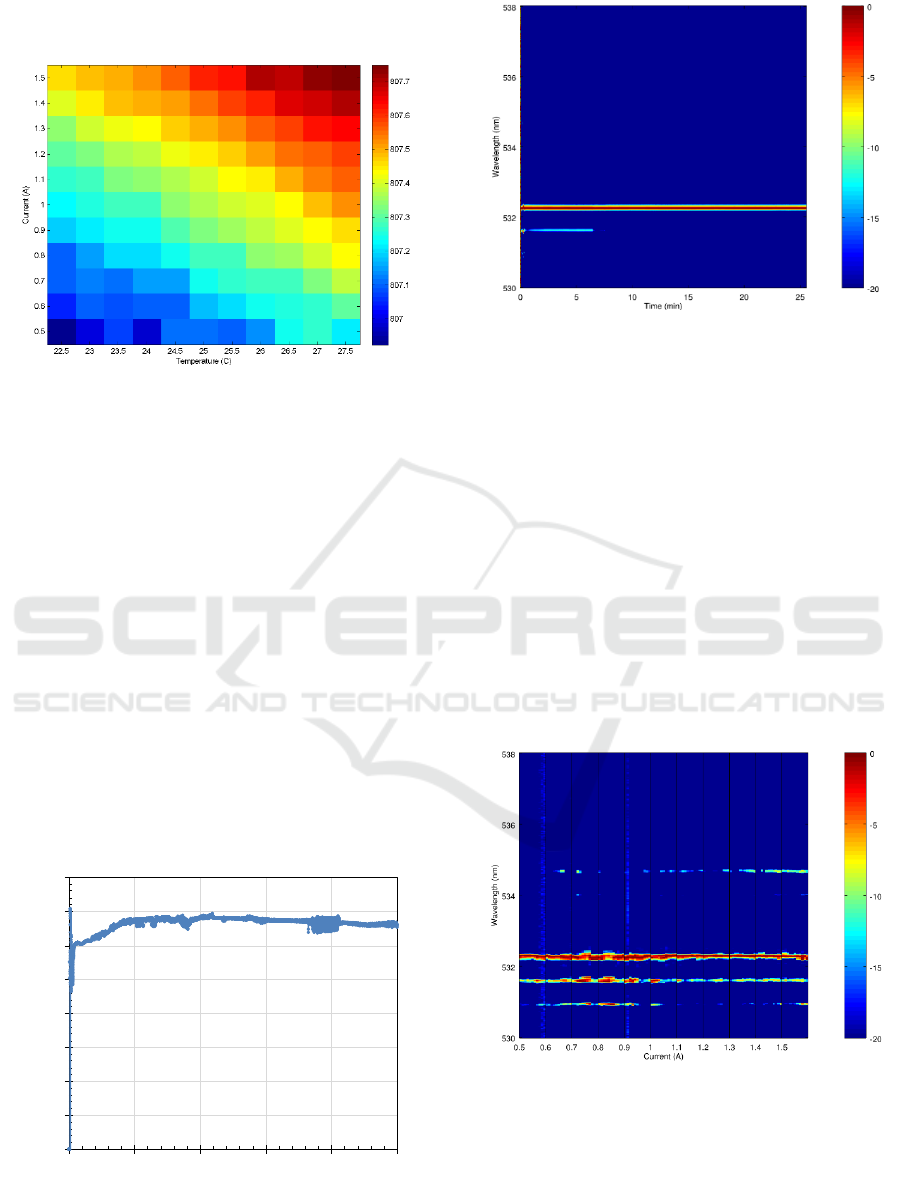
Figure 7: PLD peak wavelength (nm) 2D map from RLM
FM LD1.
3.2 Stability Results
After pre-selecting the potential setpoints, a fine
characterization is made around them and stability
measurements are taken. For that, each laser is
switched on at its setpoint and optical output power
(Figure 8) and spectrum (Figure 9) are recorded.
4 FLIGHT SPARE OPTICAL
TEST CAMPAIGN
For the Flight Spare model (FS), the campaign
followed the same strategy as in the FM, with the aim
of finding the working setpoints that met the spectral
requirements as well as the optical power and
stability.
Figure 8: Optical output power stability measurements
RLM FM LD1.
Figure 9: Spectral performance stability close to main peak
from RLM FM LD1, in normalized power density (dB/nm).
4.1 Characterization Results
An extended characterization RLM FS was
performed sweeping in temperatures (from 22.5ºC to
27.5ºC) and feeding currents (from 0.5A to 1.5A).
Optical power was recorded in every temperature-
current setpoint, as well as feedback photodiode
values. After that, this test was repeated saving both
optical power and spectrum by means of a beam-
splitter.
An example of spectrum performance from RLM
FS LD2 characterization can be seen in Figure 10.
These values, combined with the ones obtained in
optical power performances (Figure 11), give us the
key to select an appropriate setpoint.
Figure 10: Spectral performance close to 532nm in
normalized power density (dB/nm) from RLM FS LD2.
0
5
10
15
20
25
30
35
40
0 5 10 15 20 25
OpticalPower(mW)
Time
(
min
)
Characterization Procedure of the Flight Laser Modules for the ExoMars Raman Laser Spectrometer
111
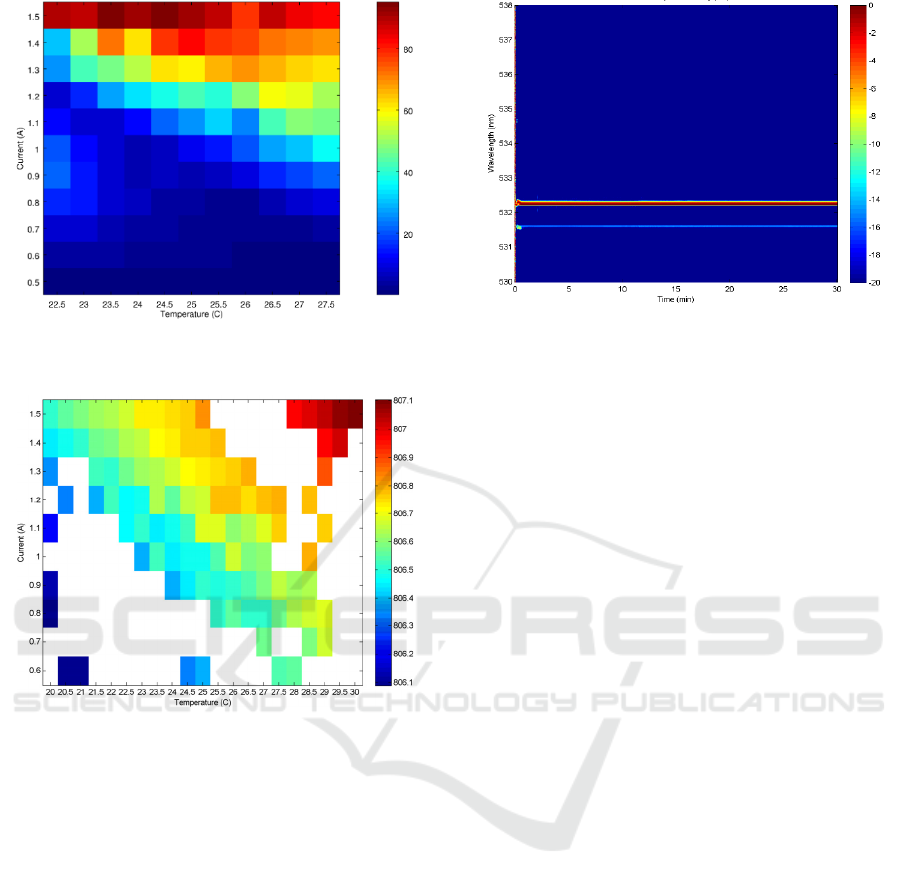
Figure 11: Optical output power (mW) 2D map from RLM
FS LD2, estimated from beamsplitter.
Figure 12: PLD peak wavelength (nm) 2D map from RLM
FS LD2. Blank data correspond to low SNR spectral signal
at PLD emission wavelength.
The characterization test was repeated, but this
time from 20ºC to 30ºC to explore a wider
temperature range. Figure 12 represents PLD peak
wavelength from the recorded spectra. White areas
are due to improper Gaussian fitting in the calculation
of PLD peak position due to a low SNR. Expressions
relating the PLD peak wavelength with the
temperature and feeding current are calculated from
the represented values.
4.2 Stability Results
In the same way as in the FM characterization
campaign, once a preliminary setpoint was selected,
the repeatability of the performance of both LDs was
checked, as well as stability behaviour (Figure 13).
Figure 13: Spectral performance stability close to main
peak from RLM FS LD2, in normalized power density
(dB/nm).
5 CONCLUSIONS
The characterization campaigns of the Raman
instrument’s laser flight models comprised a series of
tests dedicated to identify the working points where
the laser complied with the required performances.
For this purpose, an optical and spectral
characterization was performed, making a sweep in
temperature and current to identify the areas in which
each laser could give the necessary optical power and
an adequate spectral behaviour. In addition, once the
setpoints had been selected, additional measurements
were performed to assess the spectral and power
performance stability over the foreseen Raman
measurement time.
With these tests, it was possible to obtain a
detailed record of the behaviour of flight models in a
wide range of temperatures and currents, as well as to
determine the appropriate working setpoints to meet
the requirements for both lasers in each Raman Laser
Module.
ACKNOWLEDGEMENTS
This work has been funded by the Spanish MINECO
(Ministerio de Economía y Competitividad) through
ESP2014-56138-C3-1-R project.
REFERENCES
Beegle, L., Bhartia, R., White, et al. (2015). Sherlock:
Scanning habitable environments with Raman and
luminescence for organics and chemicals. In
PHOTOPTICS 2020 - 8th International Conference on Photonics, Optics and Laser Technology
112

Proceedings of the IEEE Aerospace Conference (pp. 1-
11). Big Sky, MT, USA.
Ciminelli, C., Del'Olio, F., & Armensie, M. (2016).
Photonic sensors and Instrument. Space, Advanced
Photonic Devices and Systems (pp. 180-185). London,
World Scientific.
ESA. (accessed on 18 October 2019). Robotic exploration
of Mars. Obtained from ExoMars Mission (2020):
https://exploration.esa.int/web/mars/-/48088-mission-
overview
ESA Scientific Exploration. (accessed on 18 October
2019). ExoMars. Obtained from Science Exploration:
http://www.esa.int/Science_Exploration/Human_and_
Robotic_Exploration/Exploration/ExoMars
European Space Agency (3 April 2013). The ExoMars
Rover Instrument Suite: RLS - Raman Spectrometer.
ESA.
Goesmann, F., Brinckerhoff, W., Raulin, F. et al. (2017).
The Mars Organic Molecule Analyzer (MOMA)
Instrument: Characterization of Organic Material in
Martian Sediments. Astrobiology (17), 655-685.
Mann, A. (accessed on 18 October 2019). The Mars Rovers.
Obtained from Space.com:
https://www.space.com/mars-rovers.html
Mars Exploration Program (accessed on 10 December
2019). Two Rovers to Roll on Mars Again: Curiosity
and Mars2020. Obtained from Mars Exploration
Program:
https://mars.nasa.gov/news/8567/two-rovers-to-roll-on-
mars-again-curiosity-and-mars-2020/?site=msl
Moral, A., Rull, F., Maurice, S., Hutchinson, I., Canora, C.
et al. (2018). Raman Laser Spectrometer for 2020
ExoMars Mission: Engineering and qualification model
capabilities and future activities. 49th Lunar and
Planetary Science Conference. LPI No.2083.
NASA (accessed on 18 October 2019). Mars 2020 Mission.
Obtained from NASA: https://mars.nasa.gov/
mars2020/
NASA Science. (accessed on 18 October 2019). Mars
Curiosity Rover. Obtained from Mars Exploration
Program: https://mars.nasa.gov/msl/spacecraft/instru
ments/chemcam/
Rull, F., Martínez Frías, J. (2006). Raman spectroscopy
goes to Mars. Spectroscopy Europe,18 (1), pp. 18 - 21.
Rull, F., Maurice, S., Diaz, E., Tato, C., & Pacros, A.
(March 2011). The Raman Laser Spectrometer (RLS)
on the ExoMars 2018 rover mission. In Proceedings of
the Lunar and Planetary Science Conference, 42, pp. 7-
11. TheWoodlands, TX, USA.
Rull, F., Maurice, S., Hutchinson, I., et al (2017). The
Raman Laser Spectrometer for the ExoMars Rover
Mission to Mars. Astrobiology (17), 627-654.
Vago, J., Westall, F., Coates, A., et al. (2017). Habitability
on Early Mars and the Search for Biosignatures with the
ExoMars Rover. Astrobiology (17), 471-510.
Wiens, R., Sylvestre, R., & Perez, F. (2017). The
SuperCAM remote sensing instrument suite for the
Mars 2020 rover mission: A preview. Spectroscopy
(32), 50-55.
Characterization Procedure of the Flight Laser Modules for the ExoMars Raman Laser Spectrometer
113
