
AnnoXplorer: A Scalable, Integrated Approach
for the Visual Analysis of Text Annotations
Martin Baumann
1 a
, Harutyun Minasyan
2 b
, Steffen Koch
1 c
, Kuno Kurzhals
3 d
and Thomas Ertl
1 e
1
Institute for Visualization and Interactive Systems, University of Stuttgart, Stuttgart, Germany
2
Department of Computer Science, University of T
¨
ubingen, T
¨
ubingen, Germany
3
Institute of Cartography and Geoinformation, ETH Z
¨
urich, Z
¨
urich, Switzerland
Keywords:
Visual Annotation Analysis, Visual Text Analysis.
Abstract:
Text annotation data in terms of a series of tagged text segments can pose scalability challenges within the
dimensions of quantity (long texts bearing many annotations), configuration (overlapping annotations or an-
notations with multiple tags), or source (annotations by multiple annotators). Accordingly, exploration tasks
such as navigating within a long annotated text, recognizing patterns in the annotation data or assessing dif-
ferences between annotators can be demanding. Our approach of an annotation browser deals with all of these
data and task challenges simultaneously by providing a continuous range of views on large amounts of com-
plex annotation data from multiple sources. We achieve this by using a combined geometric/semantic zooming
mechanism that operates on an abstract representation of the sequence of a text’s tokens and the annotations
thereupon, which is interlinked with a view on the text itself. The approach was developed in the context of
a joint project with researchers from fields concerned with textual sources. We derive our approach’s require-
ments from a series of tasks that are typical in natural language processing and digital humanities, show how
it supports these tasks, and discuss it in the light of the feedback we got from our domain experts.
1 INTRODUCTION
The analysis of text annotations is a ubiquitous ac-
tivity in many disciplines dealing with text analysis,
such as natural language processing or digital human-
ities. We understand a text annotation as a piece of
meta information that links a list of labels or tags,
chosen from a small tag set, to a segment of text, that
is to say a sequence of words or tokens. Such text
annotation data can pose severe scaling challenges
within multiple complexity dimensions. First, the an-
notated texts can be long, up to hundreds of thou-
sands of tokens, and bear annotations in similar or-
ders of magnitude – this dimension we denote by the
term quantity. Second, there may be multiple annota-
tors, human or algorithmic, who may disagree in their
assessment – this dimension we denote by the term
a
https://orcid.org/0000-0001-7584-5938
b
https://orcid.org/0000-0002-8297-9122
c
https://orcid.org/0000-0002-8123-8330
d
https://orcid.org/0000-0003-4919-4582
e
https://orcid.org/0000-0003-4019-2505
source. And third, the annotations themselves can be
complex, they may contain multiple tags, their seg-
ments may overlap or be of greatly varying length –
this dimension we denote by the term configuration.
To support users in exploring annotations in a scalable
way, we propose a novel visual interactive approach.
A typical task in an annotation project is to ana-
lyze the disagreement between the contributing anno-
tators in order to refine and disambiguate the team’s
annotation guidelines. A related task is to compile a
“gold standard” from these disagreeing contributions.
Such a gold standard of an annotated text can then be
used to train and test a machine learning algorithm for
the automatic generation of annotations. In turn, the
annotations generated this way on further texts can
be compared to the annotations generated by com-
peting algorithms in order to assess systematic differ-
ences. Analysts may also appreciate the annotators’
disagreement as an indication of textual complexity
that warrants further investigations regarding possi-
ble patterns in the annotation data set and how these
patterns may relate to the source text. Common to
these tasks is that they involve a comparison of possi-
62
Baumann, M., Minasyan, H., Koch, S., Kurzhals, K. and Ertl, T.
AnnoXplorer: A Scalable, Integrated Approach for the Visual Analysis of Text Annotations.
DOI: 10.5220/0008965400620075
In Proceedings of the 15th International Joint Conference on Computer Vision, Imaging and Computer Graphics Theory and Applications (VISIGRAPP 2020) - Volume 3: IVAPP, pages 62-75
ISBN: 978-989-758-402-2; ISSN: 2184-4321
Copyright
c
2022 by SCITEPRESS – Science and Technology Publications, Lda. All rights reserved
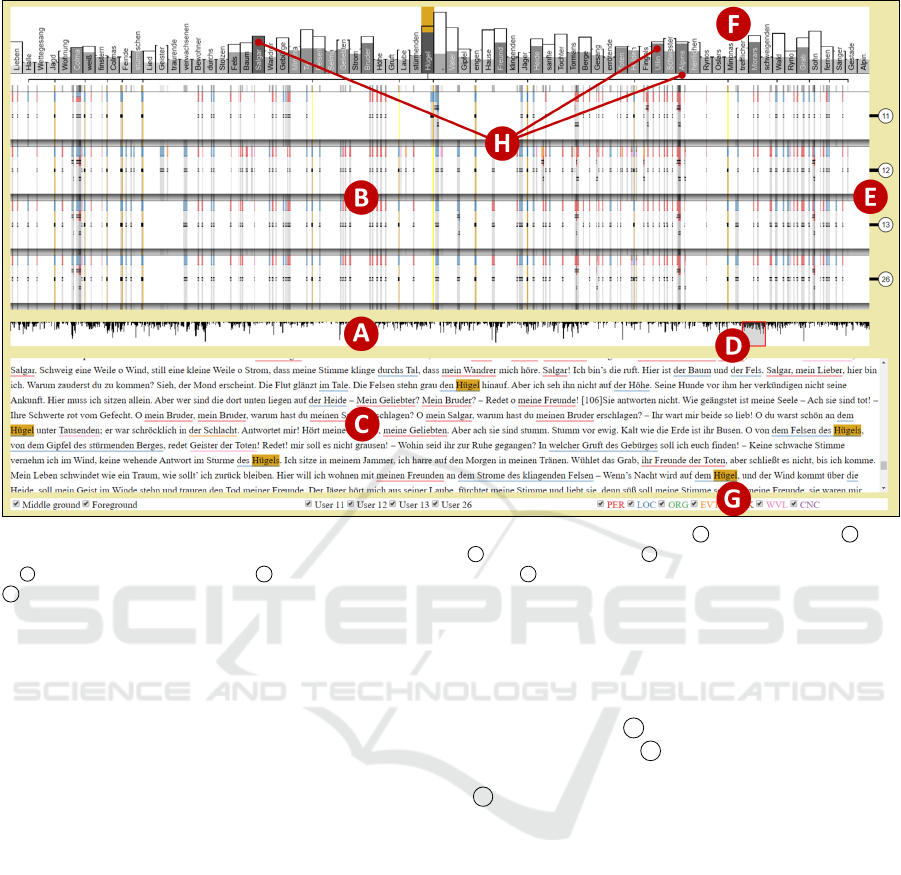
Figure 1: AnnoXplorer with Goethe’s Die Leiden des jungen Werthers. The overview window A with the brush at D . The
annotation window in transit mode with four annotator bands at B , the annotator IDs at E , the annotated type’s distribution
at F , and a series of name types at H (see Section 5). The text window C with underlined annotations. The filter controls at
G . Interaction: Hovering on the type bar “H
¨
ugel” highlights the respective tokens in the annotation and text windows.
bly complex annotation constellations (configuration)
across annotators (source) and/or across the sequence
of the text’s tokens (quantity).
The data set that we use in the following to ex-
emplify our approach was created by a group of hu-
manities researchers in the context of a joint research
project (see Section 3) with partners from several text-
related humanities disciplines and from natural lan-
guage processing. The data set (see Section 5) con-
tains about 6500 annotations of text entities such as
characters or locations. It was crafted by four human
annotators on a text of about 42 000 tokens. The anno-
tation guidelines allowed for multiple tags and over-
lapping segments. While this source text is quite short
and annotations are rather sparse, the process of gen-
erating it manually was already challenging and ex-
pensive. However, by means of combining these ba-
sic annotations, one may now be able to operational-
ize complex text phenomena. Hence, as Fort (2016)
remarks, the relevance of such a data set can outlive
the context – together with its specific questions – in
which it was originally created. Therefore, its value
often exceeds the cost of its creation, and methods to
explore such text annotation data and to simultane-
ously analyze as many of their facets as possible help
to exploit this value.
Our contribution to deal with data sets and analy-
sis tasks like those sketched above is an approach to
visually and interactively browse text annotations. As
it can be seen in Figure 1, our browsing approach
consists of three interconnected views: an overview
of the whole text A , a view upon a portion of the
marked text strings C , and an abstract representa-
tion of the annotation data in any granularity desired
B . The latter constitutes the main component, and
it shows the data simultaneously in two dimensions:
vertically across all contributing annotators and hori-
zontally across the whole token sequence of a freely
selected passage of the underlying text. Our approach
is novel in that it transcends the current state of the art
with respect to the following qualities. It is:
Scalable with respect to the data type’s complex-
ity dimensions of quantity, configuration, and source.
The core concept we employ here is a combined geo-
metric/semantic zooming mechanism that governs all
other aspects of representation and interaction.
Integrated in that it deals with all of these complex-
ity dimensions simultaneously. While existing ap-
proaches do consider some of these dimensions, none
of them encompasses all of them at the same time.
After our literature review in Section 2, where we
situate our approach in the context of current re-
search, we conduct a task- and requirement analysis
AnnoXplorer: A Scalable, Integrated Approach for the Visual Analysis of Text Annotations
63

in Section 3. Based on this analysis, we expound
in Section 4 the decisions we took in order to design
the visual representations and interaction facilities of
our approach. We then demonstrate in Section 5 its
versatility by sketching some paths of usage dealing
with the tasks laid out before and the data set provided
by our project partners. These partners accompanied
the development of the approach in a series of work-
shops, and their feedback is discussed, together with
our own observations, in Section 6. Based on this dis-
cussion, we make a series of suggestions for future
work in Section 7. Here, we also point to the generic
nature of our approach: While we do assume in this
paper, that the sequentially arranged things that are
annotated are a text’s tokens, the approach has the po-
tential to be applied to structurally similar data types
such as annotated gene or event sequences.
2 RELATED WORK
Today, visual text analysis can be seen as an es-
tablished subfield of research in information visual-
ization and visual analytics as recent surveys docu-
ment (Kucher and Kerren, 2015; Liu et al., 2019).
Many of the approaches in this area were developed
with the goal to abstract texts and document sets by
either summarizing their content, or by aggregating
available meta data or bibliographic information and
combinations thereof. Without a doubt, this is a good
general direction in order to support “overview first”-
approaches (Shneiderman, 1996) in the context of re-
trieval and text mining tasks, which are important
enough to support them with visual exploration tech-
niques, such as (Wise et al., 1995; Choo et al., 2013;
Alexander et al., 2014; Strobelt et al., 2018).
With very few exceptions, such as (Wattenberg
and Vi
´
egas, 2008; Culy and Lyding, 2010; Abdul-
Rahman et al., 2017; Geng et al., 2013; Albers Szafir
et al., 2016; Alexander et al., 2014), most text visual-
ization approaches have in common that they do not
represent the sequential nature of larger segments of a
text at higher levels of visual abstraction. This is due
to the fact that either tasks for document sets are sup-
ported or the sequential representation of text would
require too much screen space to be effectively inte-
grated into respective visualization concepts. As soon
as tasks are to be supported that involve the analysis
of textual properties in the context of the text itself,
however, using representations of the sequential char-
acteristic of textual data is essential.
Of course, sequential data can be compressed as
well if common characteristics within a text should
be made explicit. Oelke et al. (2012) present pixel-
based visualization techniques called “Literature Fin-
gerprinting” (Keim and Oelke, 2007), which fall into
this category and have been applied to readability
analysis. The main idea here is to bin sequences of
text tokens and to represent characteristics for these
sequences – such as the occurrence of named enti-
ties or a readability measurement – as colored pixels.
With our approach, we support more fine-granular
drill down possibilities to understand patterns of an-
notations on levels of abstraction that lie in-between
visual binning and plain text views. However, we also
make use of visual binning (Jerding and Stasko, 1998)
as soon as zooming out requires the subpixel repre-
sentation of annotations.
There are also a number of works that address vi-
sualization goals similar to ours in terms of show-
ing and exploring annotations at different abstrac-
tion levels. Correll et al. (2011) present an approach
that supports scholars in exploring densely annotated
texts. They enhance the scalability by employing a
focus+context approach to minimize contexts of less
importance with respect to the chosen focus and by
allowing to filter dense occurrences of interesting an-
notations by means of a line chart based abstraction.
In the NEREx approach, El-Assady et al. (2017) ana-
lyze named entities by combining a text with annota-
tion highlights, an abstraction of the texts sentences as
lines together with the annotated entities as sequences
of glyphs, and a series of node link diagrams that
encode relational aspects of the entities. Gold et al.
(2015) combine a distant view upon higher-level the-
matic structures with close views upon the text itself.
They visualize lexical episodes as colored bars next
to a text view that allows for semantic zooming. The
VarifocalReader approach (Koch et al., 2014) is close
to ours in that smooth transitional interactions be-
tween overview and detail views are supported. How-
ever, VarifocalReader does not aim at preserving a
consistent representation over different levels of ab-
straction, which we see as an important benefit of our
approach for the depicted tasks. Chandrasegaran et al.
(2017) present in their visual analytics approach for
the support of open coding of natural language texts a
series of interconnected views, that closely resemble
some of the views we will present: a text view with
highlights on tokens, a series of overviews showing
meta data in the whole text and an interactive word
cloud. They also use similar means of view coordina-
tion, allowing the synchronization of positional and
pattern information across views. However, they nei-
ther offer a continuous range of granularities for the
annotation abstractions, nor visual support for the dis-
play of multiple annotators.
In the following, we discuss a few fully fledged
IVAPP 2020 - 11th International Conference on Information Visualization Theory and Applications
64

text annotation tools which, of course, can also be
used to browse previously made annotations. We con-
sider them under the aspect to what extent they sup-
port, by visual and interactive means, the analysis of
annotation data in the three complexity dimensions
of quantity, configuration and source. The CATMA
annotation tool uses stacked, colored underlines to
encode annotations within the running text (Meister
et al., 2016). Its line spacing can be stretched in order
to make room for overlapping annotations or anno-
tations with multiple tags whose segments can even
be discontinuous. The Glozz annotation tool, like
most of its competitors, uses highlights on the text
to encode annotations (Widl
¨
ocher and Mathet, 2012).
Overlapping segments are shown as overlapping high-
lights – an approach that does not scale as well as
CATMA’s stacked underlines. An uncommon feature
is the aligner view of Glozz. Here, different annota-
tors are arranged in a series of rows, and their anno-
tations are strung as colored bars on a line that repre-
sents the text. Quite a unique idea for the encoding of
annotations is followed by the design study of Kley-
mann et al. (2018). Besides using an underlined text,
they encode each annotation as a glyph consisting of a
vertical bar (representing the text), and a colored hor-
izontal bar (representing the tag, the segment length
and the position of the annotation). These glyphs can
be arranged freely on a canvas, and upon hovering,
a tooltip shows the immediate surrounding text. Fur-
ther examples of annotation tools employing similar
means would be ANALEC (Landragin et al., 2012), or
WebAnno (Eckart de Castilho et al., 2016).
Table 1: Feature comparison of annotation approaches.
# = unsupported, G# = partially supported, = supported.
Column labels: Range = continuous range of granularities,
Annot. = comparison of multiple annotators, Config. = seg-
ment overlap or multiple tags, Text = interconnected text
view, Token = distribution of annotated tokens, Edit = cre-
ate and change annotations.
Range
Annot.
Config.
Text
Token
Edit
Correll 2011 G# # # # #
Glozz 2012 G# G# G#
Landragin 2012 # # G#
Varifocal Rd. 2014 G# # # G#
CATMA 2016 # #
WebAnno 2016 # G# G# #
Chandraseg. 2017 G# # # G#
NEREx 2017 G# # # G#
Kleymann 2018 G# # # # #
AnnoXplorer 2020 #
Next, let us mention a few examples dealing with
the display of annotation data on sequences other than
natural language text. Quite closely related are ap-
proaches concerned with formal languages, such as
the early software statistics visualization approach
Seesoft (Eick et al., 1992). Genome data is dealt
with by the LayerCake tool by Correll et al. (2015)
or the Sequence Surveyor by Albers et al. (2011). An
approach dealing with event sequences is EventFlow
by Monroe et al. (2013). Finally, time series are one
of the data types that the “stack zooming” approach
by Javed and Elmqvist (2013) can cope with.
In Table 1, we list those of the approaches above
that deal with natural language annotations and that
support tasks similar to those laid out in Section 3.
We compare them in terms of how well they support
these tasks by a few but essential visualization fea-
tures. Furthermore, we would like to point out that
parts of our approach were presented as a conference
poster (Baumann et al., 2018).
3 TASKS AND REQUIREMENTS
As mentioned in the introduction, our approach was
built in the context of an interdisciplinary research
project with partners from several text-related fields.
This project, situated at the University of Stuttgart,
is called CRETA, Center for Reflected Text Analyt-
ics (Kuhn, 2019). The participating scholars manually
annotated texts of different types and from different
domains. For example, a group of medievalists an-
notated characters and places in medieval epics, phi-
losophy scholars annotated concepts in contemporary
philosophical texts, social scientists annotated named
entities of different types in a corpus of political de-
bates, and literature scholars did the same for 18th
century novels. Common to these projects was that
an annotation typically consisted of a short segment
of text (not more than around five tokens) that were
marked with possibly multiple tags from a small tag
set (at most seven) by multiple annotators. In a se-
ries of joint workshops, we collected a set of analy-
sis tasks that our partners would like to perform on
their data. For a demonstration of our approach on
this data/task-set see Section 5. We augmented this
set further with tasks that we deem users in a similar
project setting presumably may want to perform and
that could be supported by a visual browser.
We would like to stress the fact that, at its present
development stage, AnnoXplorer is not a tool to cre-
ate or alter annotations (like some of the fully-fledged
annotation tools presented in Section 2), but that it is a
visual browser that helps to explore complex annota-
AnnoXplorer: A Scalable, Integrated Approach for the Visual Analysis of Text Annotations
65

tion data. AnnoXplorer allows this exploration simul-
taneously across all contributing annotators as well as
across the whole token sequence of a freely selected
passage of the underlying text, with the goal to tackle
the following series of tasks:
T1 Gain a Quick Overview: Who (which annotator)
annotated how (which tags), what (which text seg-
ment), and where (in which passage)? Quickly iden-
tify passages that are sparsely or densely annotated.
T2 Compare Annotators: Spot passages where
there is a strong (dis-)agreement among the different
annotators. Identify inconsistencies between annota-
tors that hint at insufficient or ambiguous specifica-
tions in the annotation guidelines or at systematic dif-
ferences between annotation algorithms.
T3 Analyze Annotation Patterns: Identify patterns
with respect to the annotations’ extensions or tags,
per annotator or across multiple annotators, over the
course of the text’s token sequence. Explore struc-
tures that emerge from the interplay of annotations of
different length and/or with different tags.
T4 Analyze Tokens and Context: Analyze the
frequency- and position distributions of the most an-
notated tokens in selected passages and compare them
to the respective global values. Consider annotations
within the surrounding text of their segments.
In order to construct a visual browser that supports
these analytical tasks and that forms a sound basis
for further development, we suggest the following list
of design requirements. For certain tasks, certain re-
quirements are indispensable – like, as shown below,
R5 for T2 or R6 for T4. However, since we want to
be able to deal with annotation data that show all of
the complexities mentioned in the introduction simul-
taneously, all of these requirements play together to
carry out each of the above tasks. The requirements
are organized according to the complexity dimension
that they target predominantly: R1, R2, and R3 deal
mainly with quantity, R4, R5 and R6 deal mainly with
configuration, and R7 deals mainly with source com-
plexity. The decisions we made in order to design
and implement an approach that fulfills these require-
ments will be explicated in Section 4.
R1 Scalable Views: The approach should allow for
an aggregated view on a text of arbitrary length with-
out the need for scrolling as well as for a detailed view
upon a short selection of the text, where overlapping
chains of annotations and annotations with multiple
tags can be inspected. Furthermore, the user should
be able to display the data on any desired level of
granularity in between these poles.
R2 Continuity and Orientation during Zooming:
It should be possible to drill down through all of
these levels of granularity smoothly and swiftly, and
it should always be clear to the users which portion of
the data they are looking at and on which level.
R3 Maximality Principle and Filtering: On each
level of granularity, the approach should encode as
much information as possible on this level but with
the possibility to filter out data that is currently not of
interest. If elements need to be aggregated, it should
happen with the finest resolution at hand.
R4 Annotation Discrimination: In the detailed
view, users should be able to discriminate between
two series of annotations, all containing identical tags,
that cover the same range of tokens respectively, but
which split this range differently into single annota-
tions. Likewise, they should also be able to discrim-
inate between two sets of annotations with multiple
tags, all with the same token extension, that contain
the same set of tags, but which distribute this set dif-
ferently among the respective annotations.
R5 Overlap and Visual Weight: When annotations
overlap, users should be able to discern their text seg-
ments and tags for as large “chunks” of overlapping
annotations as possible – for a detailed description of
this concept see Subsection 4.3. The visual weight of
an annotation should be independent of the length of
the tokens that form its text segment, rather it should
depend only on the number of tokens involved.
R6 Token Distribution and Text View: The text
string, frequency and position of the annotated to-
kens should be shown, either directly (in close views)
or aggregated (in distant views). The annotated text
should always be at hand and be synchronized with
the current viewing position across all views.
R7 Multiple Annotators: It should be possible to
show the data of multiple annotators simultaneously.
Annotations by different annotators should be laid out
on a grid of tokens that is uniform across annotators,
such that they are immediately visually comparable.
4 APPROACH DESCRIPTION
To facilitate the exchange with our project partners,
we implemented the approach as a web-based appli-
cation using the D3 library (Bostock, 2019).
4.1 Basic Structure and Interaction
The approach combines an overview+detail technique
with a zooming technique in the sense of Cock-
burn et al. (2009). The combined semantic/geometric
zoom will be described in Subsection 4.2. The views
IVAPP 2020 - 11th International Conference on Information Visualization Theory and Applications
66

are distributed among three windows (see Figure 1):
the overview window in the middle A , above it the
annotation window B , and below it the text win-
dow C . We placed the overview window in the mid-
dle because the selection made here governs the rep-
resentation in the adjacent windows.
The overview window contains a bar chart repre-
senting the whole text. The units that are represented
by one of the one pixel wide bars are bins of tokens,
and the heights of these bars indicate how many of
such a bin’s tokens are part of an annotation segment.
Users can brush over these bars (see the red rectangle
at D ) to select a region of the text which will then
be displayed in the annotation window and focused
in the text window. A brush of a certain size always
corresponds to the same number of bins and roughly
to the same number of tokens. Besides pulling open
a new brush, users can also resize an existing brush
or center it around a new position by clicking on an
unbrushed spot in the overview window.
The annotation window contains a collection of
words and geometric objects (mostly rectangles)
which represent the selected tokens and the annota-
tions thereupon. As mentioned above, this selection
corresponds to the brush of the overview window,
but it can also be altered directly within the annota-
tion window by actions of zooming (using the mouse
wheel) and panning. The exact representation of the
annotation information depends on the amount of text
that is selected this way, as will be discussed in the
following sections. But there are a few structural as-
pects of this representation that are not dependent on
the extension of the selection:
• We can differentiate between vertical objects on
the one hand – elongated shapes which mainly
correspond to aspects of the text’s tokens and form
the basic grid of the window – and horizontal ob-
jects on the other hand – shapes spanning over
a range of vertical objects, which mainly corre-
spond to annotation segments (R5, R7).
• These objects are organized within three layers;
they can be seen in Figure 2, where the upper lay-
ers are partially hidden in order to better show the
lower layers. We call them background A , mid-
dle ground B and foreground C .
• The (vertical) objects of the background and mid-
dle ground layers are concerned with counting an-
notations and they encode this information as val-
ues along a gray scale, whereas the (horizontal)
objects of the foreground are concerned with dis-
playing the segment extensions and tags of anno-
tations and employ a color encoding in doing so –
but this is only a rough characterization that will
be clarified in Subsection 4.3.
Figure 2: Cut-out of the annotation window with three an-
notators. The complete band of the first annotator (middle
ground and foreground layers) is hidden, such that only the
common background layer is shown at A . Also hidden is
the foreground layer in the band of the second annotator at
B . For the third annotator at C , four annotations can be
seen in the foreground layer.
• The objects in the middle ground and foreground
layers together represent the annotations of the re-
spective contributing annotators (human or algo-
rithmic) and are separated from the background
layer as a series of horizontal bands with a drop-
shadow effect (see also Figure 1 B ). The anno-
tators are identified by their IDs at E , and their
respective bands can be rearranged vertically by
dragging these IDs (R7).
• Embedded into the background layer and above
the annotators’ bands at F , there is a representa-
tion of the text’s words, which we will describe
in Subsection 4.4 (R6).
The text window contains the whole annotated
text. The passage that corresponds to the overview
brush is marked by not being grayed out and by con-
taining marks for the annotations, as we will discuss
in Subsection 4.5. The text and annotation windows
are interlinked in both directions by means of mouse
hover actions, and the highlights generated in this way
can be frozen.
Below the text window, there is a bar containing
the controls for filtering at G . Here, the user may se-
lect which annotators and tags should be shown and
whether to show the bands’ middle ground and fore-
ground (R3).
4.2 Zooming Modes
There are three major modes of representation with
respect to the number of tokens selected by the brush,
or, equivalently, the state of zooming (R1); hence-
forth, we call them atomic, transit and aggregated
mode (see Figure 3 for a juxtaposition of the modes).
• In atomic mode (see Figure 3a), the vertical grid
objects of the back- and middle ground represent
tokens. This case applies when the selection brush
is small enough such that all token rectangles con-
tained within it can be displayed with a minimal
AnnoXplorer: A Scalable, Integrated Approach for the Visual Analysis of Text Annotations
67
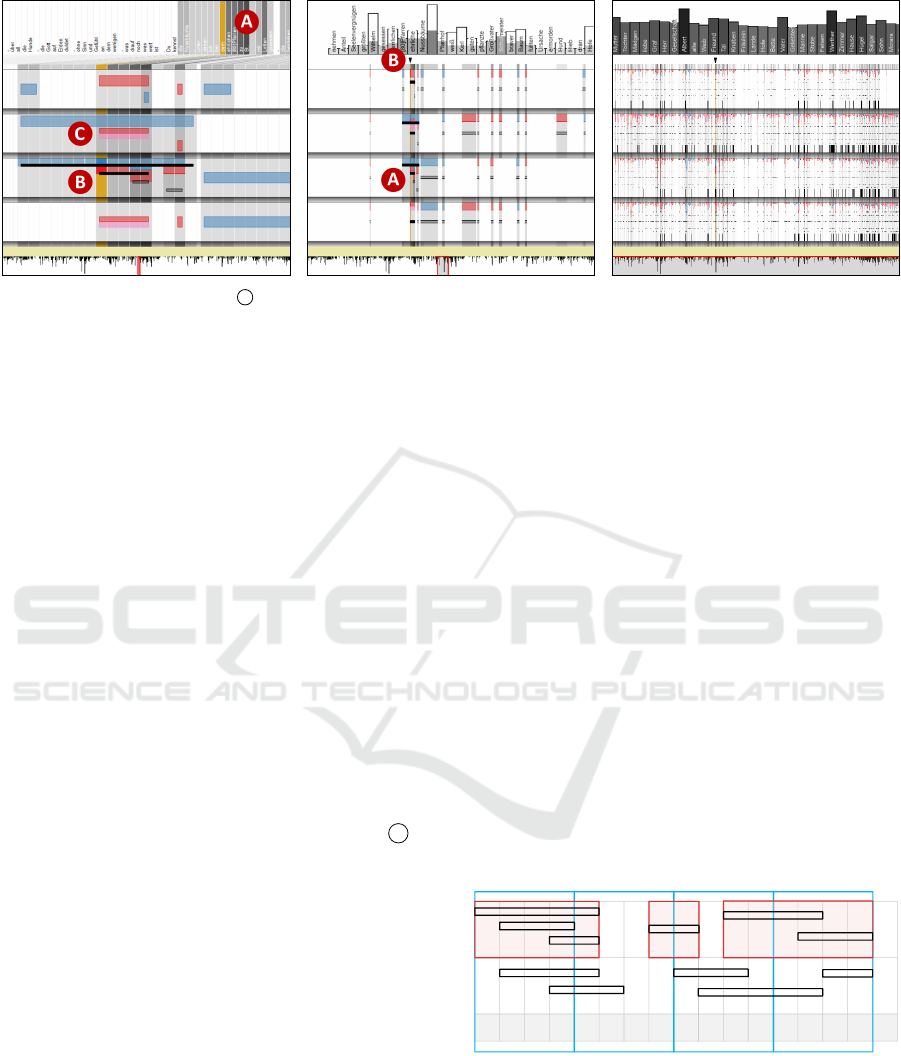
(a) Atomic mode. Hover at B
(b) Transit mode. Hover in text.
(c) Aggregated mode. Hover in text
Figure 3: Zooming out. A text passage containing the token “dem” (at yellow highlight / triangle) in the three zooming modes.
width – a threshold chosen such that the token
texts above are still legible (see Subsection 4.4). If
users zoom in even closer, tokens that are part of
an annotation get allocated more space than those
which are not.
• When users zoom out, there comes a point where
the width of a token falls below a legibility thresh-
old, and now transit mode applies (see Figure 3b).
Here, the displayed vertical objects still repre-
sent tokens, but notwithstanding whether they are
part of an annotation or not, they are of a uni-
form width between the threshold and one pixel.
Because of this potentially small width, the to-
ken rectangles are not framed anymore as in the
atomic mode and hence can no longer be dis-
cerned as discrete units. This also applies to the
bin rectangles in the aggregated mode described
below. To alleviate the recognition of very small
or thin objects like these token rectangles, users
can activate a geometric lens when they are in
transit or aggregated mode (see Figure 11 at B ).
• Finally, when users zoom out even more (namely
when more tokens are brushed than the tool
window’s width contains pixels), the aggregated
mode applies (see Figure 3c). Now the one pixel
wide rectangles in all of the three layers no longer
represent tokens but bins of tokens, whose sizes
(i.e. the numbers of items they contain) depend
upon the number of brushed tokens. These bins
are, in general, not identical to the bins displayed
in the overview window, but are of smaller size:
Every time the user changes the brush width, the
tokens contained in the selected bins are rear-
ranged in a sequence of new bins that are then
displayed in the annotation window (R3). In case
that the allocation of tokens to bins does not work
out evenly, the positions of those bins that contain
an extra token are distributed randomly following
a uniform distribution.
Within each mode, zooming/panning/brushing is
a continuous experience since only the selection and
size of the elements changes but not their mode of rep-
resentation (geometric zoom). The task we set our-
selves was how to design the representation of the
annotation information in the three modes such that
when users cross a mode border (semantic zoom), this
continuity would only be disrupted as little as possi-
ble, while at the same time making the modes clearly
distinguishable (R2), and encoding a maximum of in-
formation according to the specific requirements of
the respective mode (R3).
4.3 Annotation Representation
In this section, we will describe, layer for layer, how
the annotation data is encoded as the aforementioned
horizontal and vertical objects in each of the three
zooming modes. Most of the objects of the higher
layers are translucent such that they appear darker in
regions of high activity.
2
0 1 1 2
3 531
1 2 2 3 12 0 0
2 1
4 1 0 1
0 0
8/3
4/2
12
3 222
2 3 2 2
1 101
1 2 1 1
2 121
1 1 1 1
3/3 3/2
5/2
3/3
6/2
4/2
6
9
9
Annotator
1
Annotator
2
BG
Figure 4: Schematic example for two annotators (upper and
middle row). Chunks for annotator 1 (red highlights); bins
framed in blue. Annotation counts given per token (black
figures) and per bin (blue figures: annotation count/cut an-
notations). Lower row: counts for the background layer.
As mentioned in the previous section, in the
background and middle ground layers of the anno-
tation window, the vertical units represent tokens
IVAPP 2020 - 11th International Conference on Information Visualization Theory and Applications
68
(atomic and transit mode) or bins of tokens (aggre-
gated mode), and in their gray-scale values we encode
an annotation count. The mode of counting laid out
in the following is exemplified schematically in Fig-
ure 4. We say that a token carries (for example) five
annotations if this token is contained in the extension
of five annotations’ segments – they could be over-
lapping annotations by one annotator or annotations
by different annotators or a combination thereof. An-
notations with multiple tags contribute only once to
such a count. Now for the middle ground layer in the
atomic and transit mode, we count for each annotated
token how many (overlapping) annotations by the re-
spective annotator it carries; for the background layer,
these figures are summed up vertically over all users.
For a bin in aggregated mode, this procedure is done
for each of the bin’s tokens and then summed up hor-
izontally to get to the counts for the middle ground
(per user) and the background (total). All of these
counts are normalized and mapped to a gray scale.
In the foreground layer of the annotation win-
dow, the annotations’ main aspects are displayed. The
closer the user zooms in, the more details about these
aspects are shown. For the atomic and transit mode,
we show an annotation’s extension and tags, whereas
for the aggregated mode, where the token bins can cut
across annotation segments, we show, besides tag in-
formation, a count of these cut annotations.
Figure 5: Cut-out in atomic mode. Two chunks: the one on
the left with one annotation with three tags; the one on the
right with two annotations with five tags in total.
If there is ample space, that is if we are in atomic
mode and there is little overlap of annotation seg-
ments – such as shown in Figure 5 and Figure 3a at C
– an annotation is encoded as a horizontally stretched
rectangle spanning the vertical rectangles of the anno-
tation segment’s tokens. This rectangle is subdivided
into a series of vertically stacked sub-rectangles that
are colored according to the annotation’s tags. The
tag colors are chosen with colorbrewer (Harrower and
Brewer, 2003), using configuration “9-class Set1”.
They show up again in the text window highlights
(see Figure 1 C ), while the usage of colors for ele-
ments other than tags is kept to a minimum in order
to facilitate the visual detection of tag related phe-
nomena. There is a small gap between an annotation
rectangle’s left and right hand borders and the borders
of the respective token rectangles in order to be able
to differentiate between adjacent annotations with the
same tags (R4).
Now, for the problem of annotation overlap, we
introduce a new concept besides tokens and annota-
tions that we call chunks. A chunk shall be a chain
of annotations by a specific annotator that are linked
through their overlap (see Figure 4). Chunks cut
across the conceptual dichotomy between the verti-
cal token rectangles (that know about all annotators
and all overlapping annotations but only at their posi-
tion in the grid) and the horizontal annotation rectan-
gles (that know about all tokens within their segment
but nothing about other annotations). Within a chunk,
all annotation segments are ordered according to their
beginning and ending tokens and then their respective
rectangles are stacked according to this ordering.
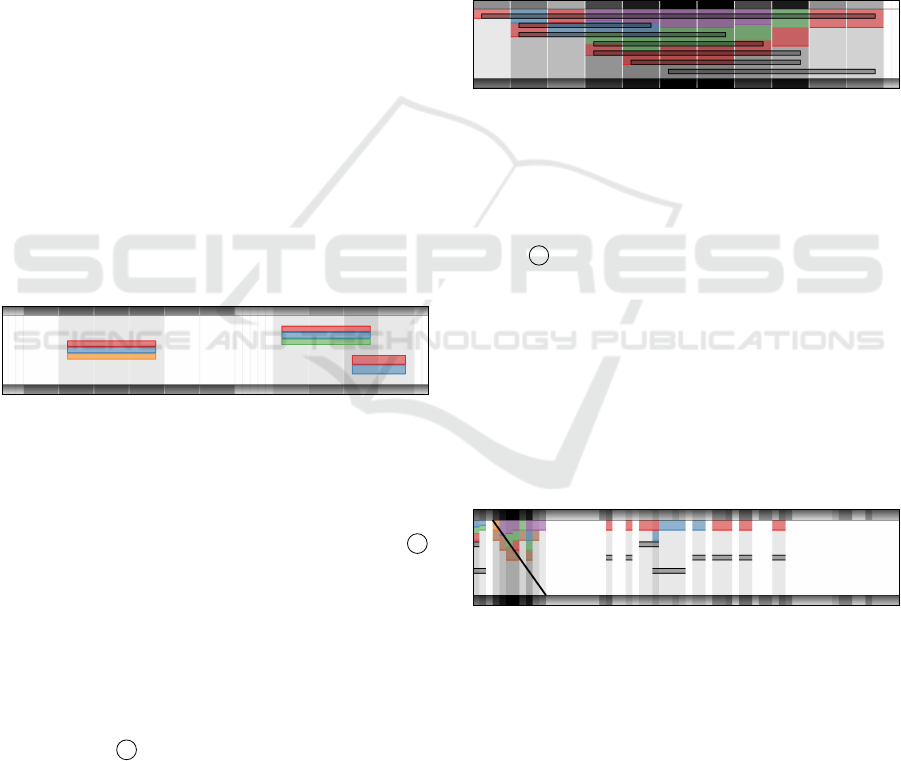
Figure 6: Cut-out in atomic mode. One chunk consisting of
seven annotations; four kinds of tags were assigned.
When a chunk is too large for the whole stack of
annotation rectangles to be displayed in the available
band height in the manner described above, the repre-
sentation of annotations is split (see Figure 6 and Fig-
ure 3a B ): Vertical colored bars, one on each token,
encode in their height the tokens’ respective annota-
tion count for this annotator. Furthermore, each of
these bars is subdivided uniformly into as many seg-
ments as there are tags involved in the annotations that
the respective token carries, and the segments are col-
ored accordingly. Above these bars, thin gray rectan-
gles (black, if hovered) indicate the annotations’ ex-
tensions. However, when the chunk is also too large
for the display of this stack of rectangles, it is repre-
sented by a diagonal line over the token bars.
Figure 7: Cut-out in transit mode. Nine chunks, with the
second too large for the display of the annotation stack.
Now, in transit mode (see Figure 7 and Figure 3b),
there are two differences with respect to the repre-
sentation of annotations in the foreground layer. For
one thing, the gap between the annotation- and the
token border is omitted for want of horizontal space.
For another thing, we apply only the split and more
compressed variant of the representations described
above, even in cases when the vertical space would
suffice to apply the other. While this decision results
in a slight loss of information, we made it for three
AnnoXplorer: A Scalable, Integrated Approach for the Visual Analysis of Text Annotations
69
reasons. First, the short width of the tokens in tran-
sit mode can lead to very short annotation rectangles,
and therefore we delegate the display of the tag- and
the extension information to two different objects lo-
cated at different parts of an annotator’s band instead
of cramming both into a very small area. Second,
this decision helps to more clearly visually distin-
guish between the atomic and the transit mode (R2).
And third, the intermixing of visual features from the
atomic and the aggregated mode (see below) within
the relatively short transit mode contributes to the
desideratum of visual continuity between the modes
(R2).
Figure 8: Cut-out in aggregated mode. The counting thresh-
old is four cut annotations.
Finally, in the aggregated mode (see Figure 8
and Figure 3c), we again find the colored bars of the
compressed representation variant in the foreground
layer, but now they indicate how many annotations
any of a bin’s tokens took part in and which tags were
involved. Above them, we encode the information
of how many annotation segments (up to a certain
threshold) cut the respective bin as a number of black
dots. Exceeding the counting threshold is indicated
by a black bar over the respective bin in the lower
part of an annotator’s band. Hence, instead of rep-
resenting a chunk’s overlapping annotation segments
– as the top-most, vertical rectangles did in the non-
aggregated modes – the black dots on top now rep-
resent a per-bin information. The information pro-
vided by the colored bars – that is the “amount of ink”
used in annotating within the respective bin (which,
even if substantial, may result from very few but long
annotation-segments) – can thus be compared with
the information provided by the black dots – that is
the local number of annotations (independent of their
respective length).
4.4 Tokens and Types
In the top part of the annotation window, we show the
words of the selected text passage (see Figure 1 F ).
To be more accurate: In the atomic mode, we show
its tokens in the succession that they appear in the
text, and in the transit and aggregated modes, we
show those of its types that are most frequently an-
notated and place them at positions that correlate to
the respective annotations. These tokens and types
react upon hovering (see the yellow highlights at Fig-
ure 3a A and Figure 9 A ), but this highlighting
mechanism will only be described in Subsection 4.5.
First, let us consider the situation in the atomic
mode (see Figure 10 A ). Here, as mentioned in Sub-
section 4.2, the small cardinality of the token selec-
tion allows for displaying all of these tokens’ strings
in a legible font size. They are placed vertically above
the annotators’ bands as part of the background layer.
The string rectangles are of equal width, and since
the width of the token rectangles below depends on
whether the token is part of an annotation segment
or not, the two parts are connected with a trapezoid.
As they are part of the background layer, the string
rectangles’ and the trapezoids’ lightness reflect the ac-
cording annotation count (see Subsection 4.3).
Table 2: The types’ data and representation. Row labels:
GT = global tokens, LT/B = local tokens/bins, ITP = ideal
type position, GTC = global type count, LTC = local type
count, TS = type string.
Data Representation
GT Token array (full text)
LT/B Token/bin array (sel.) Indicator ticks
ITP Med. local token-pos.
GTC An. counts (full text) Bar frame height
LTC An. counts (selection) Bar height & color
TS Lemma (Shortened) string
Second, in transit and aggregated mode (see Fig-
ure 9), the selected token range is too large for show-
ing each token’s string. Therefore, on the set of all to-
kens that are part of some annotation (and that are not
stop words), we create a partition by subsuming all
tokens that share a common lemma under this term,
generating a global type based on its array of global
tokens. (See Table 2 for an overview of these data
features and their representations.) For each type, we
then sum up the annotation counts of each of its to-
kens (global type count), and for each type that con-
tains tokens in the current token selection (a local type
and its sub-array of local tokens), we sum up the an-
notation counts of all of its local tokens (local type
count). In the aggregated mode, we furthermore com-
pute the local bins as those bins, that contain at least
one local token. Next, we sort the local types accord-
ing to first their local and second their global type
count and select from the top a number of types to
be displayed. This number is chosen such that the
type’s strings within the bars are of legible height.
The ideal middle position of the type bars is com-
puted as the median of the middle positions of all of
its local tokens or bins. We now go through the sorted
selection of types to be displayed and place each type
bar as closely as possible to its ideal position. The
IVAPP 2020 - 11th International Conference on Information Visualization Theory and Applications
70
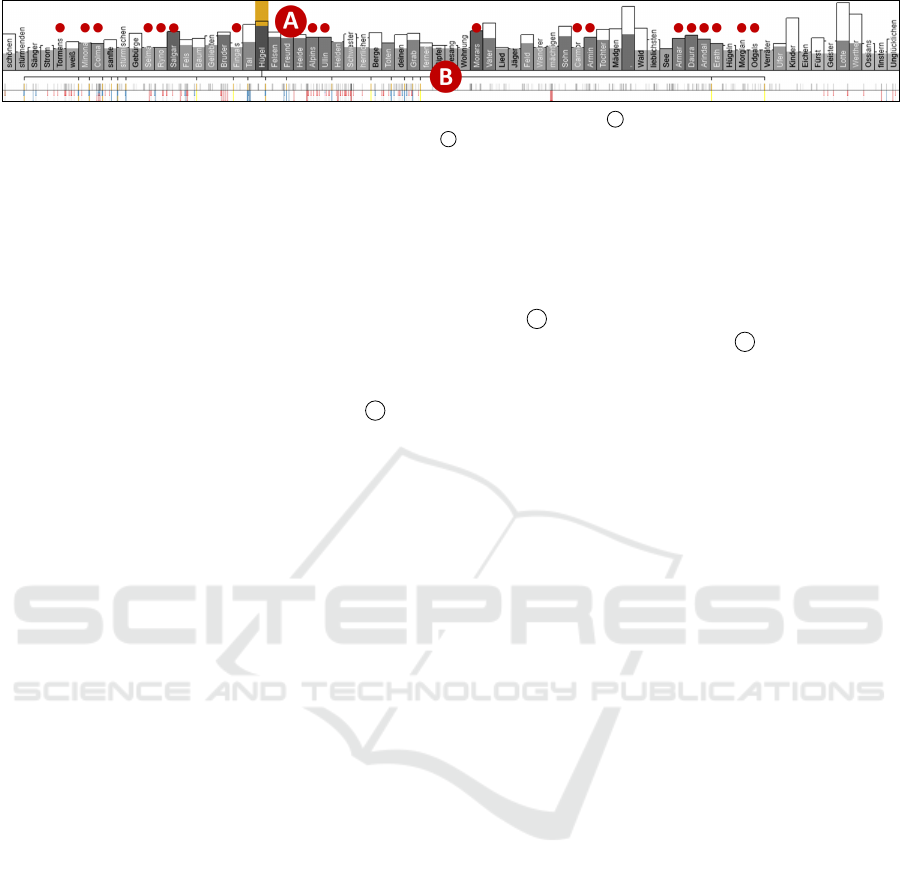
Figure 9: Types in aggregated mode. Interaction: Hover on “H
¨
ugel” to the left of A highlights the type bar and shows 20
local bin positions in the current text selection (tick marks at B ). Red dots (added for reference) mark names (see Section 5).
bars themselves are comprised of three elements: The
gray portion of the bar encodes in its height and in
its lightness the local type count. The black frame
(which contains a gap for long type strings) encodes
in its height the global type count. And finally, the
type string, which is shortened to an ellipsis for long
strings, is shown in a manner to provide maximal con-
trast: black on the white background and black or
white on the bar, depending on its gray value. (Hence,
white font indicates a local type count above some
threshold.) Finally, below the type bars at B , and
hence in the region where in the atomic mode the
trapezoids connect token string- and background rect-
angles, this task of connecting is now delegated to a
series of tick marks that indicate the number and po-
sition of a type’s local tokens or bins. These ticks,
together with their connecting bar, also appear only
upon the highlighting via mouse hover, that will be
laid out in the following section.
4.5 Text Window and Highlighting
In the text window, the text is shown together with
basic annotation marks. The portion currently not
selected is grayed out. To connect the text window
with the overview and annotation windows, we pro-
vide three basic mechanisms that we discuss in the
following: scrolling, highlighting and freezing.
The text window can be scrolled manually, but af-
ter altering the brush selection in one of the two win-
dows above, the most relevant portion of the text is
scrolled into view automatically.
The highlighting mechanism has, on the one hand,
a static part, namely the basic annotation marks on
the text tokens. Such a mark consists of an under-
line colored either according to the annotations’ tags
(if there is a unique tag) or black if there are multi-
ple tags in the annotations that this token carries. The
extension and borders of such an underline are de-
fined by the union of all annotators’ chunks’ exten-
sions. On the other hand, for the dynamic part of the
highlighting mechanism, there are a handful of means
we apply: All type-, token- or bin-based units can
be highlighted in a bright or dark yellow color (de-
pending whether they carry annotations or not), and in
the foreground layer, tag-colored units are highlighted
by making them fully opaque (or black). Similarly,
the tag-colors are used to highlight annotations in the
text, and the text underlines discussed above can be
extended to a frame in order to mark a chunk of anno-
tations. Finally, marks are used below the type band
in order to indicate where the current text position can
be found in the annotation window (triangle at Fig-
ure 3b B ), and where a type’s local tokens or bins can
be found (tick marks at Figure 9 B ).
Now as for the way these means are applied via
mouse hover, we can differentiate between doing so
on elements that are assigned to a specific annotator
and on elements that are not. For the latter, such as
the tokens in the text window, the token and types
in the annotator window, and the background layer
elements, all corresponding elements of all annota-
tors are highlighted. For the former, especially the
middle- and foreground elements in the atomic and
transit modes, we can discriminate the elements more
precisely, which allows for a drill down movement:
While hovering on a background rectangle highlights
all annotations of all users that this token carries
and only marks the respective text token as anno-
tated, hovering on a middle ground rectangle high-
lights only all annotations of one user that the token
carries and marks the token as well as the chunk in
the text, and finally, hovering on a foreground rectan-
gle (representing an annotation) highlights only this
single annotation and marks in the text the chunk as
well as the annotation (see Figure 10 and Figure 3a).
The last mechanism, which we call freezing, helps
with preserving highlights when switching interac-
tions. Say you read in the text window, come across
an interesting sequence of tokens and want to study
the passage more closely (zooming in) or in a larger
context (zooming out) without loosing this position.
Or say you see a term with a high local type count
and hovering reveals all respective local tokens, and
now you want to zoom in or out without loosing all of
these highlights. By clicking anywhere in the anno-
tation or text window, the currently highlighted ele-
ments are frozen in their current state. Hovering over
other elements may add further highlights. This state
is not lost by changing the selection or even by en-
tering into a different zooming mode. Only a second
click releases this frozen state again. An example for
this highlighting and freezing is given in Figure 10.
AnnoXplorer: A Scalable, Integrated Approach for the Visual Analysis of Text Annotations
71
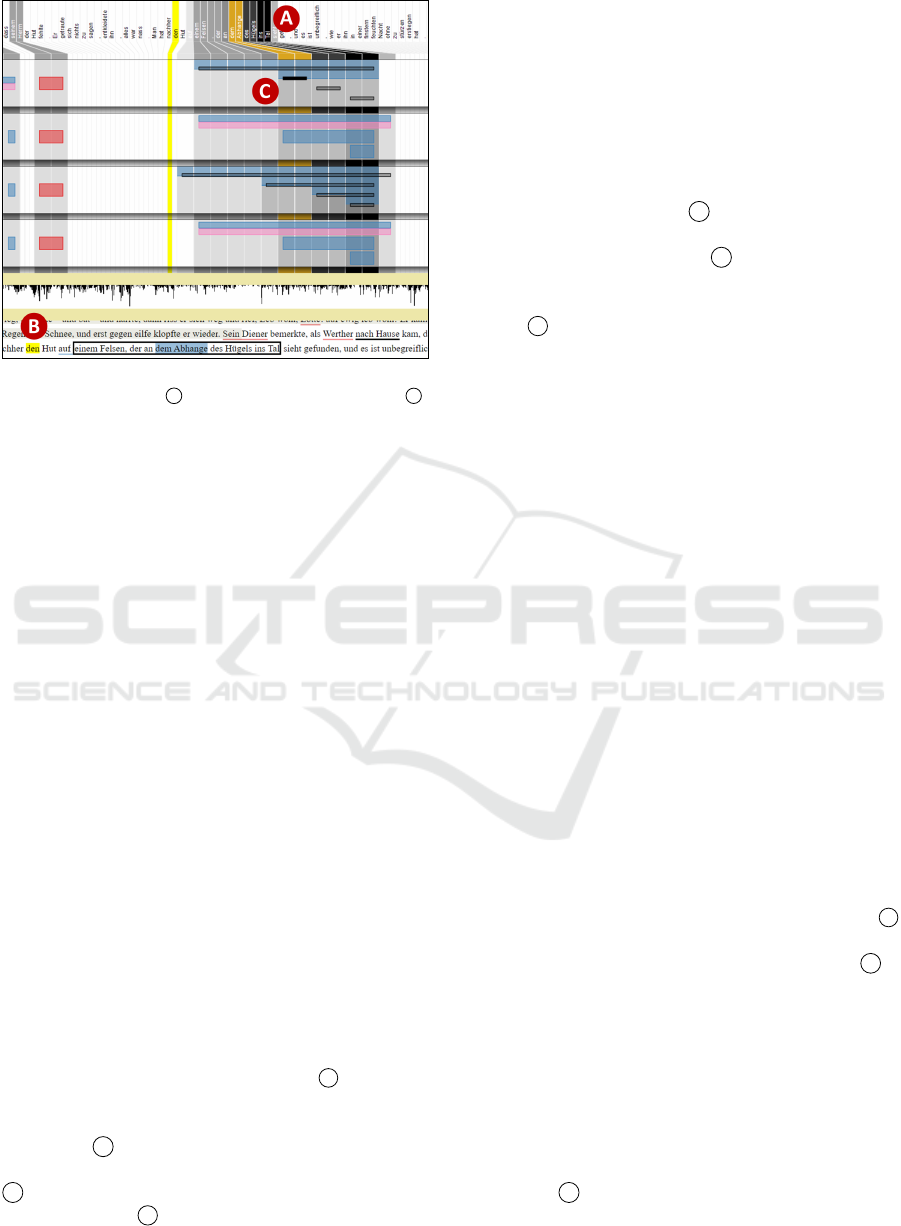
Figure 10: Highlighting and freezing interaction. Hover and
click the annotation at C , then hover the token “den” at B .
5 USAGE SCENARIOS
In order to demonstrate the advantages of our ap-
proach with a real-world example, we investigate the
data set mentioned in the introduction. The source
text is the 18th century novel Die Leiden des jun-
gen Werthers by Johann Wolfgang von Goethe. On
this, our project partners annotated textual entities
in the categories of “person”, “location”, “organiza-
tion”, “event”, “work”, and “concept”. While there
are automatic solutions to the detection of named en-
tities, their accuracy is often insufficient for the needs
of our project partners, especially when the text is
written in an older language variety than the corpora
that the algorithms were trained on. Hence, the man-
ual annotation and gold standard creation is also a
contribution to develop more accurate algorithms for
similar texts.
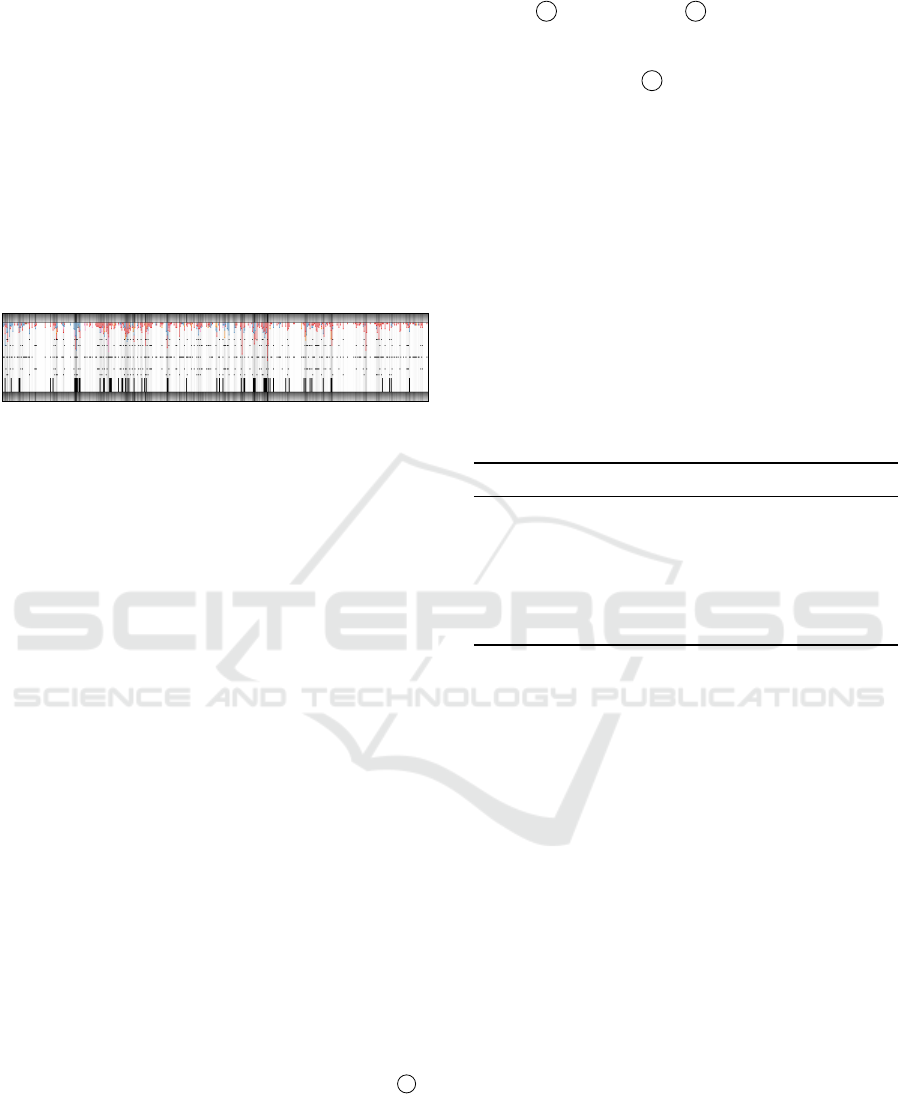
Annotator Comparison and Pattern Analysis:
First, we consider mainly the annotations’ tags and
extensions across different annotators. Looking at the
whole data set in aggregated mode (see Figure 11), we
immediately can see that mainly red (meaning “per-
son” or character) entities were annotated, an obser-
vation that coincides with the fact that the largest type
bars contain the names of the three main characters
“Lotte”, “Albert”, and “Werther” (see E ). Further-
more, it appears that annotator no. 11 annotated more
sparsely than the others, especially in the passage to
the left of A (T1). We also can see that there are
a few passages with very dense annotations (e.g. at
D ). By quickly inspecting them with the lens (by
right-clicking at B ), we identify those passages that
we want to have a closer look at and zoom in. Two
passages identified in this way are shown in atomic
mode in Figure 3a and Figure 10. In Figure 3a, be-
sides red character annotations there are blue “loca-
tion” annotations in a constellation with quite some
overlap and disagreement. In Figure 10, the annota-
tors disagree in their assessment of a series of nested
locations. The pink tags mark annotations for resub-
mission that annotators were unsure about while cre-
ating them. In Figure 3a, we can see from the dark
color in the background at A , that the location token
“St.” is the most annotated and hence most deeply
nested token. In Figure 10 at A , the same holds true
for the tokens “ins Tal” (“into+the valley”). In the
cases with a chunk size larger than three (e.g. at Fig-
ure 3a B ), we can hover over the reduced annotation
rectangles to show the respective tags as highlights in
the text, which disambiguates the allocation of tags.
Without going into further details about the annotated
text, we can see that there are some commonalities
between the two passages: In both, annotators no. 12
and 26 seem to more or less agree in their assess-
ment, and furthermore, they tagged annotations for
resubmission. In both, annotator no. 13 nested more
strongly, whereas annotator no. 11 opted to anno-
tate the entities more separatingly (T2, T3). These
findings can be summarized to formulate a hypothe-
sis about the annotators’ preferences, with the final
goal to further refine the project’s annotation guide-
lines. This hypothesis can be further supported by
first rearranging the annotator bands to bring annota-
tors no. 12 and 26 into immediate adjacency and then
sliding the brush through the overview window at dif-
ferent zoom levels, while keeping a close eye on the
respective passages in the text window.
Analysis of Annotated Token Distribution: Sec-
ond, we consider mainly the annotated tokens and
types and their context. We start with an overview
of the text in aggregated mode (see Figure 11). Hov-
ering over the largest type bars, we can see that for the
top three of them – the main characters’ names at E
– the annotations are spread all over the text; for the
fourth, however – the type “H
¨
ugel” (“hill”) at C –
the annotations are concentrated in a small region to-
wards the end, as the tick marks and yellow highlights
indicate (T1). We freeze these highlights by clicking
and zoom into a passage large enough to encompass
all “H
¨
ugel” occurrences except for a few outliers; it is
shown in transit mode in Figure 1. We can see here
that some of the most annotated types in this passage
are character names that appear almost exclusively in
annotations in this passage, like “Salgar”, “Alpin”, or
“Ullin” at H . Reading the respective passage in the
text window shows that it is part of a short embed-
ded narrative. We enlarge the brush slightly in the
IVAPP 2020 - 11th International Conference on Information Visualization Theory and Applications
72
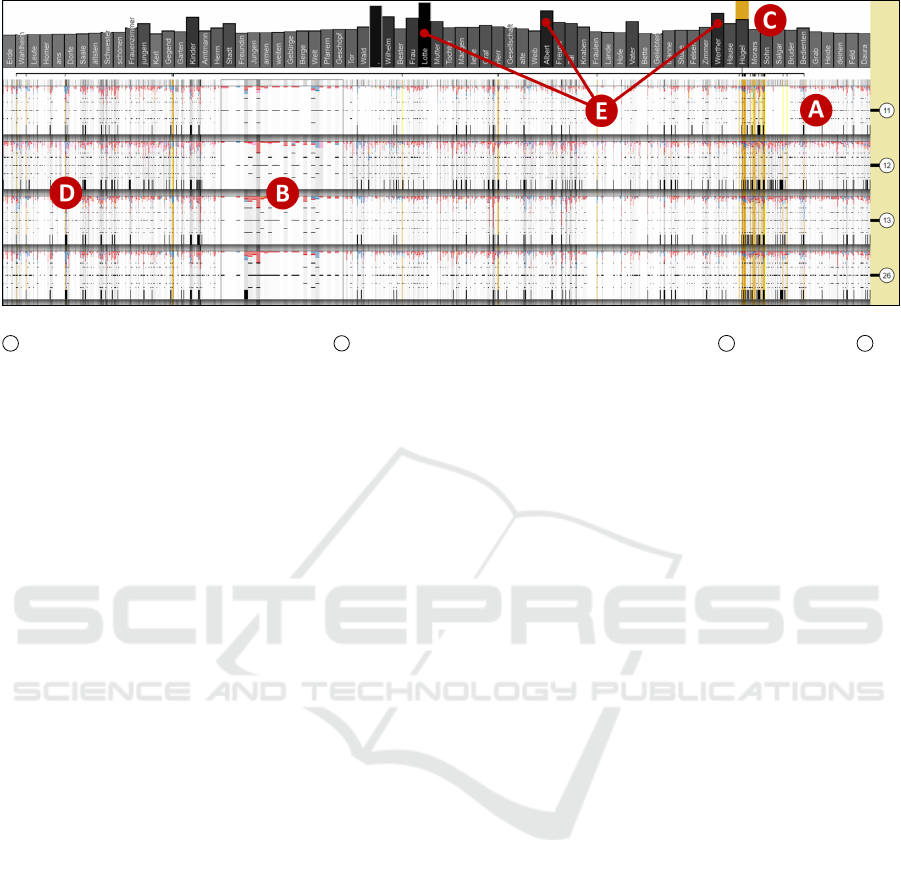
Figure 11: The Werther data set. Fully zoomed out annotation window in aggregated mode. Interaction: The type “H
¨
ugel” at
C is hovered and the highlights are frozen; at B , the lens is brought up. Sparse region to the left of A , dense region at D .
overview window, such that it contains the embedded
narrative, and can see in the corresponding type bars
a series of further character names, that were almost
exclusively annotated in this short passage, while the
main characters’ names do not show up at all (see red
dots in Figure 9). Furthermore, “H
¨
ugel” is still the
most annotated type here (T4). Based on these find-
ings, it is now an interesting task for an analyst to
consider the role that a hill or hills play in this em-
bedded narrative and how the remaining references to
hills in the rest of the text relate to that.
6 EXPERT FEEDBACK AND
DISCUSSION
As mentioned in Section 3, we developed our ap-
proach within the frame of an interdisciplinary re-
search project. In a series of workshops we got feed-
back from our domain experts about their needs re-
lating to their annotation tasks and could continually
incorporate respective features. The approach was as-
sessed favorably and our partners showed great inter-
est in deploying our tool within their annotation cam-
paigns. During a final workshop, a mixed group of
ten experts from several text-related fields – PhD stu-
dents, post doctorands, and professors – assessed the
tool, and we will sum up and discuss the most impor-
tant benefits, drawbacks and wishes they formulated.
As far as the negative feedback is concerned, our
partners remarked that an inexperienced user may find
it difficult to gather all information needed to get an
idea of the situation at hand. For some annotation
tasks with the need for many tags, we would run out of
tag colors quickly. Furthermore, it was remarked that
the way that the types feature is implemented – with
the bar position at the median of the local token/bin
positions – the bars may jump around upon moving
the brush, which makes it difficult to follow its evolu-
tion, for example with respect to the local type count.
Now, while we could mitigate this problem by apply-
ing animated transitions, the basic impression of some
turmoil and abruptness would remain, since it has its
cause in the general way that the type bars are posi-
tioned. This positioning, however, has its benefits for
the analysis, and they shine up during the inspection
of the static views. The decision to update the view
continuously during a brush move – instead of only
once after the brush end event – has consequences
also for other parts of the view. While it makes the
interaction more computationally expensive, it allows
the user to directly follow the evolution of annota-
tion aspects over the course of the text. The question
whether it would be better overall to offer a succes-
sion of discrete, static views (with respect to selection
actions) instead of continuous updates, would have to
be further investigated by means of a user study.
One of the most asked for features by the experts
was to be able to filter the displayed annotations for
tags or for agreement. In the version presented here,
this wish could at least be fulfilled with respect to the
tag filters. Another wish was to display structural fea-
tures of the text, such as chapter segments or lines for
poetic texts, also in the overview and/or annotation
window. Finally, they would also like to see the num-
bers computed, such as the local type count, not only
in a visual encoding but also explicitly via tooltips.
What the experts liked was for example how the
automatic scrolling feature of the text view facilitates
the navigation during their analysis tasks. Further-
more, they remarked that the visualization of overlap-
ping annotations would be well suited for displaying
nested structures like narrative levels.
Let us now discuss a few additional points of gen-
eral interest. A design feature that bears many con-
AnnoXplorer: A Scalable, Integrated Approach for the Visual Analysis of Text Annotations
73

sequences and warrants a critical review is the re-
binning in aggregated mode. As described in Sub-
section 4.2, we compute the bins anew each time the
brush selection is altered. While in doing so we ad-
here to our maximality principle (R4), we introduce
problems with the tool’s performance (some things
cannot be precomputed) and with global comparison
(there are no bins “outside” of the current selection).
Another problem arises with very long texts.
Namely we can run into the situation that the bins’
size in the overview window is larger than the thresh-
old below which we would enter atomic mode. Since
the overview’s brush rectangle cannot get smaller than
one pixel, we would be unable to reach the atomic
mode at all. This needs to be dealt with, and a remedy
might use ideas similar to the ones laid out in (Koch
et al., 2014) and (Javed and Elmqvist, 2013).
Finally, a fundamental decision is whether to show
the overview and annotation windows in landscape
mode, as it is now, or rotated by 90 degrees in por-
trait mode. While the latter would have the advantage
that the token and types would not have to be read
with a twisted neck and that the aspect ratio of the
text window would be more comfortable for reading,
the advantage of landscape mode is that the tokens are
arranged in a grid from left to right instead of top to
bottom – which seems like a more natural succession
for a western text’s words and allows for a parallel
movement in the text and annotation windows.
7 CONCLUSION AND FUTURE
WORK
We presented in this paper an approach to analyze text
annotation data that show complexities along multi-
ple dimensions. It is built around the core concept
of a combined geometric/semantic zooming mecha-
nism. We argued that our design decisions are de-
rived from a requirement and task analysis, and initial
user feedback indicates the general appropriateness of
these decisions. We believe that the approach can be
intuitively understood and supports a wide range of
tasks. However, longitudinal studies are to be under-
taken to substantiate this hypothesis. In order to fur-
ther develop our approach into a fully fledged annota-
tion tool more features will be added.
In this respect, the ability to generate and edit an-
notations directly within the tool seems vital. But also
further analytical features such as pattern recognition,
automatic sorting mechanisms, inter-annotator agree-
ment measures, automatic alignment mechanisms, or
filter and search facilities should be added.
With respect to the annotation data, we would like
to support the analysis of annotations that may be
discontinuous, that encompass long extensions, that
contain fuzzy borders or other kinds of uncertainty,
or that are related among each other. We would like
to open the tool also for further types of sequential
source signals other than natural language text, such
as genome data or event sequences.
Finally, we would like to increase the tool’s scal-
ability also with respect to the number of annotators
and with respect to the number and structure of tags,
like with a hierarchical tag set.
ACKNOWLEDGEMENTS
This work has been funded by the German Federal
Ministry of Education and Research (BMBF) as part
of the CRETA project. The annotation data set we pre-
sented was created by Sandra Murr, Institute of Liter-
ary Studies, University of Stuttgart, and her team of
annotators. We would like to thank the four anony-
mous reviewers for their helpful comments and sug-
gestions.
REFERENCES
Abdul-Rahman, A., Roe, G., Olsen, M., Gladstone, C.,
Whaling, R., Cronk, N., Morrissey, R., and Chen, M.
(2017). Constructive Visual Analytics for Text Simi-
larity Detection. Comput. Graph. Forum, 36(1):237–
248.
Albers, D., Dewey, C., and Gleicher, M. (2011). Se-
quence Surveyor: Leveraging Overview for Scalable
Genomic Alignment Visualization. IEEE Trans. Vis.
Comput. Graph., 17(12):2392–2401.
Albers Szafir, D., Stuffer, D., Sohail, Y., and Gleicher,
M. (2016). TextDNA: Visualizing Word Usage with
Configurable Colorfields. Comput. Graph. Forum,
35(3):421–430.
Alexander, E., Kohlmann, J., Valenza, R., Witmore, M., and
Gleicher, M. (2014). Serendip: Topic Model-Driven
Visual Exploration of Text Corpora. In Proc. IEEE
Conf. Vis. Anal. Sci. Technol. (VAST), pages 173–182.
Baumann, M., Koch, S., Minasyan, H., and Ertl, T. (2018).
Zooming on Tokens: Seamless Display Modes for
Annotation Analysis. In IEEE VIS 2018 Posters.
Bostock, M. (2019). D3: Data-Driven Documents. https:
//d3js.org/. 10.09.2019.
Chandrasegaran, S., Badam, S. K., Kisselburgh, L., Ra-
mani, K., and Elmqvist, N. (2017). Integrating Vi-
sual Analytics Support for Grounded Theory Practice
in Qualitative Text Analysis. Comput. Graph. Forum,
36(3):201–212.
Choo, J., Lee, C., Reddy, C. K., and Park, H. (2013).
UTOPIAN: User-Driven Topic Modeling Based on
IVAPP 2020 - 11th International Conference on Information Visualization Theory and Applications
74

Interactive Nonnegative Matrix Factorization. IEEE
Trans. Vis. Comput. Graph., 19(12):1992–2001.
Cockburn, A., Karlson, A., and Bederson, B. B. (2009).
A Review of Overview+Detail, Zooming, and Fo-
cus+Context Interfaces. ACM Comput. Surv., 41(1):1–
31.
Correll, M., Bailey, A. L., Sarikaya, A., O’Connor, D. H.,
and Gleicher, M. (2015). LayerCake: A Tool for the
Visual Comparison of Viral Deep Sequencing Data.
Bioinformatics, 31(21):3522–3528.
Correll, M., Witmore, M., and Gleicher, M. (2011). Explor-
ing Collections of Tagged Text for Literary Scholar-
ship. Comput. Graph. Forum, 30(3):731–740.
Culy, C. and Lyding, V. (2010). Double Tree: An Advanced
KWIC Visualization for Expert Users. In Proc. 14th
Int. Conf. Inf. Vis. (IV), pages 98–103.
Eckart de Castilho, R., Biemann, C., Frank, A., Gurevych,
I., Hartmann, S., Mujdricza-Maydt, E., and Yimam,
S. M. (2016). A Web-based Tool for the Integrated
Annotation of Semantic and Syntactic Structures. In
Proc. Workshop Lang. Technol. Resour. and Tools for
Digit. Humanities (LT4DH), pages 76–84.
Eick, S. G., Steffen, J. L., and Sumner, Jr., E. E. (1992).
Seesoft: A Tool For Visualizing Line Oriented Soft-
ware Statistics. IEEE Trans. Softw. Eng., 18(11):957–
968.
El-Assady, M., Sevastjanova, R., Gipp, B., Keim, D. A.,
and Collins, C. (2017). NEREx: Named-Entity Re-
lationship Exploration in Multi-Party Conversations.
Comput. Graph. Forum, 36(3):213–225.
Fort, K. (2016). Collaborative Annotation for Reliable Nat-
ural Language Processing: Technical and Sociologi-
cal Aspects. Focus Series. Wiley, London, UK.
Geng, Z., Cheesman, T., Laramee, R. S., Flanagan, K.,
and Thiel, S. (2013). ShakerVis: Visual Analysis of
Segment Variation of German Translations of Shake-
speare’s Othello. Inf. Vis., 14(4):273–288.
Gold, V., Rohrdantz, C. T., and El-Assady, M. (2015). Ex-
ploratory Text Analysis using Lexical Episode Plots.
In Eurographics Conf. Vis. (EuroVis) - Short Papers,
pages 85–89.
Harrower, M. and Brewer, C. A. (2003). ColorBrewer.org:
An Online Tool for Selecting Colour Schemes for
Maps. Cartogr. J., 40(1):27–37.
Javed, W. and Elmqvist, N. (2013). Stack Zooming for Mul-
tifocus Interaction in Skewed-Aspect Visual Spaces.
IEEE Trans. Vis. Comput. Graph., 19(8):1362–1374.
Jerding, D. F. and Stasko, J. T. (1998). The Information
Mural: A Technique for Displaying and Navigating
Large Information Spaces. IEEE Trans. Vis. Comput.
Graph., 4(3):257–271.
Keim, D. A. and Oelke, D. (2007). Literature Fingerprint-
ing: A New Method for Visual Literary Analysis. In
Proc. IEEE Symp. Vis. Anal. Sci. Technol. (VAST),
pages 115–122.
Kleymann, R., Meister, J. C., and Stange, J.-E. (2018). Per-
spektiven kritischer Interfaces f
¨
ur die Digital Human-
ities im 3DH-Projekt. In Proc. 5th DHd, pages 279–
283.
Koch, S., John, M., W
¨
orner, M., M
¨
uller, A., and Ertl, T.
(2014). VarifocalReader: In-Depth Visual Analysis
of Large Text Documents. IEEE Trans. Vis. Comput.
Graph., 20(12):1723–1732.
Kucher, K. and Kerren, A. (2015). Text Visualization Tech-
niques: Taxonomy, Visual Survey, and Community
Insights. In Proc. IEEE Pac. Vis. Symp. (PacificVis),
pages 117–121.
Kuhn, J. (2019). CRETA: Center for Reflected Text Analyt-
ics. https://www.creta.uni-stuttgart.de/. 09.12.2019.
Landragin, F., Poibeau, T., and Victorri, B. (2012).
ANALEC: A New Tool for the Dynamic Annotation
of Textual Data. In Proc. 8th Int. Conf. Lang. Resour.
and Eval. (LREC), pages 357–362.
Liu, S., Wang, X., Collins, C., Dou, W., Ouyang, F.,
El-Assady, M., Jiang, L., and Keim, D. A. (2019).
Bridging Text Visualization and Mining: A Task-
Driven Survey. IEEE Trans. Vis. Comput. Graph.,
25(7):2482–2504.
Meister, J. C., Petris, M., Gius, E., and Jacke, J. (2016).
CATMA 5.0: Software for Text Annotation and Anal-
ysis. http://catma.de/. 15.03.2019.
Monroe, M., Lan, R., Lee, H., Plaisant, C., and Shneider-
man, B. (2013). Temporal Event Sequence Simplifica-
tion. IEEE Trans. Vis. Comput. Graph., 19(12):2227–
2236.
Oelke, D., Spretke, D., Stoffel, A., and Keim, D. A. (2012).
Visual Readability Analysis: How to Make Your Writ-
ings Easier to Read. IEEE Trans. Vis. Comput. Graph.,
18(5):662–674.
Shneiderman, B. (1996). The Eyes Have It: A Task by
Data Type Taxonomy for Information Visualizations.
In Proc. IEEE Symp. Vis. Lang. (VL), pages 336–343.
Strobelt, H., Gehrmann, S., Pfister, H., and Rush, A. M.
(2018). LSTMVis: A Tool for Visual Analysis of Hid-
den State Dynamics in Recurrent Neural Networks.
IEEE Trans. Vis. Comput. Graph., 24(1):667–676.
Wattenberg, M. and Vi
´
egas, F. B. (2008). The Word Tree,
an Interactive Visual Concordance. IEEE Trans. Vis.
Comput. Graph., 14(6):1221–1228.
Widl
¨
ocher, A. and Mathet, Y. (2012). The Glozz Platform:
A Corpus Annotation and Mining Tool. In Proc. ACM
Symp. Doc. Eng. (DocEng), pages 171–180.
Wise, J. A., Thomas, J. J., Pennock, K., Lantrip, D., Pottier,
M., Schur, A., and Crow, V. (1995). Visualizing the
Non-Visual: Spatial Analysis and Interaction with In-
formation from Text Documents. In Proc. IEEE Symp.
Inf. Vis. (InfoVis), pages 51–58.
AnnoXplorer: A Scalable, Integrated Approach for the Visual Analysis of Text Annotations
75
