
A Macro View Model of a Bilirubin Monitoring System for Newborns
Fernando Crivellaro
1 a
, Ana Isabel Sousa
1 b
, Maria Narciso
1 c
, Rui Valente de Almeida
1 d
,
Anselmo Costa
2
and Pedro Vieira
1 e
1
Faculty of Science and Technology, NOVA University of Lisbon, Caparica Campus, 2829-516 Caparica, Portugal
2
Department of Paediatrics, Hospital Garcia de Orta, EPE, Almada, Portugal
Keywords:
Jaundice, Bilirubin, Newborns, Unified Modeling Language.
Abstract:
All newborns are routinely monitored for the development of jaundice due to they biological immaturity
to conjugate bilirubin. This situation is worrying because neonatal jaundice is a very common condition
and high-levels of unconjugated bilirubin concentration have neurotoxic effects. Therefore, a continuous
bilirubin monitoring system for newborns is being suggested to overcome visual inspection errors and to
reduce invasive procedures. This system is presented through a macro view modeling approach, in order to
validate the requirements and to build a base infrastructure to posteriorly progress in more detailed diagrams
for development support. The Unified Modeling Language was used for diagrams composition and, thus,
it was also developed a brief description about the different diagram types, in order to clarify the diagrams
selection. The system modeling at early stages was considered a powerful engineering methodology for new
designs due to its diffusion capacity of the system basic concepts for the respective interdisciplinary group
involved in this research.
1 INTRODUCTION
Jaundice is an abnormal yellowish of the skin, sclerae,
or mucous membranes due to accumulation of biliru-
bin in these body tissues (Jones et al., 2004). The
neonatal jaundice occurs at rates of 50 % for term
newborns and 80 % for preterm newborns. These sig-
nificant rates and the possibility of evolution to an en-
cephalopathy lead to a strong recommendation about
routine monitoring of the newborns for the develop-
ment of jaundice (World Health Organization, 2010).
Although visual inspection is recommended as a
first patient approach, it is classified as not reliable
to estimate the bilirubin levels in newborns, then, the
bilirubin levels should be measured non-invasively
by transcutaneous bilirubinometers or invasively by
serum bilirubin analysis (World Health Organization,
2017; Slusher et al., 2011; National Institute for
Health and Care Excellence, 2010). The measure-
ment of the Total Serum Bilirubin (TSB) is an inva-
sive and stressful procedure. Otherwise, the monitor-
a
https://orcid.org/0000-0002-7534-9149
b
https://orcid.org/0000-0003-2980-4742
c
https://orcid.org/0000-0001-5079-9381
d
https://orcid.org/0000-0002-2269-7094
e
https://orcid.org/0000-0002-3823-1184
ing of the Transcutaneous Bilirubin (TcB) is a reliable
and non-invasive method that can decrease the num-
ber of blood sampling required for jaundice evalua-
tion (Ercan and
¨
Ozg
¨
un, 2018; Jnah et al., 2018).
The TcB measurement is the analysis of the skin
diffuse reflectance, when it is exposed to different
wavelengths. The spectral content of the measured
light will depend on the concentration of the differ-
ent chromophores in the skin and subcutaneous tis-
sue. Therefore, through the absorption spectral differ-
ences, the TcB level is calculated. Thus, beyond the
blood sparing, the TcB easily allows more frequent
measurements, what is of great value for preterm
neonates, that have more risk factors predisposing to
neurotoxicity, or critically ill babies, that already pass
through painful procedure (Engle et al., 2014; Lyn-
gsnes Randeberg et al., 2005).
Also, as the jaundice management is made over
time, some studies reinforce the analysis of the rate
of rise of bilirubin as a predictor for risk designation,
or as an indicator for the phototherapy timing and
duration, or even for early discharge policy in term
and late preterm neonates (Hahn et al., 2019; Thakkar
et al., 2017; Bhutani, VK, Johnson, L, Sivieri, 1999).
Therefore, the idea behind this article is to model a
macro view of a system to continuously monitor TcB
136
Crivellaro, F., Sousa, A., Narciso, M., Valente de Almeida, R., Costa, A. and Vieira, P.
A Macro View Model of a Bilirubin Monitoring System for Newborns.
DOI: 10.5220/0008965301360141
In Proceedings of the 13th International Joint Conference on Biomedical Engineering Systems and Technologies (BIOSTEC 2020) - Volume 1: BIODEVICES, pages 136-141
ISBN: 978-989-758-398-8; ISSN: 2184-4305
Copyright
c
2022 by SCITEPRESS – Science and Technology Publications, Lda. All rights reserved
Mobile
Network
Cell 1
Base Station
BLE
Light
Wearable
Devices
Cell N
Frontend
Auth
Web
Server
AI
Clinician
Database
Figure 1: ProtoBili System.
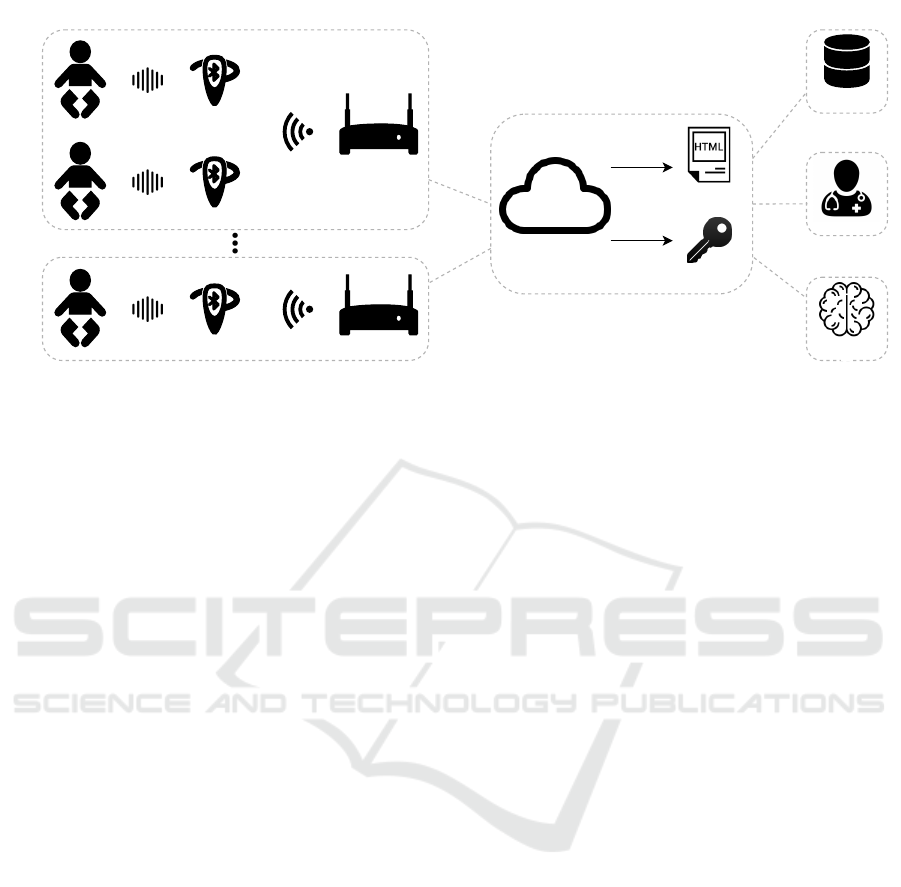
of newborns towards the blood sampling minimiza-
tion through the analysis of the TcB variation patterns
with artificial intelligence, as depicted on Fig. 1.
The system operation scenario could be inside a
hospital or at the patients houses, through the creation
of measurement cells which have non-invasive contin-
uous measurement devices installed on newborn pa-
tients. Each cell has a base station that controls and
reads the acquired data of the devices via Bluetooth
Low Energy (BLE). Beyond this, each base station
communicates through the mobile network to a web
server, which interfaces with the database, the artifi-
cial intelligence services and the clinician frontend.
After this introduction, a brief description of the
main aspects of the modeling theory will be ap-
proached, before the system modeling presentation
and the conclusion.
2 MODELING THEORY
A common approach for complex systems develop-
ment is the use of models. The modeling works to
improve the overall system comprehension at differ-
ent abstraction levels and allows the evaluation of dis-
tinct strategies for a system development (Zurawski,
2005). The standard language for visual modeling is
the Unified Modeling Language (UML), which is be-
ing used and improved since 1997, when the Object
Management Group (OMG) released the first specifi-
cation. Today, the last UML specification is the 2.5.1,
published in December of 2017. The UML objec-
tive is to provide tools for analysis, design and imple-
mentation of software-based systems, business mod-
els or other similar processes (Gomes and Fernandes,
2010; OMG, 2015). The UML works through dia-
grams and each one can express a perspective of the
system. These diagrams are classified as Structure or
Behavior diagrams, which will be briefly described in
the next sections.
2.1 Structure Diagrams
The Structure diagrams expose the static elements of
a system, as a time irrespective specification (OMG,
2015). The focus on the system architecture design
require a significant understanding of which elements
integrate the system and how the relationships to one
another are established. These informations can be
useful to manage resources, define parallel develop-
ments or reused elements and achieve a better sys-
tem implementation flow (Alhir, 2003). The UML
diagrams used to express the system structure are de-
tailed below.
Class Diagram: the Class is the main diagram
of the object-oriented development and design. Be-
yond the different types of objects, the classes spec-
ifies they structural and behavioral features. These
features are Properties, Operations, Receptions, Ports
and Connectors (Gomes and Fernandes, 2010; OMG,
2015).
Composite Structure Diagram: when there is a
need to reveal the design of complex or aggregate el-
ements and they interfaces, a Composite Structure di-
agram can be used. Its idea is to break down complex
classes, components or collaborations to visually de-
scribe the roles that these elements play in they con-
text to satisfy the required interactions (Pender, 2003;
Fowler, 2003; Eriksson et al., 2003).
Object Diagram: The objective of this diagram is
to bring the designed classes to life in facts or exam-
ples. Through the instance of different object types
A Macro View Model of a Bilirubin Monitoring System for Newborns
137

and the representation of they relationships, it is pos-
sible to evaluate whether the Class diagram is cor-
rect and complete (Hamilton and Miles, 2006; Fowler,
2003).
Component Diagram: this kind of diagram rep-
resents the flexible and reusable system components.
A component is a unit with a replaceable manifes-
tation inside the system environment, with specific
definitions about its provided and required Interfaces.
These Interfaces specify attributes, association, as
well as Operations and Receptions, which are needed
to perform the component expected functionalities
(OMG, 2015; Pender, 2003).
Deployment Diagram: the physical architecture of
the system elements, as well as, the connections and
protocols they have to each other, are visually repre-
sentations inside a Deployment diagram. The benefits
of this kind of diagram is the capacity to identify the
hardware capabilities to optimize the software devel-
opment (Kimmel, 2005; Pender, 2003).
Package Diagram: as a key point to the the sys-
tem stability, the Package diagram is of great rele-
vance to evaluate packages relationships. It also com-
prehends a mechanism to manage the model groups,
where each element can only be owned by one pack-
age (Hamilton and Miles, 2006).
Profile Diagram: due to many different applica-
tion domains where the UML can be applied, it is
possible to create and associate stereotypes, tags and
constraints in a specific collection called Profile dia-
gram. For example, profiles can be defined by specific
code generation tools to build platform adapted arti-
facts (Alhir, 2003; Pender, 2003; Hamilton and Miles,
2006).
2.2 Behavior Diagrams
The focus of this kind of diagrams is to understand
how the system elements interact and collaborate with
one another to achieve an objective. This information
helps to evaluate if the system, when implemented,
will satisfy its requirements (Alhir, 2003). The UML
diagrams used to express the system behavior are pre-
sented below.
Use Case Diagram: the system interaction with its
environment can be illustrated through the Use Cases
diagrams. They comprehend a collection of diagrams
and text that are useful for system requirements spec-
ification, helping to identify, in a simply and easily
way, the users expectations for the system. They
are also an excellent starting point for projects be-
cause they targets tend to be more clarified, allowing
a development focused on the well understood goals
(Martin and M
¨
uller, 2005; Pender, 2002).
Activity Diagram: this UML diagram is used to
describe details of processes, use cases, algorithms or
operations. It illustrates a sequence of elementary ac-
tions, that can be synchronous, parallel, concurrent,
or marked by specific conditions or decisions that ex-
press the required performance. The Activity dia-
grams have the capability to represent logic at the sys-
tem level, as well as in the individual methods level
(Weilkiens, 2008; Pender, 2003).
State Machine Diagram: in order to describe how
an external stimuli influence a class, a subsystem or
an entire application over time, a State Machine dia-
gram can be used. The value of this kind of diagram
is in the contribute to the object states definition and
the correspondent identification of its attribute or state
changing conditions. The UML consider state ma-
chines that focus on the element implementation as
behavioral state machines and those that express re-
quired protocol behaviors, when the focus is on state
changes triggers, as protocol state machines (Pilone
and Pitman, 2005; Pender, 2003).
Interaction Diagram: these diagrams are useful
for individuals or groups to have different perspec-
tives about the objects or processes intercommunica-
tion. They basically express the flow of control and
data among system objects. According to they pur-
poses, the Interaction diagrams can be particularized
as (OMG, 2015; Brambilla et al., 2017):
• Sequence Diagram: it defines the temporal se-
quence of messages considering a specific system
execution scenario;
• Communication Diagram: it models how the re-
lated objects structures are used during the inter-
actions, describing and numbering the messages
that combine information from Class, Sequence
and Use Case diagrams;
• Timing Diagram: it describes the states or con-
ditions changes of a structural element over time,
according to specific events and constraints;
• Interaction Overview Diagram: it details in a
high-level view the interactions logical progres-
sion required by the system control flow.
3 SYSTEM MODELING
As pointed by (Kimmel, 2005), a cyclic modeling
from a high-level macro view to successively lower-
level micro views can helps in the problem space
comprehension. This approach was used for this arti-
cle, being presented the firsts modeling cycles of this
system, which is called ProtoBili.
BIODEVICES 2020 - 13th International Conference on Biomedical Electronics and Devices
138
The ProtoBili high-level model was developed to
describe the system most important characteristics for
a first implementation approach. Based on the dia-
grams descriptions of 2, a collection of specific dia-
grams which will be discussed and presented below,
was used to address the following systems require-
ments:
• Req. 1: the system shall measure the TcB to iden-
tify significant hyperbilirubinemia.;
• Req. 2: the system shall operate a maximum of 5
cells with until 10 wearable devices each;
• Req. 3: the system shall allow an authenticated
user to add the patient information to the server
database;
• Req. 4: the system shall allow an authenticated
user to associate devices to patients.
• Req. 5: the system shall allow an authenticated
user to get the stored samples of a patient.
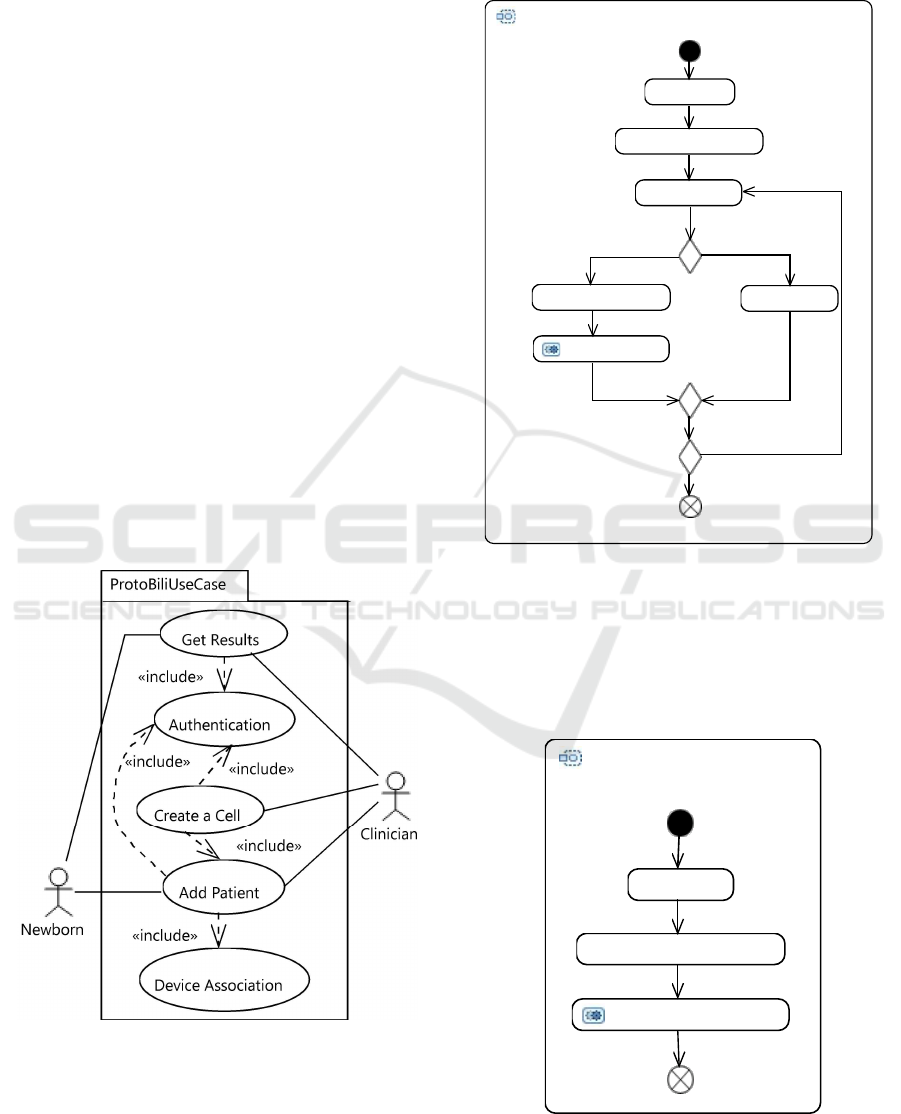
The first diagram, presented on Fig. 2, is an exam-
ple of use case, with the most important actions that
an user would perform during its interaction with the
system: to create a cell, to add a patient or to read
the results of a patient. All this actions can only be
performed by an authenticated user, as noted in the
respective diagram.
ProtoBiliUseCase
Create a Cell
Add Patient
Authentication
Device Association
Get Results
Clinician
Newborn
«include»
«include»
«include»
«include»
«include»
Figure 2: ProtoBili Use Case Diagram.
The process of a cell creation follows the steps
that are shown on Fig. 3. Assuming that the base
stations are already available in the system, the user
starts selecting which base station controls this cell.
After this, the devices installed on the newborn pa-
tients that are inside the respective base station cov-
ered area could be included.
Create a Cell Activity
Authenticated User
Create a Cell
Base Station Selection
Include New Patient
Select Patient
Include other Patient?
End
Call Add Patient
Is the patient in the system?
Include Patient
No
Yes
No
Yes
Figure 3: Create Cell Activity Diagram.
When a newborn was not previously added to the
system, the user can include this patient as a new one,
through the insertion of its information and the asso-
ciation of the respective installed device. This process
is done as presented in Fig. 4.
Add Patient Activity
Authenticated User
Add Patient
Insert Patient Information
Call Device Association
End
Figure 4: Add Patient Activity Diagram.
A Macro View Model of a Bilirubin Monitoring System for Newborns
139
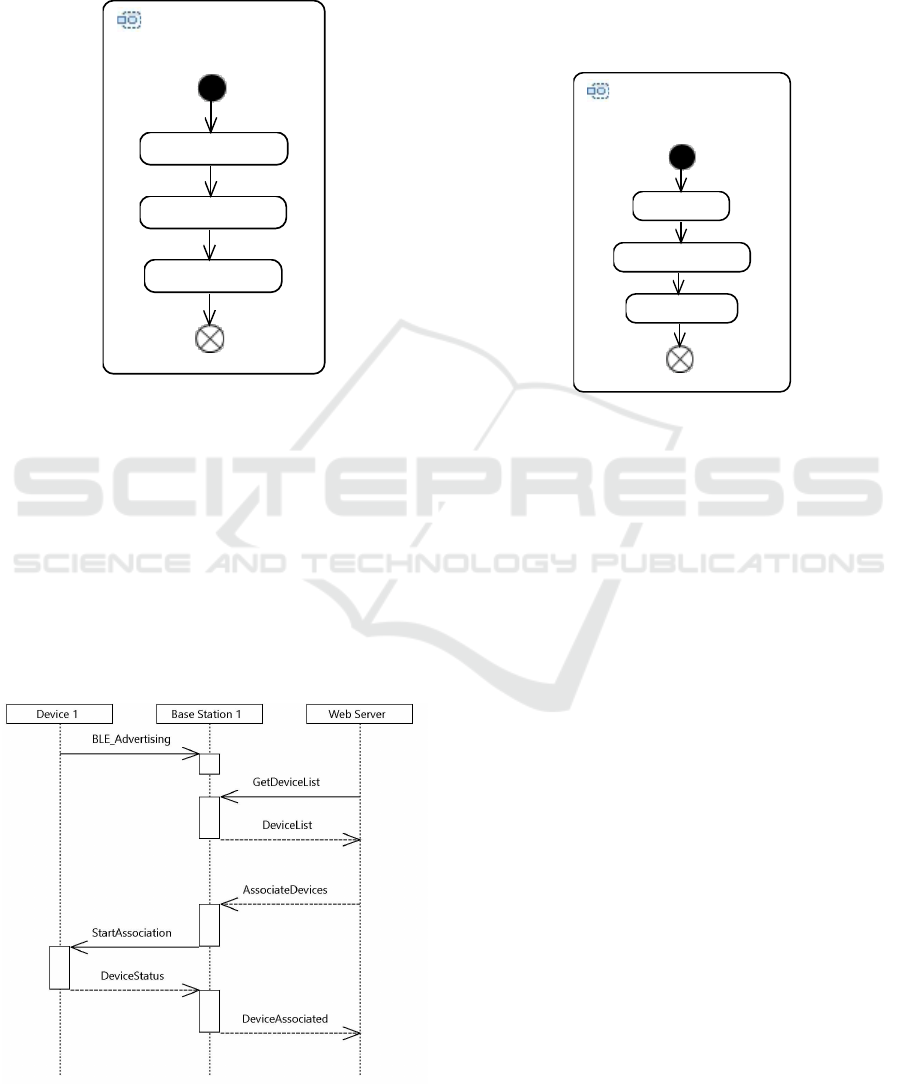
The device association to a patient must always
be done. The Fig. 5 exposes this process, which is
performed by a patient selection, followed by the in-
sertion of the respective installed device identification
(ID) code.
Device Association
Authenticated User
Associate Device
Patient Selection
Insert Device ID
End
Figure 5: Device Association Activity Diagram.
A more detailed view of the device association
process is presented on Fig. 6, showing the message
changing sequence from the web server to the patient
device. In this case, the idea is to use the BLE ad-
vertising to map which devices are close to the Base
Station. Therefore, when a cell management is being
performed by the user, these devices will be prompted
to the user interface, in order to associated them to a
base station and compose a cell. When the device re-
ceives an association message, it will answer a status
message corresponding to a successful association.
DeviceAssociationInteraction
Device 1
Base Station 1
Web Server
BLE_Advertising
DeviceStatus
StartAssociation
DeviceList
DeviceAssociated
GetDeviceList
AssociateDevices
Figure 6: Device Association Sequence Diagram.
The steps described before comprehend an
overview of the actions involved or required by the
process of creation of a measurement cell. When this
process is successfully done, the results would start to
be acquired and analyzed by the system, allowing the
clinician to evaluate the measured data and the out-
puts obtained from the artificial intelligence models
of a selected patient, as pointed in Fig. 7.
Get Results
Authenticated User
Get Results
Patient Selection
Show Results
End
Figure 7: Get Results Activity Diagram.
The user authentication process will define the dif-
ferent user permissions, which will reflect the differ-
ent clinician profiles. All the users will need an ac-
count to interact with the system.
4 CONCLUSIONS
The model designed and presented in this article have
significant information to be evaluated in a macro
perspective, allowing a discussion about the system
functionalities and requirements among the develop-
ers and the clinicians involved in this project, for a
first time validation. The Use Case diagram, followed
by the activities and sequence diagrams, demonstrate
how the clinician will interact with the system and
what they can expect about the system operation.
After this high-level and interdisciplinary align-
ment, the next modeling blocks will be designed from
this core validated infrastructure, in order to support
the overall system development. The idea is that these
next blocks will dive inside the lower layers of im-
plementation, even in the cloud side, even in the side
of the embedded system worn by the patient, which
will also require a custom wearable hardware devel-
opment.
BIODEVICES 2020 - 13th International Conference on Biomedical Electronics and Devices
140

ACKNOWLEDGEMENTS
This work was funded by the FCT PhD grant
PD/BDE/142935/2018.
REFERENCES
Alhir, S. S. (2003). Learning UML. O’Reilly.
Bhutani, VK, Johnson, L, Sivieri, E. (1999). Predic-
tive Ability of a Predischarge Hour-specific Serum
Bilirubin for and Near-term Newborns. Pediatrics,
103(1):6–14.
Brambilla, M., Cabot, J., and Wimmer, M. (2017). Model-
Driven Software Engineering in Practice. Morgan &
Claypool Publishers, 2 edition.
Engle, W. D., Jackson, G. L., and Engle, N. G. (2014).
Transcutaneous bilirubinometry. Seminars in Perina-
tology, 38(7):438–451.
Ercan, e. and
¨
Ozg
¨
un, G. (2018). The accuracy of transcu-
taneous bilirubinometer measurements to identify the
hyperbilirubinemia in outpatient newborn population.
Clinical Biochemistry, 55:69–74.
Eriksson, H.-E., Penker, M., Lyons, B., and Fado, D.
(2003). UML 2 Toolkit. Wiley, 1st edition.
Fowler, M. (2003). UML Distilled: A Brief Guide to
the Standard Object Modeling Language. Addison-
Wesley Professional, 3 edition.
Gomes, L. and Fernandes, J. M., editors (2010). Behav-
ioral Modeling for Embedded Systems and Technolo-
gies. IGI Global.
Hahn, S., B
¨
uhrer, C., Schmalisch, G., Metze, B., and Berns,
M. (2019). Rate of rise of total serum bilirubin in very
low birth weight preterm infants. Pediatric Research,
(October 2018):1–6.
Hamilton, B. K. and Miles, R. (2006). Learning UML 2.0.
O’Reilly.
Jnah, A., Newberry, D. M., and Eisenbeisz, E. (2018). Com-
parison of Transcutaneous and Serum Bilirubin Mea-
surements in Neonates 30 to 34 Weeks Gestation Be-
fore, During, and After Phototherapy. Advances in
Neonatal Care, 18(2):144–153.
Jones, R., Britten, N., Culpepper, L., Gass, D. A., Grol, R.,
Mant, D., and Silagy, C., editors (2004). Oxford Text-
book of Primary Medical Care, volume 97. Oxford
University Press, 1 edition.
Kimmel, P. (2005). UML demystified. McGraw-Hill.
Lyngsnes Randeberg, L., Bruzell Roll, E., Norvang Nilsen,
L. T., Christensen, T., and Svaasand, L. O. (2005). In
vivo spectroscopy of jaundiced newborn skin reveals
more than a bilirubin index. Acta Paediatrica, Inter-
national Journal of Paediatrics, 94(1):65–71.
Martin, G. and M
¨
uller, W. (2005). UML for SOC Design.
Springer.
National Institute for Health and Care Excellence (2010).
Jaundice in newborn babies under 28 days. https://
www.nice.org.uk/guidance/cg98?
OMG (2015). OMG
R
Unified Modeling Language
R
:
Version 2.5.1. https://www.omg.org/spec/UML/2.5/
PDF?
Pender, T. (2003). UML Bible. Wiley.
Pender, T. A. (2002). UML Weekend Crash Course. Wiley.
Pilone, D. and Pitman, N. (2005). UML in a Nutshell.
O’Reilly, 2 edition.
Slusher, T. M., Zipursky, A., and Bhutani, V. K. (2011). A
Global Need for Affordable Neonatal Jaundice Tech-
nologies. Seminars in Perinatology, 35(3):185–191.
Thakkar, P., Chavda, H., and Doshi, V. (2017). Transcu-
taneous bilirubin nomogram for healthy term and late
preterm neonates in first 96 hours of life. Indian Pedi-
atrics, 54(5):369–372.
Weilkiens, T. (2008). Systems Engineering with
SysML/UML: Modeling, Analysis, Design. Morgan
Kaufmann.
World Health Organization (2010). Effective
Perinatal Care (EPC): Neonatology. http:
//www.euro.who.int/ data/assets/pdf file/0010/
146818/EPC participants neonatology.pdf?
World Health Organization (2017). WHO recommenda-
tions on newborn health. https://apps.who.int/iris/
bitstream/handle/10665/259269/WHO-MCA-17.07-
eng.pdf?
Zurawski, R. (2005). Embedded Systems Handbook. CRC
Press, 1 edition.
A Macro View Model of a Bilirubin Monitoring System for Newborns
141
