
Detection System of Gram Types for Bacteria
from Gram Stained Smears Images
Ryosuke Iida
1
, Kazuki Hashimoto
1
, Kouich Hirata
1
, Kimiko Matsuoka
2
and Shigeki Yokoyama
3
1
Kyushu Institute of Technology, Kawazu 680-4, Iizuka 820-8502, Japan
2
Osaka General Medical Center, Bandaihigashi 3-1-56, Sumiyoshi, Ohsaka 558-8558, Japan
3
KD-ICONS, Ohmoriminami 4-6-15-304, Ohta, Tokyo 143-0013, Japan
cby41060@pop01.odn.ne.jp, yokoyama@kd-icons.co,jp
Keywords:
Gram Stain, Gram Stained Smears Images, Gram Types, Gram Positive Cocci, Gram Positive Bacilli, Gram
Negative Cocci, Gram Negative Bacilli.
Abstract:
In this paper, we develop the detection system of Gram types determined by stained colors and stained shapes
for bacteria from Gram stained smears images. Here, we call four types of bacteria, that is, Gram positive
cocci (GPC), Gram positive bacilli (GPB), Gram negative cocci (GNC) and Gram negative bacilli (GPB)
Gram types, and then add to two types as Gram positive unknown (GPU), and Gram positive unknown (GNU).
The system first infers the candidate regions of bacteria by using image processing. Next, it constructs a
classifier dividing the candidate regions into Gram types by using SVM (support vetcor machine) and DNN
(deep neural network). Finally, it detects the occurrences of Gram types in a newly input image and retrieves
Gram stained smears images similar as the input image such that the occurrence ratio for the Gram types is
similar.
1 INTRODUCTION
The Gram stain (Bartholomew and Mittwer, 1952) is
the method for microbial smears test in microscope
test, introduced by Hans Christian Gram (1853–1938)
at 1884. For the Gram stain, based on the stained col-
ors as purple/violet or red/pink, the stained shapes as
sphere-shape, rod-shape, singles, pairs, chains, clus-
ters, and so on, we detect bacteria occurring in the
smears for the samples of blood, sputum, feces, pus
and urine.
After Gram staining, we call the bacteria colored
by purple or violet Gram positive and those by red or
pink Gram negative. Also we call the bacteria stained
as sphere-shape cocci and those as rod-shape basilli.
Hence, in this paper, we call four kinds of bacteria
as Gram positive cocci (GPC), Gram positive bacilli
(GPB), Gram negative cocci (GNC) and Gram nega-
tive bacilli (GNB)
1
Gram types.
Since the Gram stain is applicable inexpensively
and fast returns the results (within 30 min.), it is im-
portant for the initial medical care of infectious dis-
eases (Mitsuda, 2004; Yamamoto, 2015). On the
1
Sometimes we call GPB and GNB Gram positive rod
and Gram negative rod (Smith et al., 2018).
other hand, Gram staining is possible to stain not
only bacteria but also non-bacteria substances such
as leukocytes, dust, oil and crystals. Also, there ex-
ist many kinds of phlogogenic fungus for infectious
diseases. Table 1 illustrates the relationship between
Gram types and bacteria.
Table 1 shows that the bacteria as the phlogogenic
fungus for hospital-acquired infection tend to belong
to GPC or GNB. Then, the detected bacteria will
determine the direction for culture and identification
tests (Mitsuda, 2004; Yamamoto, 2015).
In the microscope test, Gram stained smears im-
ages are checked manually and visually and not au-
tomatically in general. The reason is that we can de-
tect bacteria exactly by applying culture and identi-
fication tests after the microscope test. On the other
hand, anaerobic bacteria are never lived in the culture
test, they cannot be detected by the identification test.
Hence, the detected bacteria through the culture and
identification tests are the part of bacteria in smears.
Also, since the culture and identification tests
spend one day, we cannot apply them to the initial
medical care of infectious diseases. Furthermore,
whereas expert skills are necessary to detect bacte-
ria manually and visually from Gram stained smears
Iida, R., Hashimoto, K., Hirata, K., Matsuoka, K. and Yokoyama, S.
Detection System of Gram Types for Bacteria from Gram Stained Smears Images.
DOI: 10.5220/0008964404770484
In Proceedings of the 9th International Conference on Pattern Recognition Applications and Methods (ICPRAM 2020), pages 477-484
ISBN: 978-989-758-397-1; ISSN: 2184-4313
Copyright
c
2022 by SCITEPRESS – Science and Technology Publications, Lda. All rights reserved
477

Table 1: The relationship between Gram stain and bacteria.
Gram types bacteria
(color, shape)
Gram positive cocci Enterococcus faecalis,
(purple/violet, sphere) Staphylococcus aureus,
Streptcoccus pyogenes,
Streptcoccus pneumoniae
Gram positive bacilli Clostridium
(purple/violet, rod) (Clostridium perfringens,
Clostridium tetani),
Corynebacterium diphtheriae,
Listeria monocytogenes
Gram negative cocci Nesseria meningitidis,
(red/pink, sphere) Nesseria gonorrhoeae
Gram negative bacilli Bacteroides spp.,
(red/pink, rod) Klebsiella spp.,
Psuedomonas aeruginosa,
Escherichia coli, Serratia spp.
Gram intermediate Legionella spp.,
Mycobacterium spp.
images, such technicians with expert skills are not
enough to apply the initial medical care in Japan.
Hence, the automatic detection of bacteria from Gram
stained smears images automatically is required.
In order to solve these problems, in this paper, as
the prepossessing of detecting bacteria exactly from
Gram stained smears images, we focus on the Gram
types. Then, we develop the system to detect such
types of bacteria and to compute the occurrence ratio
of types in every image.
In this system, first we extract candidate regions of
bacteria as the regions obtained by excluding the re-
gion not occurring bacteria from Gram stained smears
images by using image processing. Then, we compute
the features as colors, areas, aspect ratio, and so on.
After classifying candidate regions by colors as Gram
positive and Gram negative, we detect Gram types by
using the classifier constructed from SVM (support
vector machine) and DNN (deep neural network).
1.1 Related Works
As related works to this paper, Carvajal et al. (Car-
vajal et al., 2014) have developed the system to learn
the candidate areas from fixed-size (51 × 38 pixels)
images applicable to the microscope test with high
magnification. They have dealt with the Gram stained
smear images per 64× field. Note that we use images
par 1, 000× field in the microscope test in general,
which we deal with in this paper. Then, whereas they
have dealt with Gram stained smear images, they have
not achieved to detect Gram types or bacteria.
On the other hand, Smith et al. (Smith et al., 2018)
have dealt with the Gram stained smear images pro-
vided from the sample of blood. Their target Gram
types are GNB, GPC in clusters and GPC in pairs or
chains, which are meaningful Gram types for blood.
Then, after extracting fixed size (146 × 146 pixels)
images, they have detected the above three Gram
types by using CNN.
Note that the above researches of (Carvajal et al.,
2014) and (Smith et al., 2018) have dealt with ran-
domly selected fixed size images as training data, so
their researches have not detect the area of bacte-
ria in the whole images. On the other hand, Lejon
and Andersson (Lejon and Andersson, 2016) have de-
tected the area of bacteria in the image, as same as
this paper, and then Gram types and then bacteria
from the Gram stained smear images for the sample
of blood by MATLAB. Whereas they have detected
Gram types and bacteria without machine learning,
we detect Gram types by using machine learning.
In (Lejon and Andersson, 2016), they have
adopted the template matching to detect the areas of
bacteria, which they have implicitly adopted the ideal
assumption that every bacterium has the similar small
size and there exist no substances such as dust with
the similar size of bacteria. Furthermore, when deal-
ing with the images for not only blood but also spu-
tum and feces, more kinds of bacteria such as Table 1
containing the bacteria not occurring in the images for
blood and many other substances except bacteria oc-
cur in the images for sputum and feces.
Hence, we can position this paper to develop a
new system to detect the area of bacteria and then
Gram types with machine learning applicable to the
Gram stained smear images for not only the sample
of blood but also other samples of sputum, feces, pus
and urine uniformly.
2 DETECTING SYSTEM OF
GRAM TYPES
In this section, we explain our detection system of
Gram types from Gram stained smears images.
2.1 Data and Outline of System
First, we use the Gram stained smears images per
1, 000× field, provided from Osaka General Medical
Center applied to our detecting system. Every image
consists of 2, 448 × 1, 920 pixels and is assigned the
ratio of the occurrences of GPC, GPB, GNC and GNB
as percentage. For every sample, the number of im-
ICPRAM 2020 - 9th International Conference on Pattern Recognition Applications and Methods
478
ages is 42 for blood, 40 for sputum, 10 for feces, 40
for pus and 69 for urine, respectively.
Our detection system of Gram types mainly con-
sists of the extraction of candidate regions of bac-
teria, learning phase and detecting and retrieving
phase. First, by using image processing, the sys-
tem extracts candidate regions of bacteria from Gram
stained smears images. Then, in the learning phase,
the system constructs the classifier for Gram types
from training data. Finally, in the detecting and
retrieving phase, the system detects the regions of
Gram types by using the classifier, and then outputs
the input image with depicted such regions and re-
trieves similar images such that the occurrence ratios
of Gram types are similar.
2.2 Candidate Regions of Bacteria
In order to extract candidate regions of bacteria, in our
system, first we convert Gram stained smears images
to glayscale images. Here, we adopt the NTSC (non-
subsampled contoulet transform) coefficient method
supported from OpenCV
2
and then compute lumi-
nance.
Next, we transform the grayscale images to the bi-
nary images by applying binarization consisting of 1
if a pixel has the luminance more than the threshold
and 0 otherwise. Here, in our binarization, we adopt
adaptive thresholding (Keahler and Bradski, 2013)
to determine the threshold by considering pixels on
neighbors at a current pixel. As a result, our sys-
tem extracts the regions with clearer boundaries than
around pixels. Here, the adaptivethresholding is com-
puted by matrix and the coefficient of neighbor re-
gions under Gaussian distribution minus a subtractive
constant
3
. The constant reflects fluctuation such that
noises tend to be ignored if the constant is large and
pixels with small changes of luminance tend to be re-
mained if it is small.
Then, by using morphorogical operation (Keahler
and Bradski, 2013), we separate connected pixels
from other pixels and then eliminate noises. Here, we
adopt opening processing as applying the dilation at
n times after applying the erotions at n times.
Finally, we extract edges as boundaries as pixels
with large changes of luminances. We call the set of
edges for a substance an outline. In our system, we
adopt a Canny filter (Canny, 1986) as a robust edge
detection filter to noises. By applying the edge de-
2
https://docs.opencv.org/3.1.0/de/d25/
imgproc color conversions.html
3
https://docs.opencv.org/3.0-beta/modules
/imgproc/doc/miscellaneous
transformations.html
?highlight=cv2.adaptive#cv2.adaptiveThreshold
tection filter, we exclude regions as noises with small
changes of luminances.
After determining the regions consisting of sub-
stances but not noises, we regard the regions such that
every value of areas, aspect ratio and circularity satis-
fies every threshold as bacterial regions. As a result,
we extract such bacterial regions as candidate regions
of bacteria.
2.3 Training Data
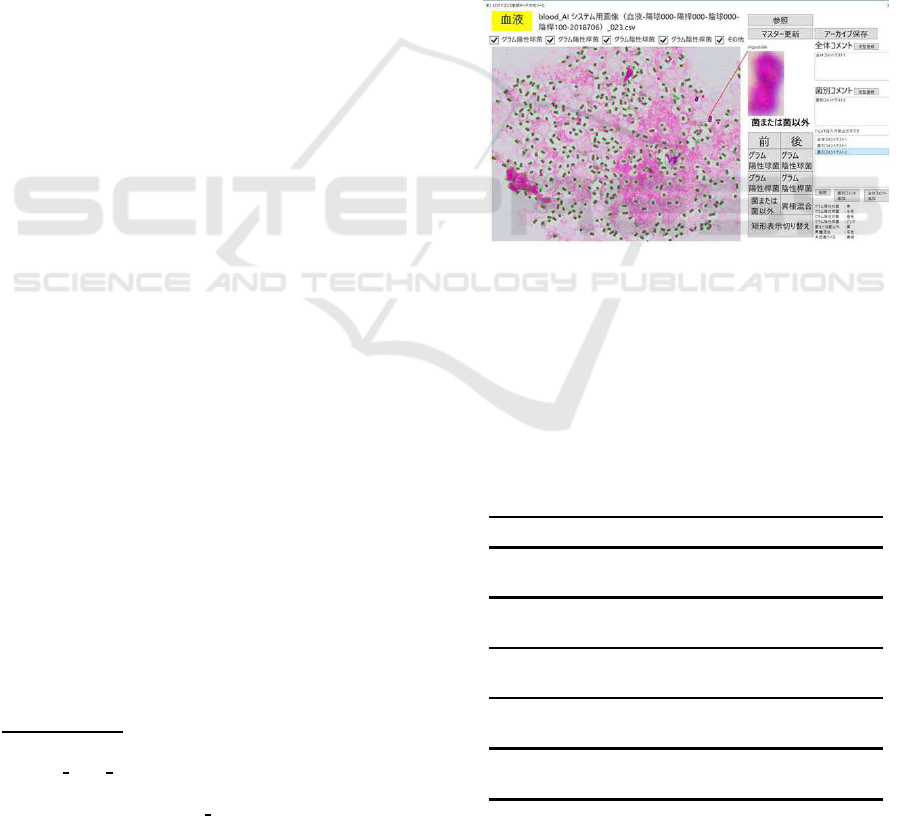
In order to construct training data, we design the tool
as Figure 1 (whose GUI is in Japanese) to represent
the rectangle as candidate regions of bacteria, and
then assign the correct Gram type to the rectangle
manually through GUI by the fourth author who is the
medical technologist for clinical microbial testing.
Figure 1: Tool for constructing training data.
As a result, Table 2 illustrates the number of
training data as images transferring a single bac-
terium. Here, since there exist regions not determin-
ing whether cocci or bacilli, we add those as Gram
positive unknown (GPU) and Gram negative unknown
(GNU) and extend Gram types to six kinds of GPC,
GPB, GPU, GNC, GNB and GNU.
Table 2: The number of training data for samples.
sample num. color cocci bacilli unknown total
blood 6,216
pos. 1,062 512 406 1,980
neg. 0 3,424 812 4,236
sputum 10,308
pos. 1,118 665 1,821 3,604
neg. 826 2,522 3,356 6,704
feces 2,905
pos. 20 74 154 248
neg. 56 2,029 572 2,657
pus 8,178
pos. 296 534 1,388 2,218
neg. 0 4,225 1,735 5,960
urine 6,052
pos. 14 50 395 459
neg. 0 4,397 1,196 5,593
Detection System of Gram Types for Bacteria from Gram Stained Smears Images
479

2.4 Learning Phase
From training data illustrated as Table 2, in the learn-
ing phase, we construct the classifiers by using SVM
(support vector machine) and DNN (deep neural net-
work). Here, we adopt SVM as the library pro-
vided from OpenCV (Keahler and Bradski, 2013)
whose kernel is CHI2 (Li et al., 2010). Also we
adopt DNN as Caffe (convolutional architecture for
fast feature embedding) based on the rayer structure
of AlexNet (Krizhevsky et al., 2017).
For SVM, we construct the classifier to detect
Gram types by using feature values as features for
candidate regions of bacteria. Here, we adopt features
as the area, the aspect size, the aspect ratio, the color
and the circularity of the region, and also the number
of detected bacteria in the region.
On the other hand, for DNN, we construct the
classifier to detect Gram types by using images for
candidate regions of bacteria as training data.
2.5 Detecting and Retrieving Phase
In the detecting and retrieving phase, after setting a
sample and a file path, referring to the button “Re-
fer,” on GUI, our system starts to detect four Gram
types. Then, it outputs, for each of SVM and DNN,
the occurrence ratio of every Gram type, the main im-
age such that the substance is enclosed by a colored
rectangle if it belongs to one Gram type and the three
subimages whose occurrence ratio is similar. Here,
we can change the main image or subimages by SVM
and DNN.
Figure 2 illustrates the output of our detection sys-
tem for the sample of blood and DNN. Here, in the
main image, the Gram types of GPC, GPB, GNC,
GNB, GPU and GNU are enclosed by frames colored
by blue, light blue, red, pink, light green and black,
respectively.
In Figure 2, the left windows in the detection sys-
tem represents the occurrence ratio for every Gram
type. The upper three images are the original image,
the result by SVM and the result by DNN from left to
right. The right three images are similar images as the
original image.
3 EXPERIMENTAL RESULTS
In this section, we give experimental results for our
detecting system of Gram types. Here, computer
environment to the learning phase is CPU Intel(R)
Xeon(R) E5-1603 v3 @2.80GHz, RAM 32.0GB and
OS Windows 10 Pro for Workstations. The samples
consist of blood, sputum, feces, pus and urine. In this
section, we use the images to assigned the occurrence
ratio of Gram types by the professional technician,
which we call the images to assigned ratios. Then,
the number of the images to assigned ratios for blood,
sputum, feces, pus and urine is 42, 40, 10, 40 and 69,
respectively, and the total number of the images to as-
signed ratios is 201.
3.1 Parameters
Table 3 illustrates the parameters for image process-
ing for Section 2.2 applied to experimental results.
Here, we denote the size of neighbor for adaptive
thresholding by N, the subtractive constant by C and
the number of opening processings by P. Also we de-
note the upperbound an the lowerbound for the area
as the candidate regions of bacteria by S
min
and S
max
,
those for the aspect ratio by A
min
and A
max
, and those
for the circularity by C
min
and C
max
.
Table 3: The parameters for image processing applied to
experimental results.
sample N C P S
min
S
max
A
min
A
max
C
min
C
max
blood 257 37 2 200 30000 0.1 1.0 0.1 1.0
sputum 431 37 2 130 30000 0.1 1.0 0.1 1.0
feces 281 18 2 300 30000 0.1 1.0 0.1 1.0
pus 301 38 2 150 15000 0.1 1.0 0.1 1.0
urine 581 35 2 200 50000 0.1 1.0 0.1 1.0
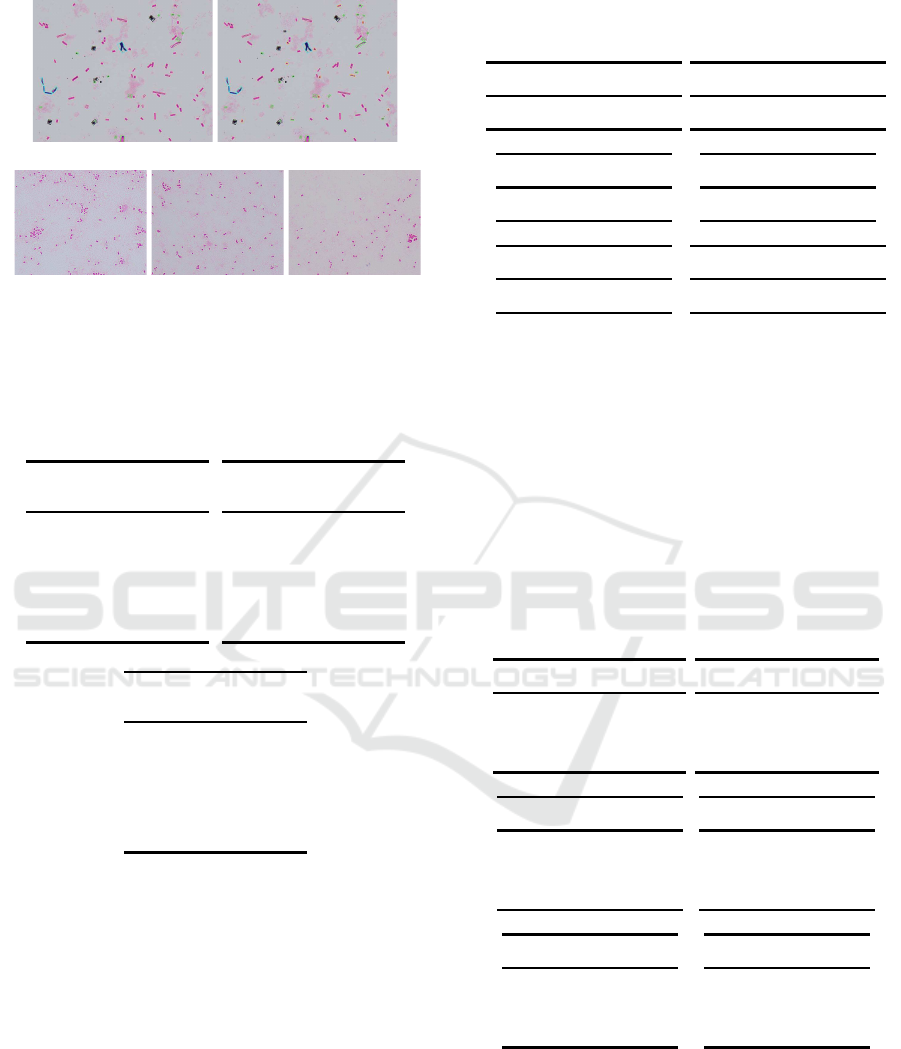
3.2 Detection of Gram Classes
Figures 3, 4 and 5 illustrate the results obtained by de-
tecting Gram types by SVM and DNN from arbitrary
selected images for blood, sputum and feces and by
searching their similar images.
The images in Figures 3, 4 and 5 are those to as-
signed ratios. Then, Table 4 illustrates the assigned
and detected occurrence ratios of Gram types for
blood (Figure 3), sputum (Figure 4) and feces (Fig-
ure 5) by SVM and DNN.
Table 4 shows that, in these images, whereas the
detected occurrence ratios by SVM is more similar
as the assigned occurrence ratios than those by DNN,
the accuracy is too insufficient to detect Gram types
exactly. For all the cases, every detected Gram type
contains GPU and GNU. A large ratio of GNU fol-
lows that the stained dusts are detected as GNU.
3.3 Evaluation for Detection
In order to evaluate the method to detect the Gram
types, by using the assigned ratio of the occurrences
ICPRAM 2020 - 9th International Conference on Pattern Recognition Applications and Methods
480
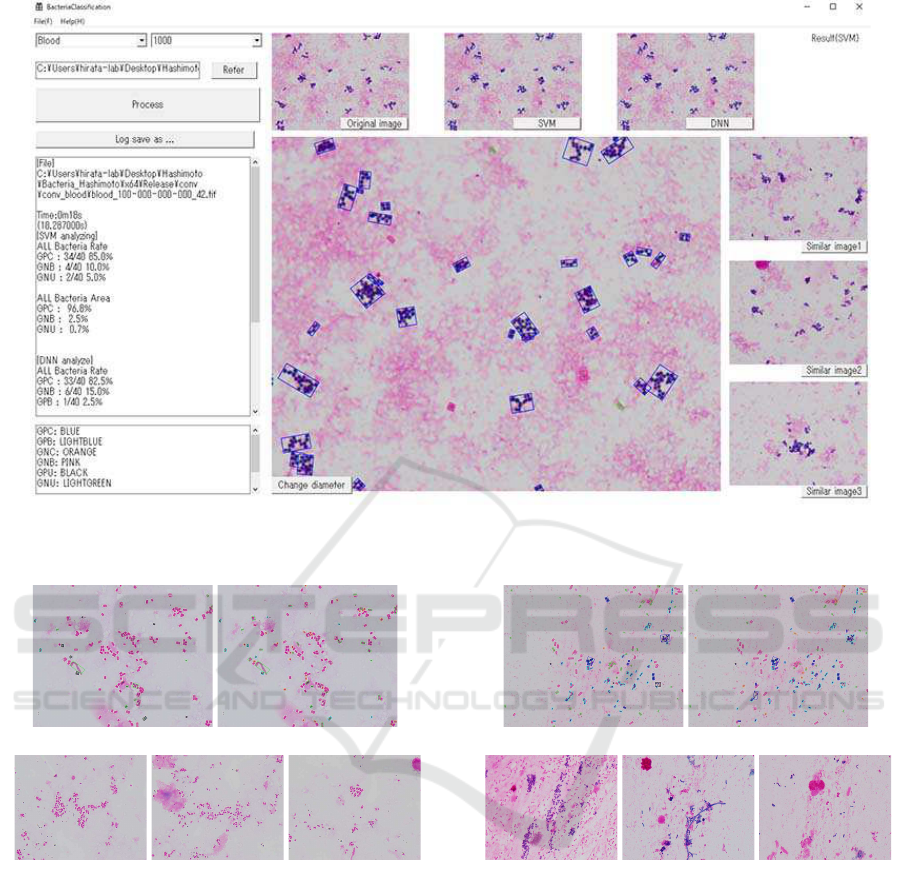
Figure 2: The detection system of Gram types for the sample of blood.
SVM DNN
similar images
Figure 3: The images for blood by detecting Gram types by
SVM and DNN (upper) and its similar images (lower).
of GPC, GPB, GNC and GNB as percentage, we ap-
ply the following test for sputum and pus.
1. First, we divide all the images for a sample into
two groups in half randomly. We call one group
training images and another group test images.
Here, we obtain 21 training images and 21 test
images for blood, 20 training images and 20 test
images for sputum and pus.
2. From the training images, we construct the train-
ing data (regions) with the classes of GPC, GPB,
GPU, GNC, GNB and GNU as same as Sec-
tions 2.2 and 2.3.
SVM DNN
similar images
Figure 4: The images for sputum by detecting Gram types
by SVM and DNN (upper) and its similar images (lower).
3. By using SVM and DNN, we construct classi-
fier from training data and apply it to test im-
ages. Then, for every test image, we compare the
assigned ratio of the occurrences of GPC, GPB,
GNC and GNB to the image with the detected ra-
tio of the occurrences of GPC, GPB, GPU, GNC,
GNB and GNU from the image.
4. Repeat the above procedures at five times.
In order to evaluate the assigned ratio to the im-
age and the detected ratio from the image, we first
compare the occurrences for color. Let p
a
and p
d
be
the assigned ratio and the detected ratio of the occur-
rences of Gram positive bacteria, respectively. Then,
Detection System of Gram Types for Bacteria from Gram Stained Smears Images
481
SVM DNN
similar images
Figure 5: The images for feces by detecting Gram types by
SVM and DNN (upper) and its similar images (lower).
Table 4: The assigned (ass.) and detected occurrence ra-
tios (occ. ratio) of Gram types (GCs) for blood (Figure 3),
sputum (Figure 4) and feces (Figure 5) by SVM and DNN.
blood (Figure 3) sputum (Figure 4)
GCs occ. ratio
ass. SVM DNN
GPC 0 0.00 0.00
GPR 0 0.00 2.74
GNC 0 0.00 17.81
GNR 100 83.56 41.10
GPU – 2.74 0.00
GNU – 13.70 38.36
GCs occ. ratio
ass. SVM DNN
GPC 10 6.92 10.77
GPR 50 33.85 31.54
GNC 0 0.77 10.77
CNR 40 26.15 30.00
GPU – 2.31 0.77
GNU – 30.00 16.15
feces (Figure 5)
GCs occ. ratio
ass. SVM DNN
GPC 0 0.00 0.00
GPR 10 6.25 6.25
GNC 0 0.00 13.75
GNR 90 70.00 46.25
GPU – 8.75 8.75
GNU – 15.00 25.00
we say that a test image has an admissible color if
|p
a
− p
d
| ≤ 20%.
Table 5 illustrates the number of images with an
admissible color in the test images for blood, sputum
and pus. Here, the number of the test images for blood
is 21 and that for sputum and pus is 20.
Table 5 shows that the ratio for the test images
with an admissible color is more than 50% and, in
particular, it is about 90% for pus by DNN.
Next, we compare the occurrences for shapes. Let
c
a
and c
d
be the assigned ratio and the detected ratio
of the occurrences of cossi, respectively. Also let b
a
and b
d
be the assigned ratio and the detected ratio of
the occurrences of basilli, respectively. Then, we say
that a test image has admissible cossi if |c
a
− c
d
| ≤
Table 5: The number of images with an admissible color in
the test images for blood, sputum and pus.
blood, SVM (21) blood, DNN (21)
1 2 3 4 5 ave.
12 10 14 14 12 12.4
1 2 3 4 5 ave.
12 12 13 13 13 12.6
sputum, SVM (20) sputum, DNN (20)
1 2 3 4 5 ave.
14 11 9 8 11 10.6
1 2 3 4 5 ave.
9 12 12 11 9 10.6
pus, SVN (20) pus, DNN (20)
1 2 3 4 5 ave.
9 12 12 11 9 10.6
1 2 3 4 5 ave.
18 18 17 17 18 17.6
20% and admissible basilli if |b
a
− b
d
| ≤ 20%. Fur-
thermore, we say that a test image has admissible
shapes if |c
a
− c
d
| ≤ 20% and |b
a
− b
d
| ≤ 20%.
Table 6 illustrates the number of images with ad-
missible cossi, basilli and shapes in the test images for
sputum and pus. Here, the number of the test images
is 20, respectively. Also we do not count the number
of GPU and GNU.
Table 6: The number of images with admissible cossi (C),
basilli (B) and shapes (S) in the test images for blood, spu-
tum and pus.
blood, SVM (21) blood, DNN (21)
1 2 3 4 5 ave.
C 18 13 16 18 16 16.2
B 12 13 12 10 14 12.2
S 9 6 7 8 9 7.8
1 2 3 4 5 ave.
C 18 5 18 10 15 13.2
B 16 6 20 11 18 14.2
S 15 5 18 10 15 12.6
sputum, SVM (20) sputum, DNN (20)
1 2 3 4 5 ave.
C 7 9 6 5 6 6.6
B 8 7 9 10 10 8.8
S 0 0 0 0 0 0
1 2 3 4 5 ave.
C 8 5 7 5 5 6
B 8 13 8 7 8 8.8
S 5 5 5 5 5 5
pus, SVN (20) pus, DNN (20)
1 2 3 4 5 ave.
C 6 6 6 6 5 5.8
B 9 13 7 7 8 8.8
S 4 6 4 6 5 5
1 2 3 4 5 ave.
C 4 5 7 6 9 6.2
B 5 2 4 9 3 4.6
S 2 0 2 4 3 2.2
Table 6 shows that, for blood, the accuracy of de-
tecting shapes (cossi and basilli) tends to be higher
than the accuracy of detecting colors and the ratio
for the test images with admissible cossi and basilli
is greater than 50%. Since the second round for
DNN detects all the assigned labels of GNB to GNC,
the number of the images with admissible cossi and
ICPRAM 2020 - 9th International Conference on Pattern Recognition Applications and Methods
482

basilli is very small.
On the other hand, for sputum and pus, the ac-
curacy of detecting shapes (cossi and basilli) is much
lower than the accuracy of detecting colors in Table 5.
In all the cases, the ratio for the test images with ad-
missible cossi, basilli and shapes for sputum and pus
is less than 50%.
In particular, for sputum by SVM, the reason why
the number of test images with admissible shapes is
0 is that the detection of cossi (resp., basilli) suc-
ceeds when the ratio of the occurrencesof cossi (resp.,
basilli) is near to 0%. Also, for pus by SVM, either
the detected ratio of the occurrences of GNB is 0%
and that of GNC is 100% or the detected ratio of the
occurrences of GNC is 0% and that of GNB is 100%.
For pus by DNN, the detected ratio of the occurrences
of GNB is always 0% and GNB is determined as GNC
in the detection.
Hence, it is necessary to improve our detection
system of detecting shapes rather than color for spu-
tum and pus.
3.4 Running Time
Finally, Table 7 illustrates the average running time to
detect the Gram type for a single candidate region of
bacteria by SVM and DNN for every sample.
Table 7: The average running time (ms) to detect the Gram
types for a single candidate region of bacteria by SVM and
DNN for every sample.
SVM DNN
blood 0.033 240.509
sputum 0.143 247.572
feces 0.030 242.059
pus 0.081 246.837
urine 0.039 245.090
Table 7 shows that the running time to detect by
SVM is much faster than that by DNN.
4 CONCLUSION
In this paper, we have developed the detecting system
of Gram types for bacteria from Gram stained smears
images. By applying our system to 201 Gram stained
smears images to assigned the occurrence ratios of
Gram types, we have given the experimental results
for our system.
Since our system is still proto-typing and there ex-
ist many future works to improve our system. First of
all, we have just applied standard image processing
to our system and then not designed the method ap-
propriate to Gram stained smears images, so it is an
important future work to design such a method and
embed it to our system.
As stated in Section 3.3, it is necessary to improve
the detection of shapes rather than color for sputum
and pus. Then, it is a future work to apply the image
processing methods such as black top-hat transform,
label connected component and template matching
proposed by (Lejon and Andersson, 2016) and then to
analyze which of them is useful of our system. Also,
since the labels consist of GPC, GPB, GNC and GNB,
it is a future work to design the method to evaluate the
detection.
Furthermore, our system cannot avoid to detect
dust as bacteria completely illustrated in Figure 6
(left), so it is a future work to improve our system
to avoid to this situation. Also it is necessary to detect
leukocyte phagocystosis in Figure 6 (right), which is
an important future work.
Figure 6: The detection of dusts as bacteria (left) and leuko-
cyte phagocystosis (right).
ACKNOWLEDGMENTS
This work is partially supported by Grant-in-Aid
for Scientific Research 17H00762, 16H02870 and
16H01743 from the Ministry of Education, Cul-
ture, Sports, Science and Technology, Japan and the
next generation innovation project 2020 from Tokyo
Metropolitan Small and Medium Enterprise Support
Center.
REFERENCES
Bartholomew, J. and Mittwer, T. (1952). The Gram stain.
Bacteriol. Rev., 16:1–29.
Canny, J. (1986). A computional approach to edge detec-
tion. IEEE Trans. Patt. Anal. Mach. Intel., 8:679–698.
Carvajal, J., Smith, D., Zhao, K., Wiliem, A., Finucane, P.,
Hobson, P., Jennings, A., McDougall, R., and Lovell,
B. (2014). An early experience toward developing
computer aided diagnosis for Gram-stained smear im-
ages. In Proc. CVPR’14, pages 62–28.
Detection System of Gram Types for Bacteria from Gram Stained Smears Images
483

Keahler, A. and Bradski, G. (2013). Learning OpenCV:
Computer vision in C++ with the OpenCV library.
O’Reilly Media.
Krizhevsky, A., Sutskever, I., and Hinton, G. (2017). Im-
ageNet classification with deep convolutional neural
network. Comm. ACM, 60:84–90.
Lejon, S. and Andersson, E. (2016). Semi-automatic
segmentation, detection and classification of Gram
stained bacteria in blood sample. Master Thesis,
Lund University.
Li, F., Carreira, J., and Sminchisescu, C. (2010). Object
recognition as ranking holistic figure-ground hypothe-
ses. In Proc. CVPR’10, pages 1712–1719.
Mitsuda, T. (2004). Foundations of clinical microbial test-
ing for medical care of infectious diseases and infec-
tion control (in Japanese). International Medical Pub-
lisher.
Smith, K., Kang, A., and Kirby, J. (2018). Automated in-
terpretation of blood culture Gram stains by use of a
deep convolutional neural network. J. Clin. Microbio.,
56:e01521–17.
Yamamoto, T. (2015). Medical care support for infectious
disceases by using Gram stain (in Japanese). J. Japan.
Soc. Cli. Micribio., 25:265–276.
ICPRAM 2020 - 9th International Conference on Pattern Recognition Applications and Methods
484
