
Anomaly Detection in Communication Networks of Cyber-physical
Systems using Cross-over Data Compression
Hubert Schölnast
1,a
, Paul Tavolato
1,a
and Philipp Kreimel
2,b
1
Institute of IT Security Research, St. Pölten UAS, Matthias-Corvinus-Straße 15, St. Pölten, Austria
2
Limes Security GmbH, Hagenberg, Austria
Keywords: Anomaly Detection, Industrial Security, Substation Security, Cross-over Data Compression CDC.
Abstract: Anomaly detection in operational communication data of cyber-physical systems is an important part of any
monitoring activity in such systems. This paper suggests a new method of anomaly detection named cross-
over data compression (CDC). The method belongs to the group of information theoretic approaches and is
based on the notion of Kullback-Leibler Divergence. Data blocks are compressed by a Sequitur-like algorithm
and the resulting grammars describing the compression are applied cross-over to the all the other data blocks.
Divergences are calculated from the length of the different compressions and the mean values of these
divergences are used to classify the data in normal and anomalous. The paper describes the method in detail
and shows the results derived from a real-world example (communication data from a substation).
1 INTRODUCTION
Systems where embedded computing devices sense,
monitor, and control physical processes through
networks, usually with feedback loops in which
physical processes affect computations and vice versa
(Lee, 2008) are called cyber-physical systems (CPS).
These systems are becoming literally ubiquitous, and
our society and economy depends in a high degree on
the precise and stable operation of these systems.
Therefore, it is of course necessary to build and
install such systems according to rules of safety and
security. Besides that – which is a big challenge of its
own – it is necessary to monitor the operational
system continuously. External influence from the
environment might seriously disturb the system’s
operation, which could lead to unwanted
malfunctioning and in case of safety-critical system
even have disastrous consequences. Such external
influences may have their causes in abnormal changes
in the environment, in malfunctions of the interfaces
between the environment and the CPS, or in attacks
against the system. Especially the threat of cyber-
attacks legitimately gets more and more attention as
their number is increasing rapidly. The majority of
applications makes use of IP-based technology and
a
https:// https://isf.fhstp.ac.at/en
b
https://www.limessecurity.com
standard computing devices, hence opening points of
exposure and increasing the attack surface of CPSs in
a way that cannot be neglected any more. Moreover,
the complexity of the systems is growing rapidly as
they become smarter, make use of advanced
technologies, and consist of a high number of devices.
So the protection of these systems is a challenging
task.
One measure to meet these challenges are so-
called intrusion prevention and intrusion detection
systems. But, these defence mechanisms were
designed for common IT systems and often are not
applicable in smart CPS environments. Moreover,
there is no guarantee that any intrusion will be
detected in time. To ensure the protection of these
environments, a second line of defence is needed:
Certain security controls that monitor system
communication and operation in real-time, or at least
close-to-real-time are necessary. One possibility for
such defence systems is the implementation of an
anomaly detection system. Anomaly detection
systems consist of a formal model of normal system
behaviour and a monitoring component that compares
in real time the actual behaviour of the system with
the formal model. Too large deviations of the
498
SchÃ˝ulnast, H., Tavolato, P. and Kreimel, P.
Anomaly Detection in Communication Networks of Cyber-physical Systems using Cross-over Data Compression.
DOI: 10.5220/0008964104980505
In Proceedings of the 6th International Conference on Information Systems Security and Privacy (ICISSP 2020), pages 498-505
ISBN: 978-989-758-399-5; ISSN: 2184-4356
Copyright
c
2022 by SCITEPRESS – Science and Technology Publications, Lda. All rights reserved

system’s behaviour from the model forecasts are
identified as anomalies and will raise an alarm.
As of today, various formal models are used in
connection with anomaly detection: many of
statistical nature, such as outlier detection, cluster
analysis, or hidden Markov models; others are of
structural nature: neural networks, association rules
and syntactic pattern matching (Chandola et al.,
2009).
This paper suggests a new method for defining the
behaviour model of a CPS belonging to the family of
information theoretic models.
2 RELATED WORK
2.1 Anomaly Detection in General
For the field of anomaly detection there exists a still
valid survey article from 2009 by Chandola et al.
(Chandola et al., 2009) that gives a comprehensive
overview of methods and applications of anomaly
detection covering most of the field. With respect to
anomaly detection in (computer) networks there are
three more survey articles from recent years (Bhuyan
et al., 2013), (Ahmed et al., 2016), (Fernandes et al.,
2019) with thorough overviews.
The generally accepted definition of an anomaly
from (Chandola et al., 2009) reads as follows:
Anomalies are patterns in data that do not conform to
a well-defined notion of normal behaviour.
(Fernandes et al., 2019) gives a structured
overview of methods used for anomaly detection:
Statistical Methods
Clustering Methods
Finite State Machines
Classification Methods
Information Theory Models
Hybrid/Others
2.2 Statistical Methods
Statistical methods are based on stochastic models
and assume that normal “events” are found in regions
predicted by the model with high probabilities, while
anomalies are located in regions with low probability.
The use of wavelet analysis for anomaly detection
is described by (Hamdi et al., 2007) in detail.
Principal Component Analysis (PCA) is a method
based on dimension reduction and was first
introduced by (Lakhina et al., 2004). Several
improvements of the approach have been suggested.
(Yeung et al., 2007) introduced covariance matrices
to filter for variables having a high discriminatory
effect.
2.3 Clustering Methods
The 𝑘-means algorithm (MacQueen, 1967) assumes
that there are 𝑘 given clusters to group the elements
and is mainly based on comparing distances. The
method 𝑘-Nearest Neighbour first published in 1967
(Cover et al., 1967) clusters training data in an 𝑛-
dimensional space and uses these clusters to assign
new instances to the best-fitting cluster.
(Agrawal et al., 1998) describes a method for
dimensional reduction and calls it Subspace
Clustering; the approach assumes that projecting data
into a space with fewer dimensions may facilitate
clustering.
2.4 Finite State Machines
Finite state machines are an often-used mechanism to
detect anomalies. Normal data sequences are
modelled by regular expressions and the
corresponding finite state machine is used to verify
normal behaviour. Any data sequence not accepted by
the automaton is rejected as anomaly. This method
often comes along together with Markov chains
(Estevez-Tapiador et al., 2003). Intrusion detection
and prevention systems for conventional IT systems
often use this approach.
2.5 Classification Methods
Classification methods play an important role in
machine learning. The most important representatives
are Bayesian Networks (Jensen, 1997) and (Nielsen
et. al., 2007), Support Vector Machines (SVM)
(Schölkopf et al., 2001) and Neural Networks
(Haykin, 1994).
2.6 Information Theoretic Models
Shannon Entropy (Shannon, 1948) measures the
amount of uncertainty involved in the value of a
random variable.
Kullback-Leibler Divergence (Kullback et al.,
1951) is a measure for the difference between two
probability distributions. It can be used when
comparing two segments of data that represent the
behaviour of a system. The suggestion for a method
of anomaly detection described in this paper is
inspired by Kullback-Leibler Divergence. For further
details, see below.
Anomaly Detection in Communication Networks of Cyber-physical Systems using Cross-over Data Compression
499

Lee et al. (Lee et al., 2001) suggest a variety of
entropy-based methods to detect anomalies in data
used by intrusion detection systems. They analyse
Shannon Entropy, the entropy of dependent
probability distributions, the relative entropy of two
probability distributions, and information gain of the
attributes of a set of data. Bereziński (Bereziński et
al., 2015) and Martos (Martos et al., 2018) published
work using entropy-based methods, too.
2.7 Other Methods
Other methods used for anomaly detection are
derived from evolution theory (Kar, 2016), Artificial
Immune Systems (Castro et al., 2002), (Hooks et al.,
2018), Genetic Algorithms (Aslahi-Shahri et al.,
2016), (Hamamoto et al., 2018), Particle Swarm
Optimization (Bamakan et al., 2016), (Wahid et al.,
2019), Differential Evolution (Storn et al., 1997),
(Elsayed et al., 2015), and some hybrid approaches
combining two or more of the methods mentioned.
3 ANOMALY DETECTION BY
CROSS-OVER DATA
COMPRESSION
We define features relevant in describing the (normal)
operation of the CPS and an observation interval 𝑖.
We then collect the relevant data transmitted during
this interval in the network giving one block of data.
We do this with 𝑛 consecutive intervals. Each
interval yields a data block 𝑏
. Now we compress
each data block separately as described later on. Each
compression results in a compressed file 𝑐
,
and a
grammar (substitution table) 𝑔
describing the
compression; we assume 𝑔
is contained in 𝑐
,
. In the
next step we use all grammars 𝑔
instead of 𝑔
to
compress the block 𝑏
which results in the
compressed files 𝑐
,
. We do this for all combinations
of 𝑖 and 𝑗. Since 𝑔
is not optimal to compress 𝑏
, the
compressed file 𝑐
,
will be larger than 𝑐
,
. The
difference of the lengths of 𝑐
,
and 𝑐
,
is called the
divergence 𝑑
,
. It is a measure for the degree of
similarity of the block 𝑏
(which was compressed)
compared to the block 𝑏
(from which the grammar,
used in the compression algorithm, was extracted).
3.1 Data Acquisition and Features
We consider a communication network in a CPS. We
collect the data transmitted over the network splitting
it into segments. These segments or blocks will be the
units of analysis later on. There are two main features
we have to take into consideration:
a) Whether the data stream is encrypted or not.
b) Whether the protocol used in the network is
synchronous (like Modbus, HDLC and others) or
asynchronous (like Canbus or IEC 61850 or IEC
60879-5-104).
If the data stream is encrypted and we do not have
the possibility to access the decrypted information,
anomaly detection can be based on the available
metadata only, like packet frequency or roundtrip
times.
The type of protocol (synchronous or
asynchronous) has influence on the collection
intervals of the data. If the protocol is synchronous,
we can construct data segments by simple time
slicing: In case of an asynchronous protocol, time
slicing is not an appropriate method as data packets
arrive in arbitrary intervals. In this case, we can
construct segments by counting the number of
packets of a certain important type: a segment is
defined as the interval necessary to transmit a
predefined number of packets.
3.2 Anomaly Detection
The method so far yields a sequence of features from
each block of data analysed. The question now is how
to compare these blocks to decide whether the data
describes normal or abnormal operation of the
system.
We suggest a method that measures a special form of
“distance” between the blocks by looking at the
amount of redundancy contained in a block. The
method is inspired by the notion of Kullback-Leibler
Divergence (also known as “relative entropy”). This
is a non-negative real number that can be calculated
from two probability distributions 𝑃 and 𝑄, where 𝑄
in many cases is a predicted distribution (a
hypothesis) and 𝑃 is a measured distribution
(empirical data). The formula is:
𝐷
𝑃∥𝑄
=𝑃
𝑥
∙log
𝑃
𝑥
𝑄
𝑥
∈
The alphabet 𝑋 is the set of all characters 𝑥 that
may appear in both distributions. 𝑃
𝑥
is the
probability that the character 𝑥 will appear at any
arbitrary position within the distribution 𝑃;
analogously for 𝑄
𝑥
.
The formula above can be converted to:
ICISSP 2020 - 6th International Conference on Information Systems Security and Privacy
500

𝐷
𝑃∥𝑄
=−𝑃
𝑥
∙log
𝑄
𝑥
∈
−−𝑃
𝑥
∙log
𝑃
𝑥
∈
The part in the first pair of big brackets is the cross
entropy of 𝑃 and 𝑄, the part in the second pair of
brackets is the well-known Shannon Entropy 𝛨 of 𝑃.
The Shannon Entropy is a property of a character-
source that emits characters from the alphabet 𝑋 with
probability distribution 𝑃. 𝛨 is the amount of
information per character emitted by this source.
Often 𝛨 is interpreted as a compression factor: A
string of 𝑛 characters, which is emitted from this
source can (so says theory), be compressed to a binary
string with a length of 𝑛∙𝛨 bits.
In accordance with this interpretation of Shannon
Entropy, Kullback-Leibler Divergence can be inter-
preted as the average number of bits wasted per
character when a string, emitted by a source having
probability distribution 𝑃 is not compressed by a
method optimized for its own distribution 𝑃 but using
a method that is optimized for the probability
distribution 𝑄.
The problem with the value calculated using the
formula shown above is that within probability
distributions the effective order of the characters is
irrelevant. Take these 3 strings as an example:
A: 00000000000000001111111111111111
B: 01010101010101010101010101010101
C: 01101001000110010001111101110100
They all consist of 16 zeros and 16 ones, so for all
3 examples we have 𝑃
0
=𝑃
1
=
and therefore
all three have the same Shannon Entropy 𝛨
=𝛨
=
𝛨
=1. However, compressing those strings
optimally (make them as short as possible), one finds
that A and B will result in shorter compressed strings
than C.
If you calculate the Kullback-Leibler Divergence
for any pair of those strings, you will always get
𝐷=0, which is correct because all three probability
distributions are equal, so there is no difference.
However, if you find the optimal method to compress
string C and use this very method to compress string
A, the compression result is worse than if you had
taken the method optimal for A. Therefore, if you
really compress strings or files, you get different
results than what the common interpretation of
Kullback-Leibler Divergence suggests.
However, we assume that the effective number of
wasted bits you get when compressing a string with a
method optimized for another string might be a good
candidate to measure how different two strings are.
Therefore, we developed a method to do exactly what
corresponds to the common interpretation of
Kullback-Leibler Divergence.
Practically the method works as follows: Let the
data from each interval 𝑖 be a block 𝑏
and the
number of blocks be 𝑛. To each block belongs a
grammar (a set of replacement rules) which at the
beginning is empty. 𝑏
is compressed by a Sequitur-
like algorithm (Nevill-Manning et al., 1997) yielding
a compressed file 𝑐
,
and a grammar 𝑔
describing
the compression. The compression method searches
for the most frequent bigram in 𝑏
(a bigram is a
group of two subsequent characters) and substitutes
each instance of this bigram with a single character,
which did not appear in any 𝑏
before. The new
replacement character and the two characters forming
the replaced bigram together build one replacement
rule that is added to the grammar. So, each rule in the
grammar consists of exactly 3 characters. The data
block wherein the bigrams have been replaced plus
the grammar together build a compressed version of
𝑏
(i.e. 𝑏
). This procedure is repeated until no more
improvement in the compression ratio is achieved, i.e.
as long as 𝑏
becomes shorter from round to round.
The minimum-length version of 𝑏
(compressed data
plus grammar) is the compressed file 𝑐
,
and the
grammar 𝑔
is part of 𝑐
,
.
In the next step each data block 𝑏
is compressed
using all other grammars 𝑔
. This means: You don’t
search for the most frequent bigram, but take the
bigram that is contained in the grammar and replace
each instance of it with the character from the
grammar. You repeat this for each rule in the
grammar. Compressing 𝑛 data blocks with 𝑛
grammars gives 𝑛
compressed files 𝑐
,
.
Now we subtract the length of the optimal
compression 𝑐
,
from the length of 𝑐
,
where the
length 𝑙 is the number of characters. The difference is
the divergence 𝑑
,
.
𝑑
,
∶= 𝑙𝑐
,
−𝑙𝑐
,
These lengths form an 𝑛×𝑛 divergence matrix ℒ.
Note: the elements in the main diagonal of the
matrix are always 0: 𝑑
,
=0 for all 𝑖. 𝑑
,
≥0 for all
𝑖≠𝑗, which means that ll other values are non-
negative integers (equal only when 𝑏
and 𝑏
are two
identic instances of the same string).
𝑑
,
≠𝑑
,
for most 𝑖,𝑗. The matrix is not
symmetric. By accident 𝑑
,
and 𝑑
,
can be equal, but
generally they are not.
A column of ℒ represents the length differences
of all blocks compressed with one specific grammar.
Anomaly Detection in Communication Networks of Cyber-physical Systems using Cross-over Data Compression
501

A row of ℒ represents the length differences of all
compressions of one specific block using different
grammars.
Now we calculate for each column and each row
the average value of non-diagonal elements. For
comparison we can look either at the averages of
columns or at the averages of rows. Both should give
a reasonable measure of the information distance
between the blocks. The smaller the difference
between the averages of two rows 𝑖 and 𝑗, the smaller
is the information theoretic distance between the
blocks 𝑏
and 𝑏
.
Whether the column averages or the row averages
show a better correspondence seems to depend on the
specific application where the data comes from. This
topic still needs further investigations. For our
analysis we use both.
To the end of anomaly detection, we must
calculate the matrix ℒ from a number of data blocks
taken from a system showing normal behaviour. For
the row averages (and the column averages), we can
then calculate a mean value (which by definition is
equal for rows and columns) and the standard
deviation (which is not equal). These two values can
be used to detect a data block that shows a value
differing more than say 3 times the standard deviation
from the mean value derived from normal behaviour.
4 EXAMPLE: SUBSTATION
4.1 Topology of the Example CPS
To demonstrate the viability of the proposed anomaly
detection method we chose a component from the
distribution network for electrical energy: a
substation. Generally, substations transform electric
current changing its voltage. As part of the
distribution network for electrical energy, substations
are an eminent part of the critical infrastructure.
Figure 1: Configuration of a substation.
We used a testbed of a (small) substation. Figure
1 shows the main elements of the configuration of the
testbed resembling an automation network of a
typical substation. The RTUs (remote terminal units)
are connected to a switch. For the experiments, the
testbed we used was equipped with 4 RTUs. The
switch connects the protection zone to an engineering
zone in the substation and further on to the outside
world.
In this testbed, we simulated the operation of a
substation used in a solar plant by a software
developed for testing purposes. The protocol used
was IEC 60870-5-104. This protocol is TCP/IP-based
and by definition does not provide up-to-date security
mechanisms. For example, the protocol transmits
messages in clear text without any form of
authentication. Therefore, such systems are very
susceptible for network-based attacks such as Man-
in-the-Middle and protocol-specific attacks.
4.2 Data Collection
We captured the network traffic from a mirror port of
the switch. The protocol IEC 60879-5-104 is an
asynchronous protocol and the number of messages
defined the collection interval. For each
measurement, we selected the following data:
rtt: round-trip-time of the packet
length: packet length
wsize: TCP window size
ioa89: information object at address 89 containing
the voltage of the input current from the solar
panel
We collected 200 data blocks during normal
operation of the substation. The data was stored in
form of a csv-file for each block and the following
compression algorithm worked solely on the text
(characters) in the file (even for the numbers). Here
we use the label “valid” for these valid data.
Furthermore, we performed cyber-attacks against
the system and collected the data from the system
under attack. The following attacks have been
performed:
Man-in-the-Middle Filter Attack (labelled as
“filter”): overwrites the transmitted measurement
data with a constant value.
Man-in-the-Middle Increment Attack (label:
“incr”): changes the transmitted measurement
data by a small amount (+ 0,1-1,0). This can result
in unknown system states.
Man-in-the-Middle Drop Attack (label: “drop”):
packets containing a certain value are dropped.
The data collected during the attacks was the same as
during normal operation: rtt, length, wsize, ioa89. The
files are structurally identical with files gathered
during normal operation.
ICISSP 2020 - 6th International Conference on Information Systems Security and Privacy
502

In both cases (data describing valid behaviour of
the system and data gathered from the system under
attack), we have discarded measurements about
packages that did not transmit a voltage, as they were
not significant for the behaviour of the system and
could be considered outliers.
4.3 Anomaly Detection
To describe the normal behaviour of the system we
started with 𝑛=200 data files collected during
normal operation of the system. Every file is a data
block 𝑏
and was compressed with a Sequitur-like
algorithm giving 200 compressed files 𝑐
,
and 200
grammars 𝑔
. In the next step each (original) file is
compressed by using all other grammars 𝑔
, yielding
40.000 compressions 𝑐
,
. From this, we calculate the
divergence matrix ℒ. From this matrix we calculate
the row and column averages. At last, we calculate
the mean value and standard deviation of these
averages. These values (one total average and two
standard deviations) describe the normal behaviour of
the system. To facilitate further comparisons, we
consolidated the two standard deviations into one
single number by taking the square root from the sum
of the squares of the two standard deviations.
𝜎∶=
𝜎
+𝜎
Now we carry out the same procedure with the
data we collected from the system during each of the
attacks. This leads to a mean value and a consolidate
standard deviation for each attack allowing a
comparison of these values to check whether
anomalies can be detected with appropriate
accuracy
an anomaly can be assigned to the right attack.
4.4 Example Calculation
The numbers in the following example are taken from
the data collected from the testbed (during normal
operation and under attack).
Figure 2: Excerpt of the complete divergence matrix.
There is the divergence matrix ℒ (showing a
small section of the large 271x271 matrix). The 6
rows and columns with valid data define the normal
behaviour of our system. The values in the row and
the column labelled “filter” come from an attack. We
want to find out, if those values are sufficiently
different from valid data. So considering valid data
only, we calculate the average of the non-diagonal
values for each row and each column. This leads to
the following table:
Figure 3: Averages for valid data.
Next we calculate the total average, which is
122.5, and the standard deviations which are 44.79 for
the column “avg row” and 45.30 for the row “avg
col”. The consolidated standard deviation is 𝜎=
63.70.
Then we calculate the average of the values in the
row “filter” and the column “filter” shown in the first
matrix. This average value is 871.2. From this value
we subtract the average value for the block of valid
values (122.5) and we get:
871.2 – 122.5 = 748.6
Dividing this number by 𝜎 gives:
748.6
63.70
=11.75
We now know that the values from the file “filter”
are 11.75 times 𝜎 away from the average of the valid
data. As this is much more than the usually used limit
in statistics of 3𝜎, we can conclude, that the data in
the row and column “filter” are anomalous.
4.5 Results
Calculations were carried out on the 200 files
collected during normal (valid) operation, and on 71
additional files collected from the system under
attack. There were three different attack classes (34
“filter”, 17 “drop” and 20 “incr”). Figure 4 shows a
colour-encoded picture of the complete 271x271
divergence matrix ℒ as. The 0’s in the diagonal are
shown as white pixels.
Anomaly Detection in Communication Networks of Cyber-physical Systems using Cross-over Data Compression
503
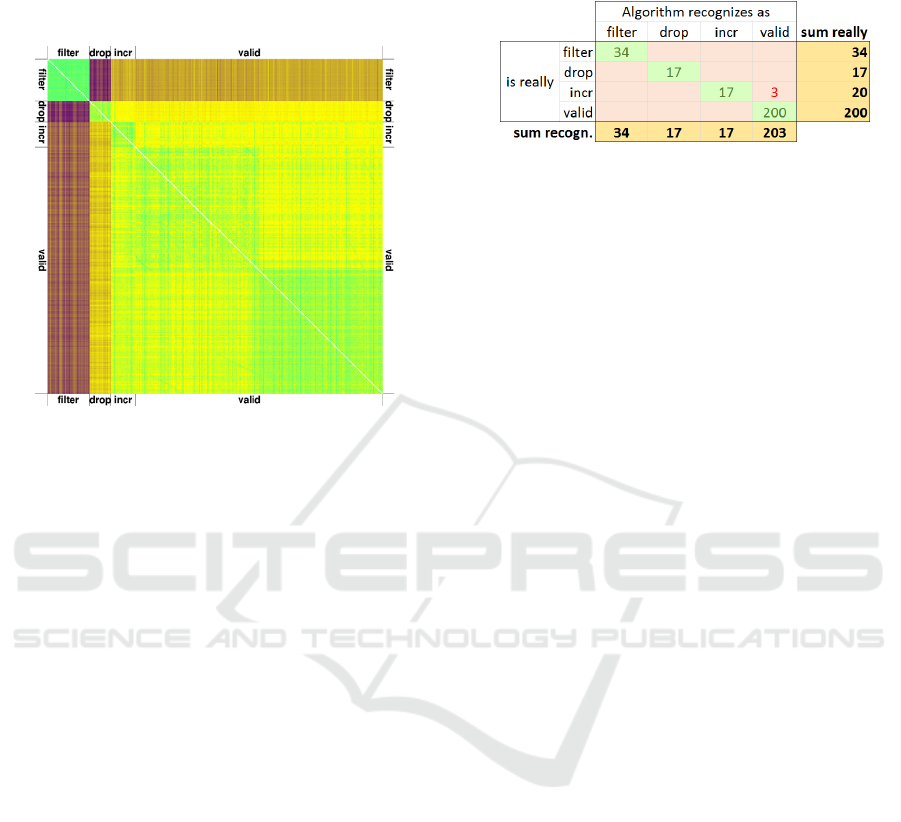
Bright green stands for low divergence (i.e. high
similarity), bright yellow and medium bright brown
depict medium values and dark violet stands for high
values of 𝑑
,
.
Figure 4: Colour-encoded 271x271 div-matrix.
We see from this picture, that the filter attacks are
all very homogenous (bright green square in the upper
left corner), but they differ strongly from the rest. The
highest divergence exists between the attack types
“filter” and “drop”. The divergence of “drop” and
“valid” can be separated by sight, but “incr” is hard
to distinguish from “valid”.
By visual inspection one can find four quadrants
(green and yellow) within the block of valid data. The
reason for this is that the data was collected from two
different RTUs (remote terminal units), and hence
contain slightly different voltages.
To distinguish between “incr” and “valid” using
cross-over data compression we have to take a closer
look at the numbers:
The method used above to determine whether the
data from a specific file corresponds to normal
operation (is valid) or not can also be applied to test
the membership of the data to the attack types “filter”,
“drop” or “incr” (or any other class).
To do so, we compare the differences between the
file of interest and the classes, measured in units of 𝜎.
We allocate each file to the class that produces the
lowest 𝜎- distance for this file.
Using cross-over data compression 268 files are
allocated to the correct class. Only three files
belonging to the attack class “incr” were
misrecognized. They were classified as “valid” by the
algorithm. However, attacks from the class “incr”
have proven to be hard to detect by other methods,
too. Some of these attacks changed the voltage value
only insignificantly, making the distinction from
valid data tricky.
Figure 5: Summary of assignments.
5 CONCLUSIONS
This paper presents a novel way of anomaly detection,
which we call Cross-over Data Compression (CDC).
The key characteristic of the method is the calculation
of differences between the lengths of compressed files
where different grammars were used for compression.
In an information theoretic sense one could summarize
the method by saying that we use the divergence of
redundancies between data blocks to define similarities
of the blocks. By observing a reasonable number of
data blocks collected during normal operation of the
system we can find a mean value and standard
deviation of the compressions – be it in terms of the
data blocks compressed with the grammars of the all
the other blocks or be it in terms of the grammars
applied to all blocks. Which of these two versions
yields better results seems to depend on the application
where the original data was collected. In case of the
data from the substation network, it did not show big
differences. But this is not necessarily the case in any
situation, as we have observed. This question sure
needs further investigation.
The results of the experiments we conducted on
data from substations show that the method of cross-
over data compression is a suitable possibility for
anomaly detection in network data from industrial
communication networks.
ACKNOWLEGDEMENTS
The project is funded by the KIRAS program and the
Energy Research program of the Austrian Research
Promotion Agency (FFG).
REFERENCES
Lee, Edward A. (2008) "Cyber physical systems: Design
challenges." Technical Report UCB/EECS-2008-8.
ICISSP 2020 - 6th International Conference on Information Systems Security and Privacy
504

EECS Department, UC California, Berkeley.
http://www.eecs.berkeley.edu/Pubs/TechRpts/2008/EE
CS-2008-8.html [online; Oct 24th 2019]
Chandola, V., Banerjee, A. and Kuma, V. (2009) "Anomaly
detection: A survey" ACM computing surveys (CSUR),
41(3), 15.
Bhuyan, M. H., Bhattacharyya, D. K., and Kalita, J. K. (2013)
"Network anomaly detection: methods, systems and
tools" Ieee communications surveys & tutorials, 16(1),
303-336.
Ahmed, M., Mahmood, A. N., and Hu, J. (2016) "A survey
of network anomaly detection techniques" Journal of
Network and Computer Applications, 60, 19-31.
Fernandes, G., Rodrigues, J. J., Carvalho, L. F., Al-Muhtadi,
J. F., and Proença, M. L. (2019) "A comprehensive
survey on network anomaly detection"."
Telecommunication Systems, 70(3), 447-489.
Hamdi, M., and Boudriga, N. (2007) "Detecting Denial-of-
Service attacks using the wavelet transform" Computer
Communications, 30(16), 3203-3213.
Lakhina, A., Crovella, M., and Diot, C. (2004) "Diagnosing
network-wide traffic anomalies" ACM SIGCOMM
computer communication review (Vol. 34, No. 4, pp.
219-230). ACM.
Yeung, D. S., Jin, S., and Wang, X. (2007) "Covariance-
matrix modeling and detecting various flooding attacks"
IEEE Transactions on Systems, Man, and Cybernetics-
Part A: Systems and Humans, 37(2), 157-169.
MacQueen, J. (1967) "Some methods for classification and
analysis of multivariate observations" Proceedings of the
fifth Berkeley symposium on mathematical statistics and
probability (Vol. 1, No. 14, pp. 281-297).
Cover, T., and Hart, P. (1967) "Nearest neighbor pattern
classification" IEEE transactions on information theory,
13(1), 21-27.
Agrawal, R., Gehrke, J., Gunopulos, D., and Raghavan, P.
(1998) "Automatic subspace clustering of high
dimensional data for data mining applications" (Vol. 27,
No. 2, pp. 94-105). ACM.
Estevez-Tapiador, J. M., Garcia-Teodoro, P., and Diaz-
Verdejo, J. E. (2003) "Stochastic protocol modeling for
anomaly based network intrusion detection" First IEEE
International Workshop on Information Assurance,
2003. IWIAS 2003. Proceedings. (pp. 3-12). IEEE.
Jensen F. V. (1997) "An introduction to Bayesian networks"
Springer, ISBN 9780387915029
Nielsen T. D., Jensen F. V. (2007) "Bayesian Networks and
Decision Graphs" Springer, ISBN 9780387682815
Schölkopf B., and Smola A. J. (2001) "Learning with kernels:
support vector machines, regularization, optimization,
and beyond" MIT press, ISBN 9780262256933
Haykin S. (1994) "Neural networks: a comprehensive
foundation". Prentice Hall New York, ISBN
9780132733502
Shannon C. E. (1948) "A mathematical theory of
communication" The Bell System Technical Journal
27(3), 379-423
Kullback, S., and Leibler, R. A. (1951) "On information and
sufficiency" The annals of mathematical statistics, 22(1),
79-86.
Lee, W., and Xiang, D. (2001) "Information-theoretic
measures for anomaly detection" Proceedings 2001 IEEE
Symposium on Security and Privacy. S&P 2001 (pp.
130-143).
Bereziński, P., Jasiul, B., and Szpyrka, M. (2015) "An
entropy-based network anomaly detection method"
Entropy, 17(4), 2367-2408.
https://www.mdpi.com/1099-4300/17/4/2367 [online;
Oct 24th 2019]
Martos, G., Hernández, N., Muñoz, A., and Moguerza, J.
(2018) "Entropy measures for stochastic processes with
applications in functional anomaly detection". Entropy,
20(1), 33. https://www.mdpi.com/1099-4300/20/1/33
[online; Oct 24th 2019]
Kar, A. K. (2016) "Bio inspired computing – a review of
algorithms and scope of applications". Expert Systems
with Applications, 59, 20-32.
Castro, L. N., De Castro, L. N., and Timmis, J. (2002)
"Artificial immune systems: a new computational
intelligence approach" Springer.
Hooks, D., Yuan, X., Roy, K., Esterline, A., and Hernandez,
J. (2018) "Applying artificial immune system for
intrusion detection" 2018 IEEE Fourth International
Conference on Big Data Computing Service and
Applications (BigDataService) (287-292).
Aslahi-Shahri, B. M., Rahmani, R., Chizari, M., Maralani,
A., Eslami, M., Golkar, M. J., and Ebrahimi, A. (2016)
"A hybrid method consisting of GA and SVM for
intrusion detection system" Neural computing and
applications, 27(6), 1669-1676.
Hamamoto, A. H., Carvalho, L. F., Sampaio, L. D. H., Abrão,
T., and Proença Jr, M. L. (2018) "Network anomaly
detection system using genetic algorithm and fuzzy
logic" Expert Systems with Applications, 92, 390-402.
Bamakan, S. M. H., Wang, H., Yingjie, T., and Shi, Y. (2016)
"An effective intrusion detection framework based on
MCLP/SVM optimized by time-varying chaos particle
swarm optimization" Neurocomputing, 199, 90-102.
Wahid, A., and Rao, A. C. S. (2019) "A distance-based
outlier detection using particle swarm optimization
technique" Information and Communication Technology
for Competitive Strategies (pp. 633-643). Springer,
Singapore.
Storn, R., and Price, K. (1997) "Differential evolution – a
simple and efficient heuristic for global optimization
over continuous spaces" Journal of global optimization,
11(4), 341-359.
Elsayed, S., Sarker, R. and Slay, J. (2015) "Evaluating the
performance of a differential evolution algorithm in
anomaly detection" 2015 IEEE Congress on
Evolutionary Computation (CEC) (pp. 2490-2497).
Nevill-Manning, C.G. and Witten, I.H. (1997) "Linear-Time,
Incremental Hierarchy Inference for Compression"
Proceedings DCC '97. Data Compression Conference.
pp. 3–11
Anomaly Detection in Communication Networks of Cyber-physical Systems using Cross-over Data Compression
505
