
Combining Video and Wireless Signals for Enhanced Audience Analysis
Miguel Sanz-Narrillos, Stefano Masneri and Mikel Zorrilla
Vicomtech, Mikeletegi Pasealekua 57, Donostia-San Sebasti
´
an, Spain
Keywords:
Multi-modal Analysis, Person Analysis, Wireless Detection, Computer Vision, Audience Engagement.
Abstract:
We present a system for audience engagement measurement which combines wireless and vision-based de-
tection techniques. The system is able to detect the position and the movements of the audience during a live
event with rapidly varying illumination. At the heart of the paper is an approach to use a wireless-based person
detection and tracking system to guide the preprocessing of the frames which are fed to the CNN performing
person analysis. We show that the hybrid system performs better than standard vision-based approaches and
can be successfully deployed in environments with challenging illumination conditions.
1 INTRODUCTION
The entertainment industry has gone through a huge
development in the recent years, in large part due to
the implementation of entertainment services on in-
ternet as well as the migration of services to the web.
This transition has brought more users to the plat-
forms (Deloitte, 2018), enhanced the user engage-
ment and increased exponentially the data collected
from the people using the service. Such data can be
used for increasing revenues (Granados, 2018) (for
example through better advertising via user profiling),
but it can also be used as a tool to improve the service.
Technological evolution, especially in recent
years, has been the main factor leading to the changes
in the entertainment sector. For traditional shows
(such as live concerts) it is rarely the case that the
events are available to the online audience. The addi-
tion of online audience (and interaction) to an event
provides the event organizers with a huge amount of
data which is usually not obtainable during in-person
only events (Mitchell, 2014). As this information is
valuable, more and more companies and event orga-
nizers are interested in extracting such data also from
analyzing the audience during live events, usually
using computer vision techniques or feedback data
from social media.
This paper describes a proof-of-concept system
used to run person analysis during live events and
measure how much the audience is involved and in-
terested in the event. Most of the metrics used to
estimate the user engagement (such as gaze detec-
tion, emotion analysis, person location or activity
recognition) rely on the accurate detection of a per-
son face and body as well as tracking its movements
over time. For this reason in this work we develo-
ped methods for accurately localize and track people
during live events, in challenging illumination condi-
tions that make it hard for existing implementations
to work correctly.
Computer vision-based localization techniques
are usually implemented using convolutional neural
networks (CNNs) (Razavian et al., 2014). These
tools, although powerful, have two shortcomings:
they need big training datasets and they usually per-
form poorly on data points outside the domain of the
training dataset. This means that a network trained on
a specific task doesn’t usually generalize to data co-
ming from different environments, thus requiring fur-
ther training and the application of domain adaptation
techniques.
One example where existing network architec-
tures will fail is in a live-event scenario, where the
objective is to detect people faces and track the pose
and the movements of the audience. Existing archi-
tectures are not designed or trained using images with
poor illumination conditions and do not consider the
possibility that the illumination (due to moving lights
in the scenario) could change abruptly in the same
image.
A possible solution to these problems is to use an-
other source of information, for example localization
based on wireless signals such as Wi-Fi or Bluetooth,
to steer the pre-processing of the data fed into the neu-
ral network so that it could provide higher accuracy
results without requiring any domain adaptation.
Sanz-Narrillos, M., Masneri, S. and Zorrilla, M.
Combining Video and Wireless Signals for Enhanced Audience Analysis.
DOI: 10.5220/0008963101510161
In Proceedings of the 12th International Conference on Agents and Artificial Intelligence (ICAART 2020) - Volume 2, pages 151-161
ISBN: 978-989-758-395-7; ISSN: 2184-433X
Copyright
c
2022 by SCITEPRESS – Science and Technology Publications, Lda. All rights reserved
151

The main contribution of this paper is the imple-
mentation of a hybrid system which uses computer
vision and wireless signal analysis techniques for de-
tection and tracking of people in live events. The use
of a hybrid approach, apart from providing more user
information, allows higher detection and tracking ac-
curacy than using the two methods separately with
the same dataset. Furthermore, the system is robust
to sudden illumination changes and noisy environ-
ments, without requiring additional training, opening
the possibility to use standard dataset and adapt the
input to that dataset using preprocessing techniques.
The code of the system and the data used during
the experiments are available on Github
1
.
2 RELATED WORK
2.1 Vision-based Human Analysis
The detection of people in still images and video has
long been one of the most studied problems in com-
puter vision. Prior to the advent of deep learning
based techniques, the standard approach was to create
a human model using image keypoints and descrip-
tors, for example Haar cascades methods (Lienhart
and Maydt, 2003), Support Vector Machines (Bour-
dev and Malik, 2010; Malisiewicz et al., 2011) or His-
togram of oriented gradients (Dalal and Triggs, 2005).
In recent years, thanks to the availability of datasets
such as ImageNet (Deng et al., 2009) or Microsoft
COCO (Lin et al., 2014) and the increase of com-
putational CPU and GPU power, convolutional neu-
ral networks became the standard tool used for ob-
jects detection and tracking. The architectures most
commonly used for this task are R-CNN and its evo-
lutions (Girshick et al., 2014; Girshick, 2015; Ren
et al., 2015), You Only Look Once (YOLO) (Red-
mon et al., 2016; Redmon and Farhadi, 2018) or Sin-
gle Shot multibox Detector (SSD) (Liu et al., 2016).
More advanced architectures can provide a pixel-level
segmentation of the person detected (He et al., 2017),
while others detect the position of the joints in order
to estimate the person pose (Sun et al., 2019; Cao
et al., 2018; Su et al., 2019; Chang et al., 2018).
Such algorithms rely on datasets specifically created
for the task such as MPII Human Pose (Andriluka
et al., 2014) and Leeds Sports Pose (Johnson and Ev-
eringham, 2010).
1
Indoor person localization hybrid system in live events.
https://github.com/tv-vicomtech/AudienceEngagement.
2.2 Wireless-based Human Analysis
The standard approach for detecting and tracking peo-
ple using wireless signals is to rely on the Wi-Fi
and Bluetooth signals provided by a smartphone or
other wireless capable devices carried by the user.
One of the possible approaches relies on RSSI fin-
gerprinting (Yiu et al., 2017), where the communi-
cation signal strength is used to determine the dis-
tance of the device from the receptor. In order to
obtain a reliable position trilateration must be used,
combining the data from several receptors (Oguejio-
for et al., 2013). Other approaches rely on wireless
time of flight (Lanzisera et al., 2011), which uses the
time between the emission and reception to determine
the distance between the devices and from that infer
the persons position. Another technique is the wire-
less angle of arrival (Peng and Sichitiu, 2007; Gupta
and Kar, 2015), where an antenna array measures the
angle of arrival of the signal instead of the ToF. In
this case the angle from the device to the receptor
is calculated by having an antenna array as receptor
and with the difference on the reception time between
each of the antennas the angle of the signal can be
calculated, and with trilateration the position can be
approximated. A technique that does not need the per-
son to carry a device is the ones used in WI-SEE and
WI-VI (K.Nanani and M V V Prasad, 2013), where
the shape of objects in the room is computed by an-
alyzing the reflection of the Wi-Fi waves, and uses
those to detect the position of the persons.
2.3 Audience Engagement Systems
As mentioned in section 1 most of the engagement
systems are designed for online events because in
those cases the infrastructure necessary is already
available. Systems for online learning (Meyer, 2014;
Khalil and Ebner, 2017), social media (Schivinski
et al., 2016) or news (Bodd, 2018) already implement
tools for measuring user engagement. In the case of
live events the infrastructure and the system have to
be built separately, although some interactions can
be created with electronic devices such as lights or
screens. Most current engagement systems depends
on the usage of an external device to provide the in-
formation about the engagement. One example of en-
gagement system is the glisser app (Glisser webpage,
2019), in which the event manager can implement
questionnaires, slide sharing or a Twitter wall. In this
case only the information that the person writes in the
app is considered as engagement. Another approach
to have a more truthful information has been the us-
age of electroencephalograms to measure the signals
ICAART 2020 - 12th International Conference on Agents and Artificial Intelligence
152
produced in the brain as in the engageMeter (Hassib
et al., 2017). Such systems are not very suitable to be
used in events such as concerts where multiple people
are moving and user engagement has to be measured
in an indirect way.
2.4 Multi-modal Systems.
The usage of different techniques and methods to-
gether has been used for many years in the develop-
ment of new systems to improve the final results. In
the detection field this type of systems has been used
in recent years for autonomous vehicles (Asvadi et al.,
2018), combining a CNN and Lidar, person detection
systems (Spinello et al., 2008), which uses laser and
camera data, and some datasets has been created for
this type of systems such as a fall detection (Mart
´
ınez-
Villase
˜
nor et al., 2019), which combines information
from video and wearable sensors.
3 METHODS
3.1 CNN-based Detection and Tracking
The standard approach for detecting and tracking peo-
ple (for example in audience monitoring or surveil-
lance applications) involves using one or multiple
cameras to record the room and locate the people
position. The reference used for our work is (Pa-
pandreou et al., 2018), a person detection technique
which also performs pose estimation and instance
segmentation, and provides good accuracy results in
densely packed scenes (i.e. with more than 30 peo-
ple). Our implementation is a modified version of
(Wightman, 2018). Our modifications are mostly re-
lated to performance improvement and the addition
of several methods for preprocessing, selecting which
joints to detect, selecting which parts of the image to
process and adding a tracking module. Our imple-
mentation includes also a module for gaze detection
based on (Wang and Sung, 2002), since gaze infor-
mation is very valuable for audience monitoring ap-
plications. The gaze detection is combined with the
position obtained to determine if the person is look-
ing at the show or not and with that determine the
engagement of the person.
The dataset used for training this CNN is COCO,
which contains more than 200K labeled images with-
out preprocessing, although not all them are contain
people in different positions and places, with normal
illumination conditions, with annotation of the differ-
ent joints and face parts.
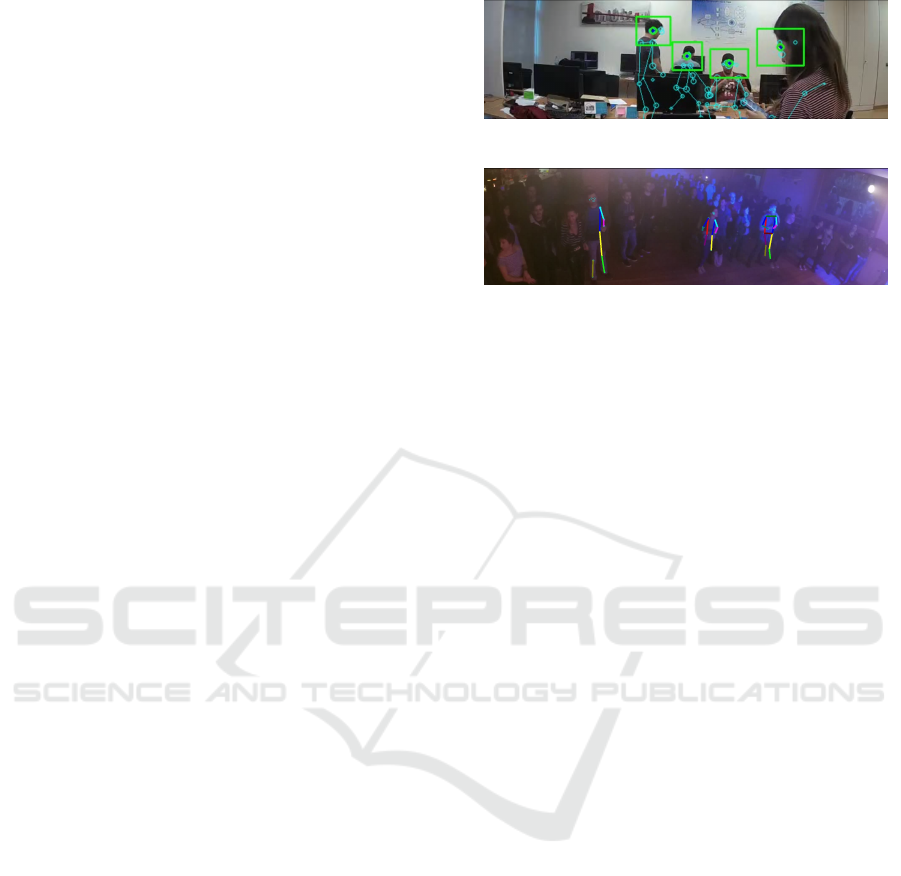
(a) Good illumination and positioning
(b) Illumination changing and strange positioning
Figure 1: Pose and person detection under different illumi-
nation conditions.
The implementation in (Wightman, 2018) shows
a steep decline in the accuracy of detections when
the illumination conditions of the scene are not rep-
resented in the training set. An example of such per-
formance decay can be seen in Fig. 1, where the de-
tection is perfect in the upper figure, while in the bot-
tom image a very small percentage of the people gets
detected. This is caused by not having the network
trained with all the possible illumination conditions,
which can be very difficult to be predicted beforehand
for a live event such as a concert.
Comparing the two images in Fig. 1 it can be ea-
sily seen that the main difference between them is the
illumination conditions as the image with higher ac-
curacy has higher brightness and contrast than the one
with bad conditions. In audience monitoring applica-
tions (such as during live events) it is highly likely that
the illumination conditions vary over time, and often
different parts of the scene have different brightness
and contrast. In this case any person detection algo-
rithm is doomed to fail unless the input frames are
pre-processed so that they provide the same illumina-
tion conditions across the whole image as well as over
time. Section 3.3 describes in detail how our imple-
mentation chooses the parameters used to pre-process
the input frames before feeding them to the neural net-
work.
3.2 Wireless Data
Nowadays every person carries at least one device ca-
pable of receiving wireless signals such as Wi-Fi or
Bluetooth most of the time inside their pockets. This
types of signals have been used to locate devices for
quite a long time (Altini et al., 2010; K.Nanani and M
V V Prasad, 2013; Dari et al., 2018) because the low
difficulty in its implementation.
Combining Video and Wireless Signals for Enhanced Audience Analysis
153
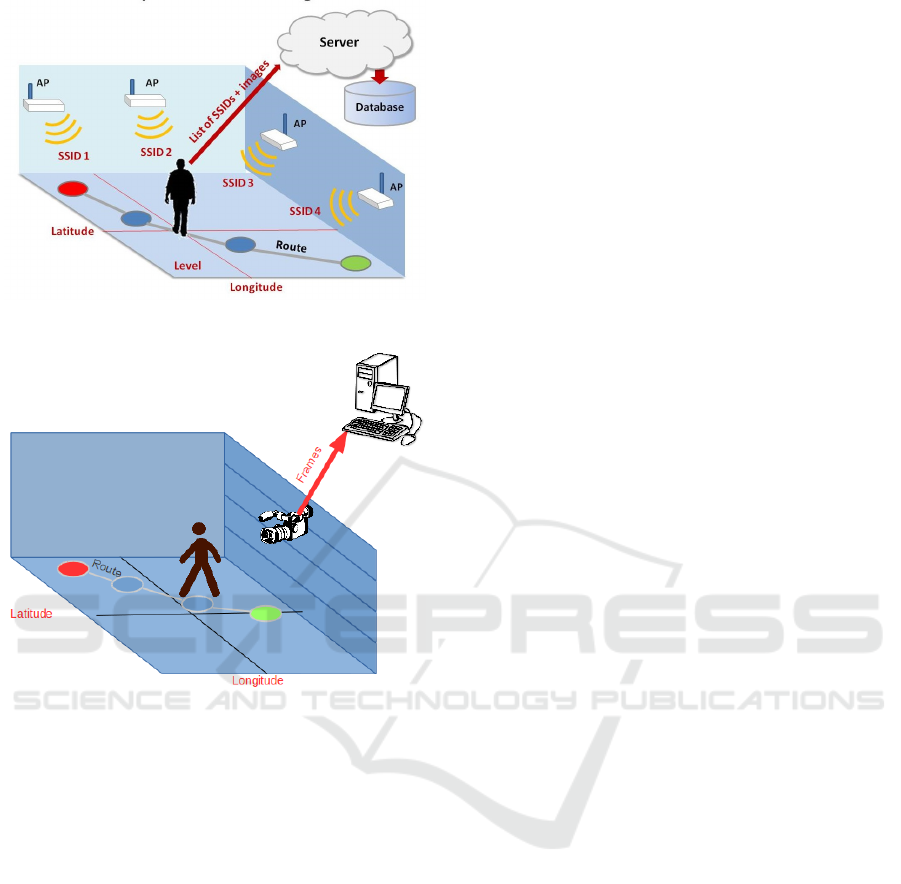
(a) Wireless signals method
(b) Computer vision method
Figure 2: Device positioning and communication diagram.
The process of locating a device, whether it is con-
nected or not to the same network as the tracking de-
vice, is based on the basic connection handshake from
both Wi-Fi and Bluetooth, in which a valid MAC ad-
dress must be transmitted. In the first messages of the
handshake the device transmits a MAC address (al-
though as we will explain later it does not need to be
the real MAC address) in order to exchange the nec-
essary information for the connection. The power of
the signal received by the tracker can then be used to
estimate the distance between the tracker and the de-
vice.
If three or more trackers are used, then the po-
sition of the device can be calculated using trilater-
ation or triangulation position techniques. The pro-
cess for the localization can be seen in Fig. 2a, where
the persons position is approximated by four trackers
(AP). Our implementation is based on Find3 (Schollz,
2019), with some modifications to allow device filter-
ing and techniques to deal with devices performing
MAC randomization.
As the system detects any kind of wireless device
and not just mobile phones, a significant number of
false positives can appear. To reduce that number we
implemented a filter that discards all the devices out-
side the zone of interest and the ones not detected by
a minimum number of trackers. Another filter elim-
inates the devices with MAC address of brands that
do not produce mobile phone devices, based on the
list provided in the IEEE website (IEEE MAC OUI
registries, 2019).
Recent mobile operating system (from iOS 8 and
Android 10), implement a feature called MAC ran-
domization where, whenever the device is asked to
transmit the MAC address before establishing a con-
nection to the network, it will transmit a false MAC
address. This false MAC is totally random in iOS de-
vices while in Android devices it is chosen from a
known range. This feature makes it harder to track
the devices when they are not in the same network
as the tracker, and it can cause iOS devices to be fil-
tered without processing. If the device is connected
to the network the tracker knows the real MAC of the
device, and both the position and the movement are
tracked, allowing for higher accuracy in the measure-
ments.
As the position computed by using wireless sig-
nals is inherently an approximate calculation, we do
not provide the accurate position but rather the zone
in which the device is. The way the room is split into
different zones is arbitrary and is decided before run-
ning the experiments. The number of zones is also
independent from the number of trackers used, i.e. 3
trackers could be used to distinguish the position of a
device between 5 different zones.
We compute the position of the mobile devices
using an algorithm which compares the measure-
ments from each tracker with the measurement ob-
tained from known devices in the room, called refer-
ence devices. Using reference devices allows the sys-
tem to be robust to the changes in the electromagnetic
field that can happen inside the room.
3.3 Hybridization
Once the results from vision and wireless based detec-
tion systems are available, the hybridization step is re-
sponsible to process and combine both in order to ob-
tain a higher accuracy. The main idea is that the data
provided by the wireless person detection system can
represent a rough estimation of the number of people
in the scene and, comparing it with the previous result
from the vision system, it can steer the pre-processing
of the frames to improve the subsequent vision-based
detection and tracking results of the system.
ICAART 2020 - 12th International Conference on Agents and Artificial Intelligence
154
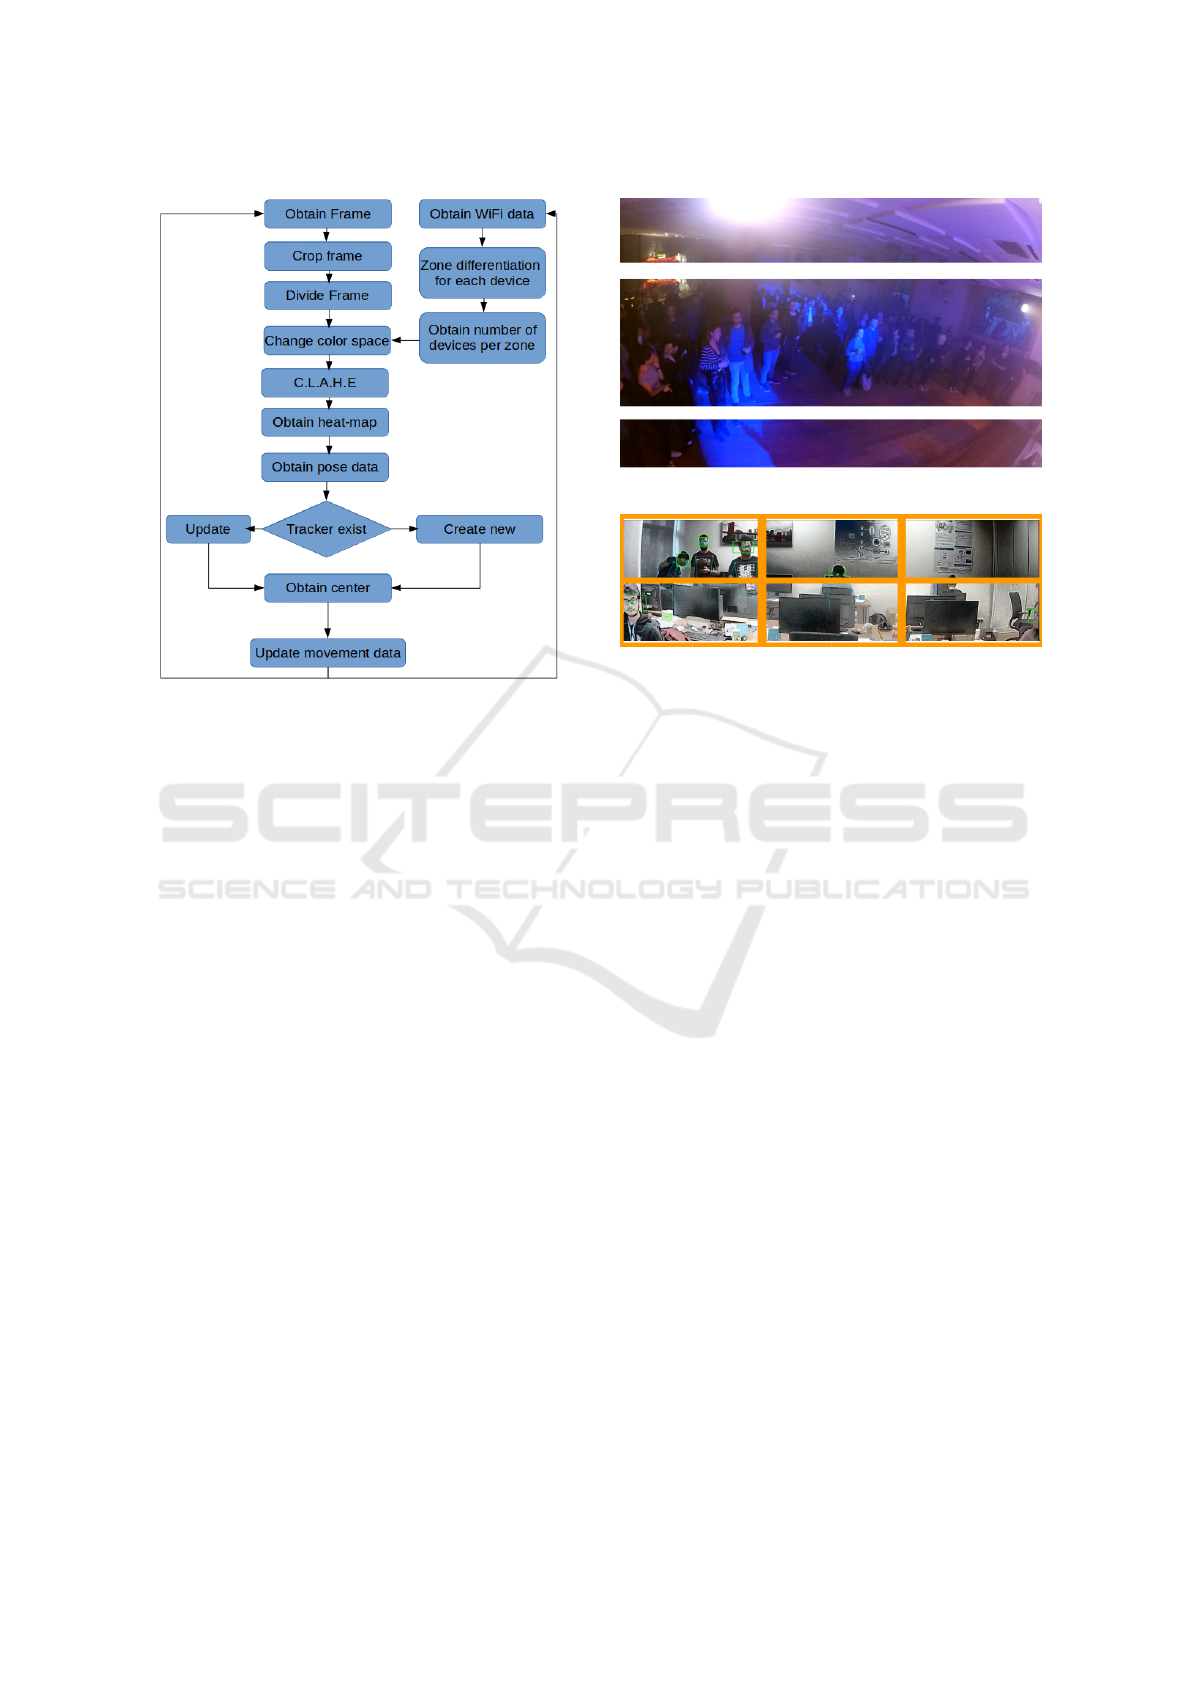
Figure 3: Workflow for the hybrid system.
Consider for example the bottom image in Fig. 1,
in this case the wireless detection system could esti-
mate that there are more than 30 people in the range of
the router, while the vision-based system only detects
3 people (due to poor illumination condition, varying
image contrast in different region of the image, etc.).
The work-flow of the hybridization is summed up in
Fig. 3.
Apart from the detection and the tracking data
from both systems, the hybridization system takes as
input a function which maps the 3D regions in which
the wireless detection splits the room and the 2D re-
gions in the camera frames where the pre-processing
will be applied.
3.3.1 Preprocessing
The aim of the pre-processing is twofold, as it should
both speed-up the detection times and modify the in-
put images with the aim of maximizing the detection
accuracy.
The preprocessing performed is composed by sev-
eral steps. First, the image is cropped to remove the
parts of the frame where no person could appear (see
Fig. 4 for an example). The cropping process is per-
formed manually, as it depends on the camera posi-
tioning, and it is a one-time operation which is then
applied to every frame of the video. This improves the
performance since there is a lower quantity of pixels
to evaluate and the neural network is able to process
more frames in a single pass. Then, the input frame
Figure 4: Elimination of non-person parts of the frame.
Figure 5: Preprocessing slicing of the frame.
is divided into different slices. Fig. 5 shows an ex-
ample where the input frame, after cropping, is split
into six parts. Each slice will be then pre-processed
separately by applying different brightness and con-
trast changes. In this way the system is able to cope
with the fact that different parts of the frame may have
different color and brightness statistics. There is a 5%
overlap between each slice (represented by the orange
lines in Fig. 5) to counter the fact that people moving
in the scene from one slice to the adjacent one may
be lost when crossing from one slice to the other. The
way the frame is split into different slices depends on
the camera position as well as on the geometry of the
regions identified by the wireless detection system.
The processing of each slice is done by applying
contrast stretching using the CLAHE transformation
(Pizer et al., 1990), followed later by Gamma correc-
tion (Richter et al., 2009) to reduce or increase the
number of bits of luminance and so dynamically in-
crease or decrease the processing power needed. The
parameters used for performing CLAHE and gamma
correction are dynamically chosen by comparing the
detection results of the wireless and vision-based sys-
tem.
3.3.2 Tracking Strategies
In order to speed-up the processing times of the vision
system, the detection step is performed once every 10
frames, while in the remaining frames people are only
tracked using MedianFlow (Kalal et al., 2010).
To avoid tracking false detections indefinitely, the
tracking is periodically reset, while correct assign-
Combining Video and Wireless Signals for Enhanced Audience Analysis
155
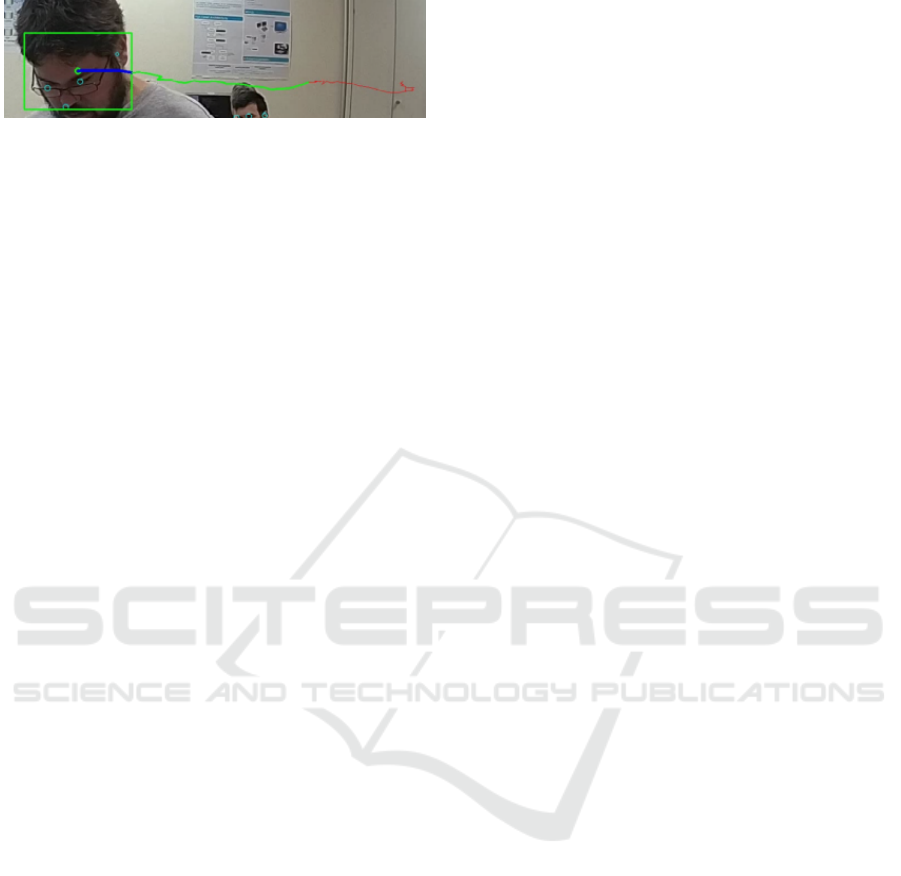
Figure 6: Tracking path drawing in the frame.
ments keep being tracked by performing a simple
nearest-neighbor assignment from previous frames.
Fig. 6 shows a visualization of the tracking of a per-
sons face: the green rectangle shows the current po-
sition of the face, while a curve shows the path fol-
lowed by the face center. The most recent positions
(the latest 20 frames) are drawn in blue, while older
positions are shown in green and, for positions older
than 50 frames, in red.
The wireless detection system does not implement
a tracking mechanism, but data from previous mea-
surement is used to increase the robustness of the de-
tection mechanisms. Previous measurements are ex-
ponentially weighted, with a higher weight associated
to more recent measures.
3.3.3 Zone Relation
The wireless method divides the room in several
zones, while the computer vision method divides the
frame in several slices. In the tests we performed, we
used three zones for the wireless system and six for
the computer vision one. Before the processing starts,
a function maps the zones from the camera to a zone
in the 3D space. The mapping is not perfect but, as
the precision of the wireless technique is in the range
of centimeters, the relation does not need to be exact.
The number of zones in the wireless method de-
pend on the accuracy needed and conditions of the
room, such as size and shape. It is possible to have a
different number of zones and trackers, as in our test-
ing where we used 2 trackers for 3 zones.
Depending on how the image is split, it may hap-
pen that if the person is very close to the camera, or
the person does not wear his device, the computer vi-
sion system detects one person in one zone while the
wireless method detects it in another. Some of that is-
sues can be avoided with a good camera positioning,
which is at a medium distance from the people and at
a height of 2.5 meters approximately. If the camera
cannot be moved, the detection difference between
the methods can be changed. This difference com-
pares the total detections between the methods and in
the case that is greater than a threshold the preprocess-
ing conditions (gamma and contrast), are changed.
4 RESULTS
We conducted fifteen tests in a controlled environ-
ment, changing the following variables:
Number of people on camera: controls the num-
ber of people that can be seen in the image retrieved
from the camera. This variable can take the values
from four to eleven in the test. It has been included to
see if the system loses precision when increasing the
number of people in the room.
Separation between the people: controls the dis-
tance between the people in the room. It is treated
as a binary variable as people could be either close
(distance is less than 30 cm) or separated (distance is
greater than 70 cm). This variable has been included
to see the impact of occlusions in the vision-based
system and to measure the reliability of the tracking
system.
Wi-Fi connection: controls if the mobile device
of the people are connected to the same network as
the scanning devices, allowing the system to know the
real MAC address of the device and to retrieve more
data from it.
Illumination: controls the state of the lights on
the room, either turned on or changing over time.
This variable has been included to see if both the
pre-processing with segmentation and the hybrid ap-
proach can reduce the effect of the change of illumi-
nation in the computer vision techniques.
Number of people moving: controls the quantity
of people moving from one zone to another. This vari-
able is expressed in percentage of the total people in
the image.
Table 1 shows the different conditions under
which the fifteen tests were ran.
In order to simplify the testing and the further
proving of results, we ran the test in offline mode,
that is we first recorded the electromagnetic environ-
ment and the room with the camera, and then later
we processed the data. The video was taken in two
modalities, a low-quality one (360p resolution, 10 fps
and 400 kbps bitrate) and a high-quality one (1080p,
10 fps and 5 Mbps) to compare security camera qua-
lity to consumer grade cameras. Each test lasted five
minutes, both for video and recording of the electro-
magnetic environment. As expected, using low qua-
lity videos the detection rate decreases, having more
false detections and less people detected. Strangely,
we noticed that double detections, person being de-
tected two times in the same frame were more prob-
able with the high quality video. This double detec-
tions happens when the system does not detect that
two detected joints are from the same person and at-
tributes them to different people, by supposing that
ICAART 2020 - 12th International Conference on Agents and Artificial Intelligence
156
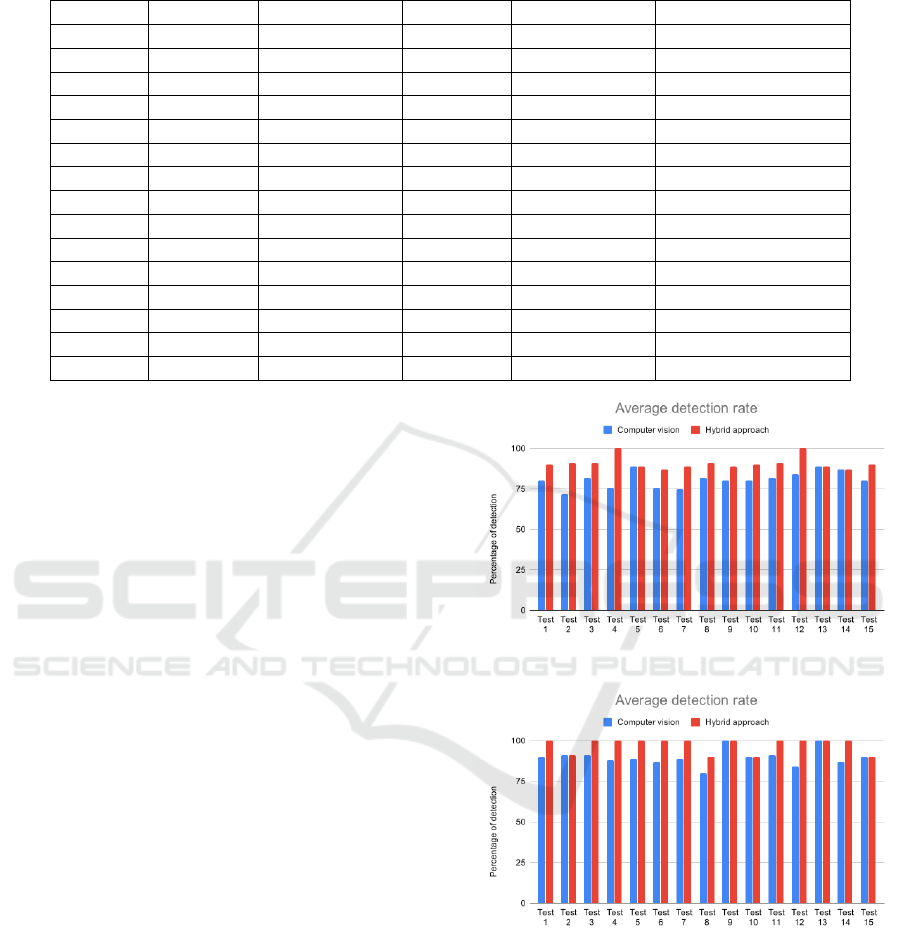
Table 1: Test variables.
Test People Separation Wi-Fi Lights People moving
1 11 30 cm 7 Turn on 3
2 11 30 cm 7 Turn on 5
3 11 30 cm 7 Changing 5
4 11 70 cm 7 Changing 3
5 6 70 cm 7 Turn on 2
6 11 30 cm X Changing 5
7 11 30 cm X Turn on 3
8 11 70 cm X Changing 3
9 6 30 cm X Changing 2
10 11 30 cm X Turn on 5
11 11 70 cm X Changing 7
12 11 70 cm X Turn on 4
13 6 70 cm X Changing 1
14 6 70 cm X Turn on 1
15 11 30 cm X Turn on 11
the rest of the person is not detected because is being
covered.
The tests measured the following:
– True positive detections: measures the number of
persons correctly detected at each frame. This
variable is related to the maximum number of peo-
ple that the system is able to track.
– Number of false detections: measures false detec-
tion at each frame. This variable will take into
account both the false negatives (missing detec-
tions) and the false positives (detecting a person
when it is not there, or detecting the same person
twice).
– Tracking: This variable takes into account the
movement of the people across different zones in
the room and their location. This variable will
measure if the system can track the movement of
a person through the time.
– Processing time: This variable analyses the aver-
age time that is necessary for the processing of a
frame in the video.
In Fig. 7 we show the average (per frame) percen-
tage of people detected on the videos in each of the
tests, while in Fig. 8 we report the average number
of false detections, both for the low and high bitrate
videos.
Fig. 7a shows that, for the low-quality video, the
hybrid approach in most cases performs better than
the vision-only system (and in two cases correctly de-
tects all the people in the scene), while in three cases it
shows the same performance. Fig. 8a shows a strong
improvement in terms of false detections across al-
most every test, and no false detections at all in one
case.
(a) Low-quality video
(b) High-quality video
Figure 7: Average person detection rate.
Similar conclusions can be drawn when analyzing
the results on the high-quality video. Fig. 7b shows
that the hybrid system improves over the vision-only
method and in 11 cases, reaching 100% detection rate.
Fig. 8b shows a similar trend: with the exceptions
of tests #4 and #15 (where one of the participants is
detected twice by the system), the false detections are
lower when using the hybrid approach.
Combining Video and Wireless Signals for Enhanced Audience Analysis
157
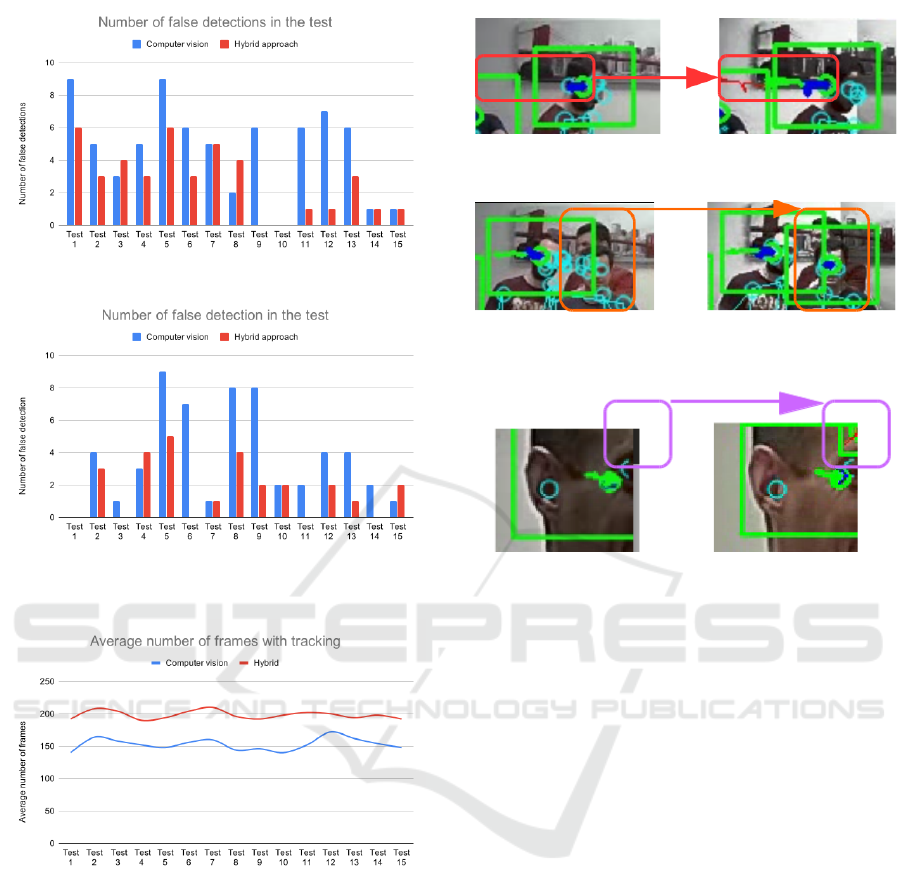
(a) Low-quality video
(b) High-quality video
Figure 8: Average false detections.
Figure 9: Average tracking length across all tests.
We measure the quality of the tracking using the
tracking length metric (
ˇ
Cehovin et al., 2016). In Fig.
9 we show the tracking length when using the hybrid
approach (red) and the vision-only based system. The
tracking length is fairly consistent across the different
tests, and the results clearly show that the hybrid ap-
proach improves over the vision-only system, with an
approximate gain of 25%.
Fig. 10 to Fig. 13 show some examples of the
difference in detection and tracking quality between
the vision-only system and the hybrid one according
to different metrics:
– Tracking performance - Fig. 10 shows that the
movement of the person is recorded for much
Figure 10: Tracking comparison between computer vision
technique (Left) and hybrid approach (Right).
Figure 11: Detection comparison between computer vision
technique (Left) and hybrid approach (Right).
Figure 12: False detection comparison between computer
vision technique (Left) and hybrid approach (Right).
longer time when using the hybrid approach.
– Number of detections - Fig. 11 shows how the
hybrid approach is able to detect more people and
how the vision-only approach may fail, by detec-
ting a group of people as a single person.
– False and double detections - Fig. 12 shows that
the double detection of the person does not take
place on the hybrid method.
– Body parts detections - Fig. 13 shows that, even if
both methods fail to detect the person, the hybrid
method is able to detect at least some body parts
We measured the difference in processing time be-
tween the hybrid system and the computer vision only
technique. The results, displayed in the table 2, show
that the hybrid approach is marginally slower than the
vision-only based method. Performance were mea-
sured on an Intel i5 PC with 16Gb of RAM and a
Nvidia 1080 GPU, taking the average over 20 runs.
Finally, we also measured the ability of the system
to determine the location of the people in the different
zones of the room. We measured the average num-
ber of people in each zone across every test video,
and compared it to the localization results when using
only the vision system, only the Wi-Fi method, or the
hybrid approach. As detailed in Table 3, the hybrid
approach is the one that matches the ground truth data
more closely.
ICAART 2020 - 12th International Conference on Agents and Artificial Intelligence
158
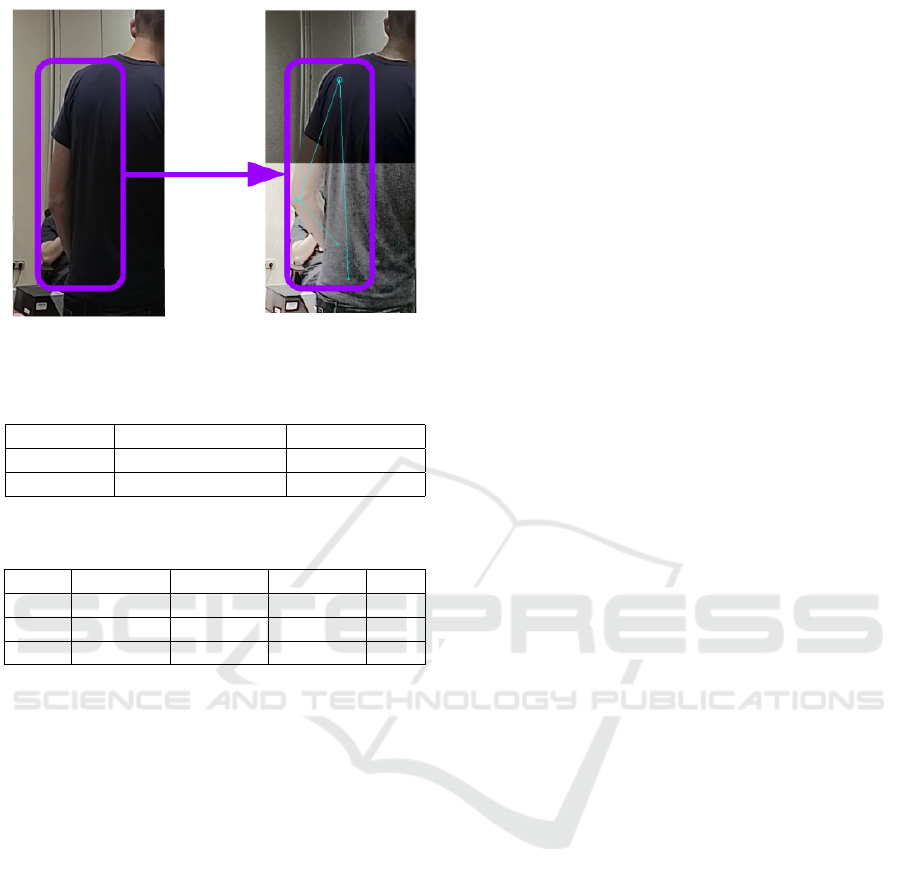
Figure 13: Body parts detection comparison between com-
puter vision technique (Left) and hybrid approach (Right).
Table 2: Average processing times over 20 runs.
Quality CV-Only (fps) Hybrid (fps)
High 2.73 2.51
Low 3.79 3.70
Table 3: Average number of people detected per zone, using
CV-only, Wi-Fi only, hybrid methods and ground truth.
Zone CV Wi-Fi Hybrid GT
1 3.2 3.6 3.7 3.9
2 0.7 1.4 1.1 1.2
3 2.8 3.3 3.2 3.2
5 CONCLUSIONS AND FUTURE
WORK
We have developed a hybrid system with better lo-
cation, detection and tracking accuracy than systems
using only computer vision or wireless techniques,
with only slightly worse performances in terms of
processing times. Such improvements are more no-
ticeable for the first experiment, conducted in a con-
trolled environment, while the second test, run in a
concert hall with many more people and harder light-
ing conditions, shows an increment in accuracy com-
pared to single modality techniques, but the system
detection results are still quite far from the ground
truth.
There is a difference also on the quantity of infor-
mation obtained by the method, as the metrics of the
hybrid method are far greater in number and giving a
higher quality information. Some of the metrics as the
number of people in the room are validated by being
detected by two different methods instead of just one.
Compared to the computer vision-only method,
our hybrid approach is able to detect people facing
backwards, and has a much lower number of false de-
tections. Thanks to the pre-processing step, the hybrid
approach guarantees longer tracking times and better
tracking quality.
The hybrid system could be improved in terms of
both performance and functionalities. Performance-
wise, gains could be obtained by switching to bet-
ter models (for the vision part) or by implementing
improved methods for localization via wireless sig-
nals, beyond the nearest-neighbor approach currently
used. Tracking could significantly improve by using
face-identification techniques which allow to resume
tracking after occlusions. This improvement in per-
formance will pursue the objective of having the ob-
jective of a real time system. Regarding functiona-
lities, one obvious improvement is to increase the
amount of information extracted, for example the sys-
tem could run emotion analysis (which correlates di-
rectly with user engagement) or action recognition.
More interestingly, new functionalities can be added
by strengthening the interaction between the vision
and wireless systems: for example, the hybrid im-
plementation could use the data from the camera to
tweak the parameters used to perform wireless loca-
lization, or to reshape the zones of interest based on
people movements.
REFERENCES
Altini, M., Brunelli, D., Farella, E., and Benini, L. (2010).
Bluetooth indoor localization with multiple neural
networks. ISWPC 2010 - IEEE 5th International
Symposium on Wireless Pervasive Computing 2010,
1(June):295–300.
Andriluka, M., Pishchulin, L., Gehler, P., and Schiele, B.
(2014). 2D human pose estimation: New benchmark
and state of the art analysis. In Proceedings of the
IEEE Computer Society Conference on Computer Vi-
sion and Pattern Recognition.
Asvadi, A., Garrote, L., Premebida, C., Peixoto, P., and J.
Nunes, U. (2018). Multimodal vehicle detection: fus-
ing 3D-LIDAR and color camera data. Pattern Recog-
nition Letters.
Bodd, B. (2018). Means, Not an End (of the World) The
Customization of News Personalization by European
News Media. SSRN Electronic Journal.
Bourdev, L. and Malik, J. (2010). Poselets: Body part detec-
tors trained using 3D human pose annotations. In 2009
IEEE 12th International Conference on Computer Vi-
sion.
Cao, Z., Hidalgo, G., Simon, T., Wei, S.-E., and Sheikh,
Y. (2018). OpenPose: realtime multi-person 2D pose
estimation using Part Affinity Fields. In arXiv preprint
arXiv:1812.08008.
ˇ
Cehovin, L., Leonardis, A., and Kristan, M. (2016). Visual
Combining Video and Wireless Signals for Enhanced Audience Analysis
159

object tracking performance measures revisited. IEEE
Transactions on Image Processing, 25(3):1261–1274.
Chang, J. Y., Moon, G., and Lee, K. M. (2018). V2V-
PoseNet: Voxel-to-Voxel Prediction Network for Ac-
curate 3D Hand and Human Pose Estimation from a
Single Depth Map. In Proceedings of the IEEE Com-
puter Society Conference on Computer Vision and
Pattern Recognition.
Dalal, N. and Triggs, B. (2005). Histograms of oriented
gradients for human detection. In Proceedings - 2005
IEEE Computer Society Conference on Computer Vi-
sion and Pattern Recognition, CVPR 2005.
Dari, Y. E., Suyoto, S. S., and Pranowo, P. P. (2018).
CAPTURE: A Mobile Based Indoor Positioning Sys-
tem using Wireless Indoor Positioning System. Inter-
national Journal of Interactive Mobile Technologies
(iJIM), 12(1):61.
Deloitte (2018). 2018 Media and Entertainment Industry
Trends — Deloitte US.
Deng, J., Dong, W., Socher, R., Li, L.-J., Li, K., and Fei-
Fei, L. (2009). Imagenet: A large-scale hierarchical
image database. In 2009 IEEE conference on com-
puter vision and pattern recognition, pages 248–255.
Ieee.
Girshick, R. (2015). Fast r-cnn. In Proceedings of the IEEE
international conference on computer vision, pages
1440–1448.
Girshick, R., Donahue, J., Darrell, T., and Malik, J. (2014).
Rich feature hierarchies for accurate object detection
and semantic segmentation. In Proceedings of the
IEEE Computer Society Conference on Computer Vi-
sion and Pattern Recognition.
Glisser webpage (2019). Glisser. https://www.glisser.com/
features/. Accessed: 2019-09-24.
Granados, N. (2018). Digital Video And Social Media Will
Drive Entertainment Industry Growth In 2019.
Gupta, P. and Kar, S. P. (2015). MUSIC and improved MU-
SIC algorithm to estimate direction of arrival. In 2015
International Conference on Communication and Sig-
nal Processing, ICCSP 2015.
Hassib, M., Schneegass, S., Eiglsperger, P., Henze, N.,
Schmidt, A., and Alt, F. (2017). EngageMeter: A sys-
tem for implicit audience engagement sensing using
electroencephalography. In Conference on Human
Factors in Computing Systems - Proceedings.
He, K., Gkioxari, G., Doll
´
ar, P., and Girshick, R. (2017).
Mask r-cnn. In Proceedings of the IEEE international
conference on computer vision, pages 2961–2969.
IEEE MAC OUI registries (2019). IEEE OUI MAC
registries. https://regauth.standards.ieee.org/
standards-ra-web/pub/view.html#registries. Ac-
cessed: 2019-09-24.
Johnson, S. and Everingham, M. (2010). Clustered pose
and nonlinear appearance models for human pose es-
timation. In Proceedings of the British Machine Vision
Conference. doi:10.5244/C.24.12.
Kalal, Z., Mikolajczyk, K., and Matas, J. (2010). Forward-
backward error: Automatic detection of tracking fail-
ures. In 2010 20th International Conference on Pat-
tern Recognition, pages 2756–2759. IEEE.
Khalil, M. and Ebner, M. (2017). Clustering patterns
of engagement in Massive Open Online Courses
(MOOCs): the use of learning analytics to reveal stu-
dent categories. Journal of Computing in Higher Ed-
ucation.
K.Nanani, G. and M V V Prasad, K. (2013). A Study of WI-
FI based System for Moving Object Detection through
the Wall. International Journal of Computer Applica-
tions, 79(7):15–18.
Lanzisera, S., Zats, D., and Pister, K. S. (2011). Radio fre-
quency time-of-flight distance measurement for low-
cost wireless sensor localization. IEEE Sensors Jour-
nal.
Lienhart, R. and Maydt, J. (2003). An extended set of Haar-
like features for rapid object detection. In Proceed-
ings. International Conference on Image Processing.
Lin, T.-Y., Maire, M., Belongie, S., Hays, J., Perona, P.,
Ramanan, D., Doll
´
ar, P., and Zitnick, C. L. (2014).
Microsoft coco: Common objects in context. In Euro-
pean conference on computer vision, pages 740–755.
Springer.
Liu, W., Anguelov, D., Erhan, D., Szegedy, C., Reed, S.,
Fu, C. Y., and Berg, A. C. (2016). SSD: Single shot
multibox detector. In Lecture Notes in Computer Sci-
ence (including subseries Lecture Notes in Artificial
Intelligence and Lecture Notes in Bioinformatics).
Malisiewicz, T., Gupta, A., and Efros, A. A. (2011). En-
semble of exemplar-SVMs for object detection and
beyond. In Proceedings of the IEEE International
Conference on Computer Vision.
Mart
´
ınez-Villase
˜
nor, L., Ponce, H., Brieva, J., Moya-Albor,
E., N
´
u
˜
nez-Mart
´
ınez, J., and Pe
˜
nafort-Asturiano, C.
(2019). Up-fall detection dataset: A multimodal ap-
proach. Sensors (Switzerland).
Meyer, K. A. (2014). Student Engagement in Online Learn-
ing: What Works and Why. ASHE Higher Education
Report.
Mitchell, J. (2014). Hollywood’s Latest Blockbuster: Big
Data and The Innovator’s Curse.
Oguejiofor, O. S., Okorogu, V. N., Adewale, A., and Os-
uesu, B. O. (2013). Outdoor Localization System
Using RSSI Measurement of Wireless Sensor Net-
work. International Journal of Innovative Technology
and Exploring Engineering.
Papandreou, G., Zhu, T., Chen, L.-C., Gidaris, S., Tompson,
J., and Murphy, K. (2018). Personlab: Person pose es-
timation and instance segmentation with a bottom-up,
part-based, geometric embedding model. In Proceed-
ings of the European Conference on Computer Vision
(ECCV), pages 269–286.
Peng, R. and Sichitiu, M. L. (2007). Angle of arrival lo-
calization for wireless sensor networks. In 2006 3rd
Annual IEEE Communications Society on Sensor and
Adhoc Communications and Networks, Secon 2006.
Pizer, S. M., Johnston, R. E., Ericksen, J. P., Yankaskas,
B. C., and Muller, K. E. (1990). Contrast-limited
adaptive histogram equalization: Speed and effective-
ness. In Proceedings of the First Conference on Visu-
alization in Biomedical Computing.
ICAART 2020 - 12th International Conference on Agents and Artificial Intelligence
160

Razavian, A. S., Azizpour, H., Sullivan, J., and Carlsson,
S. (2014). CNN features off-the-shelf: An astounding
baseline for recognition. In IEEE Computer Society
Conference on Computer Vision and Pattern Recogni-
tion Workshops.
Redmon, J., Divvala, S., Girshick, R., and Farhadi, A.
(2016). You only look once: Unified, real-time ob-
ject detection. In Proceedings of the IEEE Computer
Society Conference on Computer Vision and Pattern
Recognition.
Redmon, J. and Farhadi, A. (2018). Yolov3: An incremental
improvement. CoRR, abs/1804.02767.
Ren, S., He, K., Girshick, R., and Sun, J. (2015). Faster
r-cnn: Towards real-time object detection with region
proposal networks. In Advances in neural information
processing systems, pages 91–99.
Richter, R., Kellenberger, T., and Kaufmann, H. (2009).
Comparison of topographic correction methods. Re-
mote Sensing.
Schivinski, B., Christodoulides, G., and Dabrowski, D.
(2016). Measuring consumers’ engagement with
brand-related social-media content: Development and
validation of a scale that identifies levels of social-
media engagement with brands. Journal of Advertis-
ing Research.
Schollz, Z. (2019). High-precision indoor positioning
framework, version 3. https://github.com/schollz/
find3. Accessed: 2019-04-10.
Spinello, L., Triebel, R., and Siegwart, R. (2008). Mul-
timodal people detection and tracking in crowded
scenes. In Proceedings of the National Conference
on Artificial Intelligence.
Su, Z., Ye, M., Zhang, G., Dai, L., and Sheng, J. (2019).
Cascade Feature Aggregation for Human Pose Esti-
mation. CVPR.
Sun, K., Xiao, B., Liu, D., and Wang, J. (2019). Deep High-
Resolution Representation Learning for Human Pose
Estimation.
Wang, J. G. and Sung, E. (2002). Study on eye gaze es-
timation. IEEE Transactions on Systems, Man, and
Cybernetics, Part B: Cybernetics.
Wightman, R. (2018). posenet-pytorch.
Yiu, S., Dashti, M., Claussen, H., and Perez-Cruz, F. (2017).
Wireless RSSI fingerprinting localization.
Combining Video and Wireless Signals for Enhanced Audience Analysis
161
