
Detecting Geckler Classification from Gram Stained Smears Images for
Sputum
Kazuki Hashimoto
1
, Ryosuke Iida
1
, Kouich Hirata
1
, Kimiko Matsuoka
2
and Shigeki Yokoyama
3
1
Kyushu Institute of Technology, Kawazu 680-4, Iizuka 820-8502, Japan
2
Osaka General Medical Center, Bandaihigashi 3-1-56, Sumiyoshi, Ohsaka 558-8558, Japan
3
KD-ICONS, Ohmoriminami 4-6-15-304, Ohta, Tokyo 143-0013, Japan
yokoyama@kd-icons.co.jp
Keywords:
Geckler Classification, Gram Stained Smears Images, Sputum, Buccal Squamous Epithelial (BSE) Cells,
Leukocytes.
Abstract:
A Geckler classification is a criterion how the smear image is quality based on the number of buccal squamous
epithelial (BSE) cells and leukocytes in the Gram stained smears images per 100× field for sputum. The
Geckler classification then determines which of images is valuable to microscope testing for the Gram stained
smears images per 1, 000× field for sputum. In this paper, we develop the system to detect the Geckler
classification from Gram stained smears images per 100× field for sputum. In this system, first we detect the
regions of BSE cells and leukocytes and then construct the classifier of the BSE cells and leukocytes by SVM
and DNN. Then, we detect the Geckler class of every test image by detecting the candidate regions and by
applying the classifier.
1 INTRODUCTION
The Gram stain (Bartholomew and Mittwer, 1952) is
the method for microbial smears test in microscope
test per 1, 000× field, introduced by Hans Christian
Gram (1853–1938) at 1884. For the Gram stain, we
detect bacteria occurring in the smears for the sam-
ples of blood, sputum, feces, pus and urine based on
the stained colors as purple/violet or red/pink and the
stained shapes as sphere-shape, rod-shape, singles,
pairs, chains, clusters, and so on.
In particular, for the sample of sputum, in order
to provide a criterion how the Gram stained smears
image per 1, 000× field is quality for the microscope
testing, a Geckler classification has been introduced
by Geckler et al. (Geckler et al., 1977) and devel-
oped by Wong et al. (Wong et al., 1982). The Geck-
ler classification is defined by the number of buccal
squamous epithelial (BSE) cells and leukocytes for the
Gram stained smears images per 100× field. Table 1
illustrates the definition of the six classes in the Geck-
ler classification (Geckler et al., 1977; Mitsuda, 2004;
Wong et al., 1982), which we call Geckler classes. In
the Geckler classification, the Geckler classes 4 and 5
are valuable for microscope testing.
In this paper, we sometimes denote the Geckler
Table 1: The Geckler classification.
class BSE cells leukocytes quality
1 > 25 < 10 no good NG
2 > 25 10 − 25 no good
3 > 25 > 25 no good
4 10 − 25 > 25 good GE
5 < 10 > 25 excellent
6 < 25 < 25 unknown UN
classes from 1 to 3 by NG (no good), those of 4 and
5 by GE (good and excellent) and that of 6 by UN
(unknown). By using these general Geckler classes,
we say that the quality of the Geckler classification
is NG if the number of BSE cells is greater than 25,
GE if the number of BSE cells is less than 25 and
the number of leukocytes is greater than 25 and UN if
both the numbers of BSE cells and leukocytes are less
than 25.
In our laboratory, we are developing the detecting
systems of Gram types for bacteria from Gram stained
smears images per 1, 000× field (Iida et al., 2020). On
the other hand, the Geckler classification is based on
the Gram stained smears images per 100× field. Note
that the relationship of shapes between leukocytes and
Hashimoto, K., Iida, R., Hirata, K., Matsuoka, K. and Yokoyama, S.
Detecting Geckler Classification from Gram Stained Smears Images for Sputum.
DOI: 10.5220/0008962304690476
In Proceedings of the 9th International Conference on Pattern Recognition Applications and Methods (ICPRAM 2020), pages 469-476
ISBN: 978-989-758-397-1; ISSN: 2184-4313
Copyright
c
2022 by SCITEPRESS – Science and Technology Publications, Lda. All rights reserved
469

bacteria in the images per 1,000× field is similar
as the relationship of shapes between BSE cells and
leukocytes in the images per 100× field for sputum.
Based on this observation, in this paper, we extend
the method to detect Gram types from the images per
1, 000× field to the method to detect the Geckler clas-
sification from the images per 100× field for sputum.
In this paper, we first detect the regions of BSE
cells and leukocytes in the images for sputum per
100× field like as those of bacteria and leukocytes
for images per 1, 000× field (Iida et al., 2020). Then,
after constructing training data for the Geckler clas-
sification, that is, assigning to the labels to BSE cells
and leukocytes, we detect the Geckler class from a
given image by using the machine learning of SVM
(support vector machine) and DNN (deep neural net-
work).
1.1 Related Works
Note that the method to detect bacteria or Gram types
from the Gram stained smear images per 1, 000× field
have developed by several researchers (Lejon and An-
dersson, 2016; Smith et al., 2018). However, their
works have dealt with images for the sample of blood,
not sputum.
On the other hand, as related works to this paper,
Carvajal et al. (Carvajal et al., 2014) have developed
the system to learn the candidate images from training
data, consisting of fixed size (51 × 38 pixels) images,
applicable to the microscope test with high magnifica-
tion. Here, the training data are assigned to 4 labels,
that is, (1) the candidate areas for high magnifica-
tion, (2) those but pathologists observed no bacteria,
(3) the dense and dark area difficult to diagnosis and
(4) background areas or areas with non-bacterial sub-
stances. They have also dealt with the Gram stained
smear images for the sample of blood, not sputum,
per 64× field.
Crossman et al. (Crossman et al., 2015) have de-
veloped the method to detect the regions of BSE cells
and leukocytes by using multiple covariance approach
with Kernel SVM from manually cropped images of
BSE cells, leukocytes and other negative data for the
Gram stained smears images par 65× field. Since the
shape and the size of BSE cells have wide variety in
the Gram stained smear images for the sample of spu-
tum, in order to achieve the Geckler classification by
using their work, it is necessary to start to detect the
regions of BSE cells carefully.
Then, in this paper, we first detect the candi-
date regions of BSE cells and leukocytes from Gram
stained smear images for the sample of sputum, by
using the similar method of (Iida et al., 2020) appli-
cable to wide variety of the shape and the size of BSE
cells. Then, after constructing the positive and nega-
tive data of BSE cells and leukocytes, we detect the
Geckler class for every image.
2 DETECTING GECKLER
CLASSIFICATION
In this paper, we use Gram stained smears images per
100× field for sputum, provided from Osaka General
Medical Center. Table 2 represents the number of im-
ages to construct training data (which we call training
images) and to test the classifier for the Geckler clas-
sification (which we call test images) for every Geck-
ler class.
Table 2: The number of training images and test images for
every Geckler class.
Geckler class 1 2 3 4 5 6 total
training images 19 20 20 19 19 10 107
test images 20 14 28 18 16 11 118
2.1 Detecting Candidate Regions
In order to detect the regions of BSE cells and leuko-
cytes from training images, we use the similar method
as (Iida et al., 2020). First, as image processing, we
apply the following processes to every training image:
1. Grayscale by the NTSC (nonsubsampled con-
toulet transform) coefficient method (Keahler and
Bradski, 2013) under the following formula from
the RGB values for every pixel:
Y = 0.298912R + 0.586611G + 0.114478B.
2. Binarization under the adaptive threshold-
ing (Keahler and Bradski, 2013) with the size N
of neighbor and the subtractive constant C.
3. Opening processing (Keahler and Bradski, 2013)
at P times as applying the dilations after applying
the erotions.
4. Edge detection by the Canny filter (Canny, 1986).
5. Detecting candidate regions of BSE cells and
leukocytes within the ranges [S
min
, S
max
] of areas,
[A
min
, A
max
] of aspect ratio and [C
min
,C
max
] of cir-
cularity.
Note that the processes of the binarization and the
opening processing are essential to detect wide vari-
ety of the shape and the size of BSE cells, because
the opening processing complements to capture the
regions not to capture the binarization.
ICPRAM 2020 - 9th International Conference on Pattern Recognition Applications and Methods
470

Table 3 represents the above parameters adopted
in this paper for image processing. Here, the rows of
blood, sputum, faces, pus and urine denote the param-
eters to process images per 1, 000× field adopted by
(Iida et al., 2020).
Table 3: The parameters for image processing.
N C P S
min
S
max
BSE cells 4,911 7 3 2,500 75,000
leukocytes 301 44 3 150 1,000
blood 257 37 2 200 30,000
sputum 431 37 2 130 30,000
feces 281 18 2 300 30,000
pus 301 38 2 150 15,000
urine 581 35 2 200 50,000
A
min
A
max
C
min
C
max
BSE cells 1.0 100 0.05 1
leukocytes 1.0 3 0.05 1
blood 0.1 1 0.1 1
sputum 0.1 1 0.1 1
feces 0.1 1 0.1 1
pus 0.1 1 0.1 1
urine 0.1 1 0.1 1
Table 3 shows that the parameters for BSE cells
and leukocytes are different from those for others. In
particular, the parameters of N, S
min
, S
max
and A
max
for BSE cells are much greater than those for others.
This is because the size of BSE cells is much greater
than the size of leukocytes per 100× field and the cor-
responding size to the BSE cells, that is, the size of
leukocytes, in the images per 1, 000× field is much
greater than the size of bacteria.
2.2 Training Data
For training images, the medical technologist (the
fourth author) has assigned every candidate region to
the label of a BSE cell, a leukocyte or others.
As a result, Table 4 represents the number of re-
gions of BSE cells and leukocytes as positive data
and others as negative data. Here, the candidate re-
gion of BSE cells (resp., leukocytes) but not labeled
by BSE cells (resp., leukocytes) are negative data for
BSE cells (resp., leukocytes).
We call all the positive and negative data for BSE
cells and leukocytes represented in Table 4 train-
ing data. Then, by applying SVM and DNN to the
training data, we construct the classifier of Geckler
classes. Here, we adopt SVM as the library pro-
vided from OpenCV (Keahler and Bradski, 2013)
whose kernel is CHI2 (Li et al., 2010). Also we
Table 4: The number of regions of BSE cells and leukocytes
as positive data (pos.) and others as negative data (neg.).
pos. neg.
BSE cells 2,624 2,952
leukocytes 10,222 16,009
adopt DNN as Caffe (convolutional architecture for
fast feature embedding) based on the rayer structure
of AlexNet (Krizhevsky et al., 2017).
3 EXPERIMENTAL RESULTS
In this section, we give experimental results for de-
tecting a Geckler class.
3.1 Detecting Geckler Class
First of all, Table 5 represents the number of detected
regions of BSE cells and leukocytes in test images.
Table 5: The number of detected regions of BSE cells and
leukocytes in test images.
BSE cell leukocyte
5,337 21,877
From the regions in Table 5, Table 6 represents the
average running time (msec) to learn whether or not
the detected region in test images is the region of the
BSE cells and leukocytes by SVM and DNN.
Table 6: The average running time (msec) to learn whether
or not the detected region in test images is the region of the
BSE cells and leukocytes by SVM and DNN.
BSE cell leukocyte
SVM 0.10 0.38
DNN 221.61 223.69
Table 7 represents the results of the detected
Geckler class by applying the classifiers constructed
by SVM and DNN from the training images with the
correct Geckler class to the test images.
Table 8 represents the results in Table 7 summa-
rizing the Geckler classes from 1 to 3 as NG, those of
4 and 5 as GE and that of 6 as UN.
Tables 7 and 8 show that the classifier constructed
by SVM does not achieve the correct Geckler class,
because it cannot detect BSE cells well, whereas it
Detecting Geckler Classification from Gram Stained Smears Images for Sputum
471
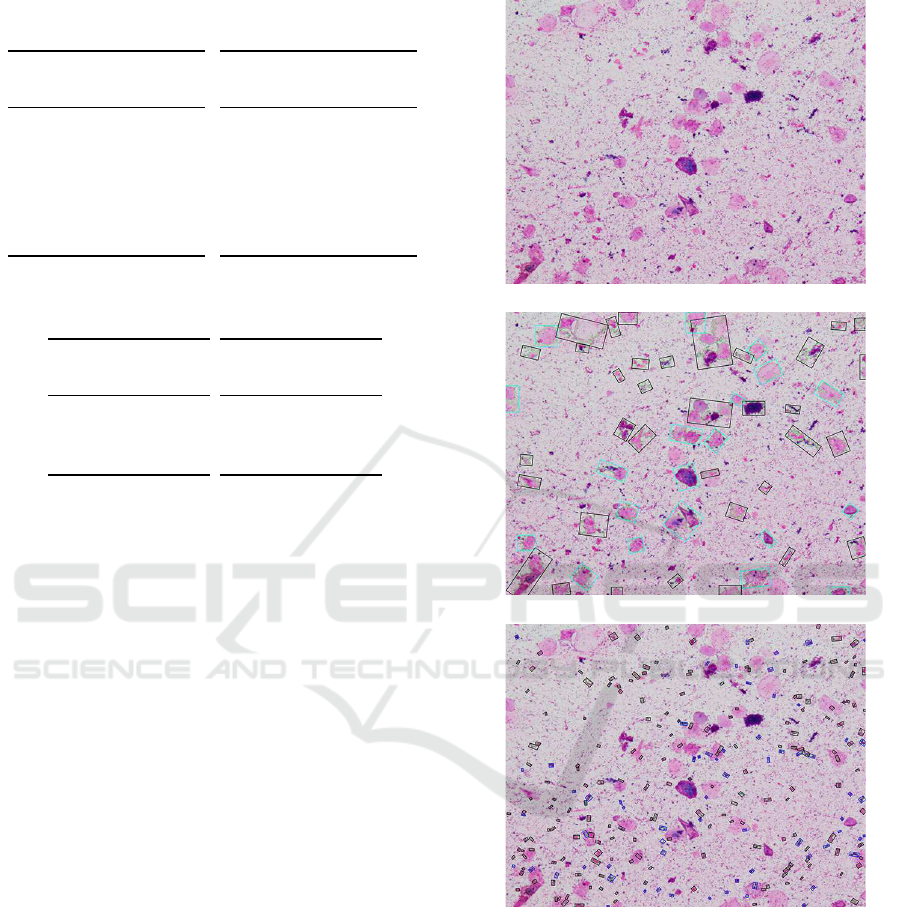
Table 7: The result of the detected Geckler class from the
test images by classifiers constructed by SVM and DNN
from the training images.
SVM correct
detect 1 2 3 4 5 6
1 0 0 0 0 0 0
2 1 0 0 0 0 0
3 0 0 0 0 0 0
4 1 2 0 0 0 0
5 3 15 19 20 16 0
6 15 3 0 0 3 20
DNN correct
detect 1 2 3 4 5 6
1 9 0 0 0 0 0
2 10 10 2 0 0 0
3 1 8 14 1 0 0
4 0 0 1 8 2 0
5 0 0 0 0 12 0
6 0 2 2 11 5 20
Table 8: The results in Table 7 summarizing the Geckler
classes.
SVM correct
detect NG GE UN
NG 1 0 0
GE 37 36 0
UN 18 3 20
DNN correct
detect NG GE UN
NG 54 1 0
GE 1 22 0
UN 4 16 20
can detect leukocytes. On the other hand, the classi-
fier constructed by DNN succeed to detect the correct
Geckler class.
In the remainder of this section, we focus on the
Gram stained smears images per 100× field for spu-
tum that (1) the correct Geckler class is 3 (NG) but
the detected one is 4 (GE) and (2) the correct Geckler
class is 4 (GE) but the detected one is 3 (NG), that are
depicted by bold faces in Tables 7 and 8.
Figure 1 illustrates the Gram stained smears im-
age that (1) the correct Geckler class is 3 (NG) but
the detected one is 4 (GE) and the results of detecting
BSE cells and leukocytes.
Figure 2 illustrates the Gram stained smears image
that (2) the correct Geckler class is 4 (GE) but the
detected one is 3 (NG) and the results of detecting
BSE cells and leukocytes.
Figure 3 illustrates the Gram stained smears image
that (3) both the correct Geckler class and the detected
one is 3 (NG) and the results of detecting BSE cells
and leukocytes.
Figure 4 illustrates the Gram stained smears image
that (4) both the correct Geckler class and the detected
one is 4 (GE) and the results of detecting BSE cells
and leukocytes.
Here, for the result of detecting BSE cells, the
rectangle enclosed by blue line is the region of BSE
cells and that by block line is not in the candidate re-
gions. Also, for the result of detecting leukocytes, the
rectangle enclosed by blue line is the region of leuko-
cytes and that by block line is not in the candidate
The Gram stained smears image
The result of detecting BSE cells
The result of detecting leukocytes
Figure 1: The Gram stained smears image (1) whose correct
Geckler class is 3 (NG) and detected one is 4 (GE) and the
result of detecting BSE cells and leukocytes.
regions.
Table 9 represents the correct Geckler class (CG)
and the number of BSE cells (#BSE), the number of
leukocytes (#leu) and the detected Geckler class (DG)
by DNN and additionally SVM for the images (1), (2),
(3) and (4).
Table 9 shows that the classifier constructed by
SVM tends to classify the candidate regions that are
BSE cells to the regions that are not BSE cells and
ICPRAM 2020 - 9th International Conference on Pattern Recognition Applications and Methods
472
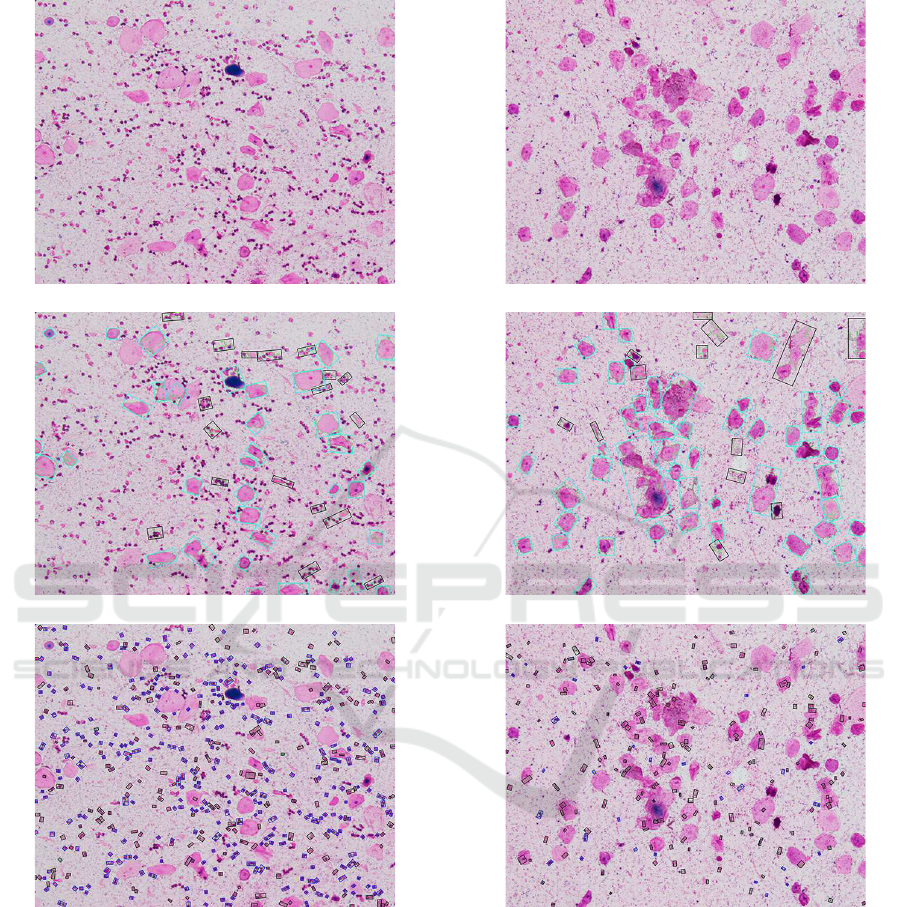
The Gram stained smears image
The result of detecting BSE cells
The result of detecting leukocytes
Figure 2: The Gram stained smears image (2) whose correct
Geckler class is 4 (GE) and detected one is 3 (NG) and the
result of detecting BSE cells and leukocytes.
the candidate regions that are not leukocytes to the
regions that are leukocytes.
3.2 Evaluation of Training Images
As shown in Table 9, the test images have just the
label of the correct Geckler class and do not have
the number of BSE cells and leukocytes. Then, in
this section, by applying the training images (with
The Gram stained smears image
The result of detecting BSE cells
The result of detecting leukocytes
Figure 3: The Gram stained smears image (3) whose correct
Geckler class and detected one is 3 (NG) and the result of
detecting BSE cells and leukocytes.
both the correct Geckler class and the number of BSE
cells and leukocytes) as test images, we evaluate the
method to detect the Geckler class.
First of all, the Geckler class in the provided train-
ing images contains some errors, because both the
numbers of BSE cells and leukocytes are counted vi-
sually, not automatically. Then, Table 10 represents
the number of training images (the first row, which is
same as that in Table 2) and training images whose
Detecting Geckler Classification from Gram Stained Smears Images for Sputum
473

The Gram stained smears image
The result of detecting BSE cells
The result of detecting leukocytes
Figure 4: The Gram stained smears image (4) whose correct
Geckler class and detected one is 4 (GE) and the result of
detecting BSE cells and leukocytes.
Geckler class is relabeled by counting the number of
assigned labels of BSE cells and leukocytes in Sec-
tion 2.2 (which we call relabeled images) for every
Geckler class.
In the remainder of this section, we regard the
label of the relabeled images as the correct Geckler
class. Then, Table 11 represents the result of the
detected Geckler class by classifiers constructed by
SVM and DNN from the same training data in Sec-
tion 2.2.
Table 9: The correct Geckler class (CG) and the number
of BSE cells (#BSE), the number of leukocytes (#leu) and
the detected Geckler class (DG) by DNN and SVM for the
images (1), (2), (3) and (4).
DNN SVM
CG #BSE #leu DG #BSE #leu DG
(1) 3 20 67 4 1 79 5
(2) 4 36 295 3 2 368 5
(3) 3 51 33 3 0 60 5
(4) 4 25 305 4 2 404 5
Table 10: The number of training images and relabeled im-
ages for every Geckler class.
Geckler class 1 2 3 4 5 6 total
training images 19 20 20 19 19 10 107
relabeled images 20 14 28 18 16 11 107
Also Table 12 represents the results in Table 11
summarizing the Geckler classes from 1 to 3 as NG,
those of 4 and 5 as GE and that of 6 as UN.
As same as Section 3.1, Tables 11 and 12 show
that, whereas SVM fails to detect the Geckler class,
DNN succeeds to detect.
In order to evaluate the method to detect the Geck-
ler class, we compare the number of BSE cells and
leukocytes presented by bold faces in Tables 11 and
12. In other words, we investigate the number of BSE
cells and leukocytes as follows:
(1) 1 image such that the correct Geckler class is 2
but the detected one is 4;
(2) 8 images such that the correct Geckler class is 3
but the detected one is 4;
(3) 2 images such that the correct Geckler class is 1
but the detected one is 6.
(4) 1 image such that the correct Geckler class is 3
but the detected one is 6.
Table 11: The result of the detected Geckler class by classi-
fiers constructed by SVM and DNN from the same training
data as Section 2.2.
SVM correct
detect 1 2 3 4 5 6
1 1 0 0 0 0 0
2 3 0 0 0 0 0
3 0 0 0 0 0 0
4 1 1 5 0 0 0
5 4 11 23 18 14 1
6 11 2 0 0 2 10
DNN correct
detect 1 2 3 4 5 6
1 10 2 1 0 0 0
2 5 3 2 0 0 0
3 3 8 16 0 0 0
4 0 1 8 11 0 0
5 0 0 0 6 13 0
6 2 0 1 1 3 11
ICPRAM 2020 - 9th International Conference on Pattern Recognition Applications and Methods
474

Table 12: The results in Table 11 summarizing the Geckler
classes.
SVM correct
detect NG GE UN
NG 4 0 0
GE 45 32 1
UN 13 2 10
DNN correct
detect NG GE UN
NG 50 0 0
GE 9 30 0
UN 3 4 10
(5) 1 image such that the correct Geckler class is 4
but the detected one is 6.
(6) 3 images such that the correct Geckler class is 5
but the detected one is 6.
Then, Table 13 represents the number of BSE cells
(#BSE), the number of leukocytes (#leu), the correct
Geckler class (CG) and the detected Geckler class
(DG) for the above images from (1) to (6) and for
detecting by DNN.
Table 13: The number of BSE cells (#BES), the number of
leukocytes (#leu), the correct Geckler class (CG) and the
detected Geckler class (DG) for the above images from (1)
to (6) and for detecting by DNN.
correct DNN
#BSE #leu CG #BSE #leu DG
(1) 43 11 2 17 40 4
(2) 41 32 3 23 39 4
44 108 3 25 72 4
34 212 3 17 184 4
50 582 3 21 512 4
49 339 3 22 333 4
32 122 3 20 138 4
27 347 3 25 387 4
38 351 3 23 311 4
(3) 38 0 1 25 16 6
56 8 1 18 24 6
(4) 45 26 3 19 18 6
(5) 14 32 4 5 22 6
(6) 0 53 5 0 13 6
1 54 5 1 0 6
1 91 5 1 1 6
Table 13 shows that DNN detects the smaller num-
ber of BSE cells than the correct number for the cases
(2) and (3), the larger number of leukocytes for the
case (3) and the smaller number of leukocytes than
the correct number for the cases from (4) to (6).
4 CONCLUSION
In this paper, we have developed the system to detect
the Geckler classification from Gram stained smears
images for sputum. Then, we have given the experi-
mental results to succeed to the Geckler classification
for sputum by using DNN, whereas not to succeed by
using SVM.
Concerned with Section 3.2, it is necessary to col-
lect more training data and then evaluate our method
by using cross validation, for example, which is a fu-
ture work. Also it is a future work to improve the
detection method with higher accuracy to avoid to the
situation represented by Table 13, for example, intro-
ducing a proper method to detect BSE cells and leuko-
cytes. Furthermore, it is a future work to apply the im-
age processing methods proposed by (Lejon and An-
dersson, 2016) and then to analyze which of them is
useful of our system.
The Geckler classification in Table 1 cannot deter-
mine the class when the number of BSE cells is just
25 and the number of leukocytes is less than or equal
to 25. Since the Geckler classification is based on vi-
sual observation, it may not require the exact number
of BSE cells and leukocytes. On the other hand, when
we develop the detection system for Geckler classifi-
cation, it is necessary to determine the class for every
case. Then, it is a future work to redefine the Geck-
ler classification without ambiguity from the medical
viewpoint.
As discussed in (Carvajal et al., 2014), the ratio
of the occurrences of BSE cells and leukocytes de-
termines whether or not the images for not only spu-
tum but also other samples is quality for the micro-
scope testing of the Gram stained smears images per
1, 000× field. Hence, it is an important future work
from the microbial viewpoint to provide the criterion
for other samples to determine how the Gram stained
smear image is quality for the microscope testing per
1, 000× field.
ACKNOWLEDGMENTS
This work is partially supported by Grant-in-Aid
for Scientific Research 17H00762, 16H02870 and
16H01743 from the Ministry of Education, Cul-
ture, Sports, Science and Technology, Japan and the
next generation innovation project 2020 from Tokyo
Metropolitan Small and Medium Enterprise Support
Center.
Detecting Geckler Classification from Gram Stained Smears Images for Sputum
475

REFERENCES
Bartholomew, J. and Mittwer, T. (1952). The Gram stain.
Bacteriol. Rev., 16:1–29.
Canny, J. (1986). A computional approach to edge detec-
tion. IEEE Trans. Patt. Anal. Mach. Intel., 8:679–698.
Carvajal, J., Smith, D., Zhao, K., Wiliem, A., Finucane, P.,
Hobson, P., Jennings, A., McDougall, R., and Lovell,
B. (2014). An early experience toward developing
computer aided diagnosis for Gram-stained smear im-
ages. In Proc. CVPR’14, pages 62–28.
Crossman, M., Wiliem, A., Jennings, J., and Lovell,
B. (2015). A multiple covariance approach for
cell detection of Gram-stained smears images. In
Proc. ICASSP’15, pages 932–936.
Geckler, R., Gremillon, D., McAllister, C., and Ellenbogen,
C. (1977). Microscopic and bacteriological compari-
son of paired sputa and transtracheal aspirates. J. Clin.
Microbio., 6:396–399.
Iida, R., Hashimoto, K., Hirata, K., Matsuoka, K., and
Yokoyama, S. (2020). Detection system of Gram
types for bacteria from Gram stained smears images.
In Proc. ICPRAM’20 (to appear).
Keahler, A. and Bradski, G. (2013). Learning OpenCV:
Computer vision in C++ with the OpenCV library.
O’Reilly Media.
Krizhevsky, A., Sutskever, I., and Hinton, G. (2017). Im-
ageNet classification with deep convolutional neural
network. Comm. ACM, 60:84–90.
Lejon, S. and Andersson, E. (2016). Semi-automatic
segmentation, detection and classification of Gram
stained bacteria in blood sample. Master Thesis,
Lund University.
Li, F., Carreira, J., and Sminchisescu, C. (2010). Object
recognition as ranking holistic figure-ground hypothe-
ses. In Proc. CVPR’10, pages 1712–1719.
Mitsuda, T. (2004). Foundations of clinical microbial test-
ing for medical care of infectious diseases and infec-
tion control (in Japanese). International Medical Pub-
lisher.
Smith, K., Kang, A., and Kirby, J. (2018). Automated in-
terpretation of blood culture Gram stains by use of a
deep convolutional neural network. J. Clin. Microbio.,
56:e01521–17.
Wong, L., Barry, A., and Horgan, S. (1982). Comparison
of six different criteria for judging the acceptability of
sputum specimens. J. Clin. Microbio., 16:627–631.
ICPRAM 2020 - 9th International Conference on Pattern Recognition Applications and Methods
476
