
Applying Machine Learning on Patient-Reported Data to Model the
Selection of Appropriate Treatments for Low Back Pain: A Pilot
Study
Wendy Oude Nijeweme – d’Hollosy
1,2 a
, Lex van Velsen
2 b
, Mannes Poel
3 c
,
Catharina G. M. Groothuis-Oudshoorn
4 e
, Remko Soer
5,6 f
, Patrick Stegeman
5 g
and Hermie Hermens
2 h
1
University of Twente, EEMC/Biomedical Signals & Systems, Techmed, Personalised eHealth Technology, The Netherlands
2
Roessingh Research and Development, eHealth Cluster, Enschede, The Netherlands
3
University of Twente, EEMC/Data Science, The Netherlands
4
University of Twente, BMS/Health Technology and Services Research, Enschede, The Netherlands
5
University of Groningen, University Medical Center Groningen, Spine Center, Groningen, The Netherlands
6
Saxion University of Applied Science, Enschede, The Netherlands
Keywords: Classification Algorithms, Clinical Decision Support Systems, Low Back Pain, Machine Learning.
Abstract: The objective of this pilot study was to determine whether machine learning can be applied on patient-reported
data to model decision-making on treatments for low back pain (LBP). We used a database of a university
spine centre containing patient-reported data from 1546 patients with LBP. From this dataset, a training
dataset with 354 features (input data) was labelled on treatments (output data) received by these patients. For
this pilot study, we focused on two treatments: pain rehabilitation and surgery. Classification algorithms in
WEKA were trained, and the resulting models were validated during 10-fold cross validation. Next to this, a
test dataset was constructed - containing 50 cases judged on treatments by 4 master physician assistants
(MPAs) - to test the models with data not used for training. We used prediction accuracy and average area
under curve (AUC) as performance measures. The interrater agreement among the 4 MPAs was substantial
(Fleiss Kappa 0.67). The AUC values indicated small to medium (machine) learning effects, meaning that
machine learning on patient-reported data to model decision-making processes on treatments for LBP seems
possible. However, model performances must be improved before these models can be used in real practice.
1 INTRODUCTION
Low back pain (LBP) is experienced by about 80%
people once in their lifetime (Balagué, 2012) and
causes considerable disability in patients and
financial burden for society (Buchbinder, 2018).
Although most episodes of acute LBP fade after a
period (Simpson, 2006), about 20% of the people
with LBP develop a chronic condition (with pain
lasting for more than 3 months), of which around 11%
a
https://orcid.org/0000-0002-6279-0429
b
https://orcid.org/0000-0003-0599-8706
c
https://orcid.org/0000-0002-3813-9732
d
https://orcid.org/0000-0002-4875-5379
e
https://orcid.org/0000-0003-4154-1711
f
https://orcid.org/0000-0003-1632-2197
g
https://orcid.org/0000-0002-3065-3876
become disabled (Balagué, 2012). The prevention of
chronic LBP and disability are therefore major
societal challenges (Buchbinder, 2018).
Most patients with (chronic) LBP have non-
specific LBP (Balagué, 2012). Because the LBP in
this group of patients is very heterogeneous, it is
difficult to determine what treatment(s) suit which
patients best in a specific situation. This has led to a
substantial variation of diagnostic and therapeutic
management of patients with LBP among healthcare
d’Hollosy, W., van Velsen, L., Poel, M., Groothuis-Oudshoorn, C., Soer, R., Stegeman, P. and Hermens, H.
Applying Machine Learning on Patient-Reported Data to Model the Selection of Appropriate Treatments for Low Back Pain: A Pilot Study.
DOI: 10.5220/0008962101170124
In Proceedings of the 13th International Joint Conference on Biomedical Engineering Systems and Technologies (BIOSTEC 2020) - Volume 5: HEALTHINF, pages 117-124
ISBN: 978-989-758-398-8; ISSN: 2184-4305
Copyright
c
2022 by SCITEPRESS – Science and Technology Publications, Lda. All rights reserved
117

providers (Patel, 2016). This plethora of treatments
and contradictory advises may have negative
consequences for an optimal recovery and may lead
to passive coping style, somatization in patients and
consequently to chronic pain (Campbell, 2007). To
standardize treatments and advices to patients with
LBP, research has been focused on developing
methods for classifying patients with LBP into more
homogeneous subgroups based on patho-anatomical,
mechanical, and bio-psychosocial characteristics
(Koes, 2010)(Hill, 2011)(Widerström, 2016)(Gross,
2016).
In the Netherlands, patients with chronic LBP
can be referred to secondary or tertiary care by their
general practitioner (GP) or medical specialist,
although with mixed effects. Frequently, LBP recurs
after discharge within 1 year in about 24% to 80%
(Hoy, 2010). When LBP recurs, the patient may start
again in primary care. Therefore, communication
among both secondary and primary care practitioners
is of great importance to avoid passivity and
somatization in patients. For this, a clinical decision
support system (CDSS) that supports physicians
providers in primary care in the selection of
appropriate treatments and advises for patients with
LBP will be helpful.
CDSSs assist healthcare providers in making
clinical decisions for the benefit of their patients
(Shortliffe, 2018). Most of these clinical decisions are
used for diagnostic purposes, selection of treatments,
or improving the uptake of guideline
recommendations. The most common type of a CDSS
in routine clinical care are knowledge-based systems
(Coiera, 2003). The development of knowledge-
based systems focuses on the construction and
maintenance of a knowledge base and inference
engine. For this, knowledge is elicited from literature
and domain experts, for example by conducting
interviews. An example of a knowledge-based
approach is the Nijmegen Decision Tool for referral
of chronic LBP to be used by secondary or tertiary
spine care specialists to decide which patients with
chronic LBP should be seen by a spine surgeon or by
other non-surgical medical specialists (Hooff, 2018).
Knowledge for this system was elicited during a
three-round Delphi study with experts on LBP
treatment.
The construction and maintenance of a
knowledge base and inference engine can be very
time consuming, and therefore too expensive (Berner,
2007). Instead of using a knowledge-based approach,
a data-driven approach with the help of machine
learning technologies is increasingly more often used
in healthcare informatics (Beam, 2018). The
application of big data and machine learning in
healthcare highly benefits from the increasing amount
of available digital health data sources, especially by
the application of electronic health records (EHR) in
healthcare processes. Because of this growing
amount of available data, the use of a data-driven
approach in the design of CDSSs will facilitate the
process of building and maintaining the CDSS,
compared to a knowledge-based approach.
2 OBJECTIVES
In this paper, we describe a study that aims to
determine whether a data-driven approach can model
the decision-making process in the selection of
appropriate treatments for patients with LBP.
Questionnaires are used for patient stratification and
to measure treatment outcomes (Hill,
2011)(Chiarotto, 2016), leading to databases with
patient-reported data. The objective of this study was
to determine whether it is possible to apply machine
learning on patient-reported data only to model
decision-making on treatments for LBP.
3 METHODS
We followed steps that are generally used in data
mining processes (Shafique, 2014), i.e. data
understanding, data preparation, and modelling and
evaluation.
3.1 Data Understanding
The Groningen Spine Center (GSC) is a tertiary care
centre for comprehensive care for patients with spine
related disorders and pathology. The GSC provided a
database containing retrospective self-reported data
from 1546 patients with LBP that were collected in
the period 2008-2015. From these patients, 894
(58%) were female and 652 (42%) were male. The
mean age of these patients was 52.3 years (SD 15.1;
range 37.0-91.0 years). From these self-reported data,
we used data as reported during intake (baseline data)
and data on received treatments reported during
follow-up.
For the intake, patients had to fill in an online
biopsychosocial questionnaire. This questionnaire
consisted of descriptive questions and questions from
the following survey-instruments:
HEALTHINF 2020 - 13th International Conference on Health Informatics
118

▪ The Pain disability Index (PDI) (Tait, 1990) to
assess the degree to which the chronic pain
interfered with various daily activities;
▪ The Örebro Musculoskeletal Pain Questionnaire
(OMPQ) as screening questionnaire to identify
patients at risk for developing persistent back
pain problems and related disability (Linton,
2003);
▪ The Roland-Morris Disability Questionnaire
(RMDQ) (Davidson, 2014) was used to assess
physical disability due to LBP;
▪ The EQ-5D-3L to measure health-related quality
of life on five dimensions: mobility, explanation
and reassurance, usual activities, pain/discomfort
and anxiety /depression (Szende, 2007)
The baseline data was used for patient referral to
treatments in the GSC and contained 354 features.
Treatment referral of a patient was performed by one
of the four master physician assistants (MPAs) of the
GSC. The MPAs had a background in physical
therapy or nursing and were specifically trained in
triaging by all specialists at the spine centre. The
mean clinical experience of these MPAs was 10
years. After discharge, the patient reported, via a
follow-up form, what treatment he or she had
received.
3.1.1 Interrater Agreement Analysis
We also wanted to know the consistency of decision
making on treatment referral among the four different
MPAs as the decision on the treatment referral is
related to the treatment labels in the training dataset.
Therefore, an interrater analysis was performed
among the MPAs. We randomly selected 50 cases,
and for these cases the MPAs selected those treatment
which they found most suitable, based on the baseline
data. To keep the burden for the MPAs acceptable,
each MPA was asked to judge 25 out of the 50 cases.
Next to this, 25 of the 50 cases were judged 3 times
by three different MPAs.
As there were more than two raters per case, we
calculated Fleiss’ Kappa, which is an extension of
Cohen’s kappa for three raters or more (Fleiss, 1973).
We calculated this score per treatment and then
assessed the mean Fleiss Kappa. For interpretation,
we used the values according to Landis and Koch
(Landis, 1977): agreement with a value smaller than
0 is indicated as ‘poor‘, between 0-0.20 as ‘slight‘,
between 0.21-0.40 as ‘Fair‘, between 0.41-0.60 as
‘Moderate‘, between 0.61-0.80 as ‘substantial‘, and a
value higher than 0.81 as ‘almost perfect‘.
3.2 Data Preparation
The data in the database were used to construct a
training dataset for machine learning. The self-
reported data collected at baseline were used as input
variables (features). The reported treatments were
used as response variables which can either be
received (positive class “yes”) or not received
(negative class “no”).
As this was a study to determine whether it is
possible to apply machine learning on patient-
reported data or not, we focused on two treatments -
non-invasive and invasive – i.e. rehabilitation and
surgery. Table 1 shows the distribution of these
received treatments among the 1546 cases.
Table 1: Distribution of received treatments among the
1546 cases for rehabilitation and surgery.
Treatment received
no
yes
Rehabilitation
1143 (74%)
403 (26%)
Surgery
1407 (91%)
139 (9%)
3.2.1 Handling Missing Data
The values in the training dataset were not complete,
because 32% of the values of the input data were
missing. First, we removed the features that contained
no values in the dataset. In some cases, we could
impute the empty fields with zero. For example, when
the patient only indicated which healthcare
professionals, he/she had seen before visiting the
GSC, leading to empty values for the non-visited
professionals. We did not remove all cases with
missing values as this may lead to a bias in study
results because of the possible exclusion of a
substantial proportion of the original sample (Sterne,
2009).
3.2.2 Handling Continuous Data
Most features in the dataset were categorical. Many
classification algorithms require a discrete feature
space (Dougherty, 1995) meaning all data should be
categorical. Therefore, all non-categorical features in
the training dataset were transformed into categorical
data. For example, ages in years were binned in a
feature called “Age” representing age groups i.e. 0-
19, 20-29, 30-39, 40-49, 50-59, 60-69, 70-79, >=80.
After data preparation, 287 features remained, 67
features less than the original amount of 354 features.
Applying Machine Learning on Patient-Reported Data to Model the Selection of Appropriate Treatments for Low Back Pain: A Pilot Study
119
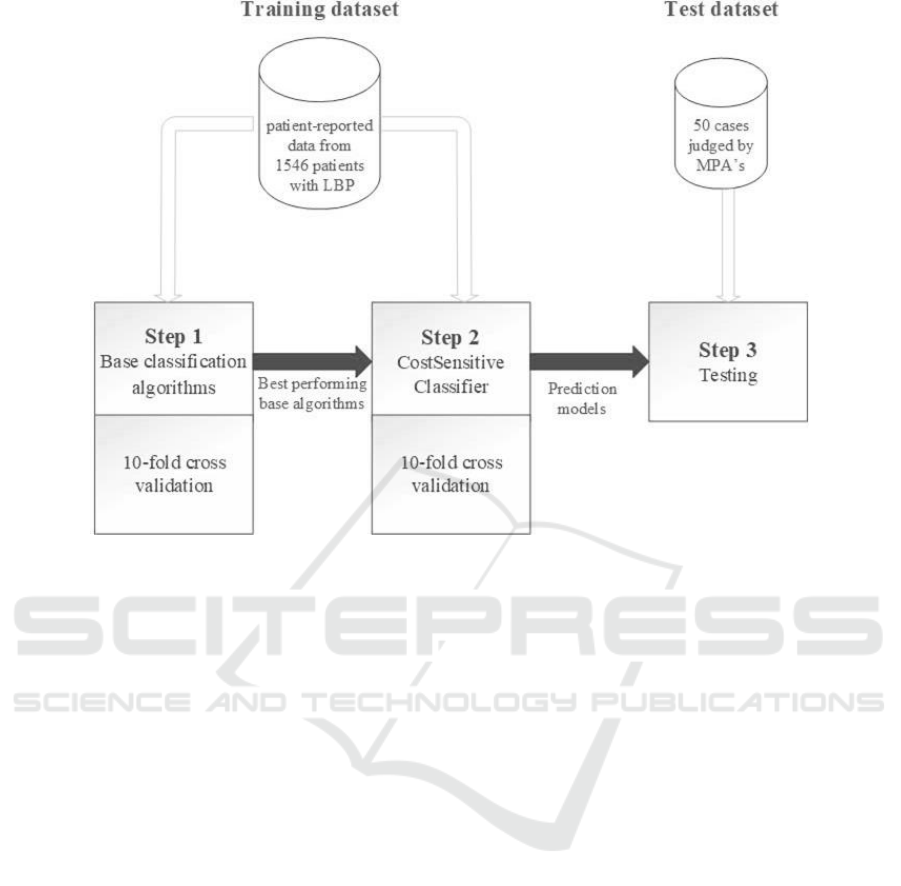
Figure 1: An overview of the different steps in the modelling and evaluation process and the datasets used for training and
testing. LBP = Low Back Pain, MPA = master physician assistant.
3.3 Modelling and Evaluation
Supervised machine learning was applied, because
the dataset consisted of cases that could be labelled
with “yes” or “no” for a treatment (Han, 2011). As
tool, we used the WEKA data mining software (Hall,
2009). WEKA contains classification algorithms that
can be grouped into base classifiers and meta
classifiers. A meta algorithm can be wrapped around
base learning algorithms to widen applicability or
enhance performance (Hall, 2009).
We performed the machine learning process in
two steps. At first, all WEKA base classification
algorithms were trained with the training dataset to
see what algorithms performed best on the data.
Subsequently, machine learning was applied again,
but with cost-sensitive learning of the WEKA meta
classification algorithm CostSensitiveClassifier. The
best performing base classification algorithms in the
first step were used as input for this meta
classification algorithm in this second step.
This second step - the cost-sensitive learning step
- was added, because the training dataset was
imbalanced. The patients that did not receive the
treatment were the over-represented group of patients
for both rehabilitation and surgery. The distribution
of the “no”/” yes” classes were 74%/26% and
91%/9% for rehabilitation and surgery respectively
(Table 1). Cost-sensitive learning can be applied
when data is highly imbalanced to reduce the number
of false-negative or false-positive errors to get better
performing models (Ling, 2011) (López, 2013).
The resulting models were validated with 10-fold
cross validation in order to assess and compare the
performances of the different classification
algorithms. After validation, the models were tested
on a test dataset consisting of the 50 cases that were
judged by the MPAs, to test the models with data not
used for training. Figure 1 shows the different steps
of the modelling and evaluation process.
Prediction accuracy and the average area under
the curve (AUC) were calculated as performance
measures. The prediction accuracies of the models
should at least be equal to the percentage of the
majority class in the dataset. The performance
measure AUC was used as it is a common
performance measure in the evaluation of machine
learning algorithms (Bradley, 1997). We used an
AUC greater than 0.55 as threshold to select the best
predicting models. An AUC between 0.55 and 0.64
indicates a small effect, an AUC between 0.64 and
0.71 a medium effect, and an AUC equal or greater
than 0.71 a large effect (Rice, 2005).
HEALTHINF 2020 - 13th International Conference on Health Informatics
120

3.4 Ethical Considerations
All patients included in this database signed informed
consent. The Medical Ethical Committee of the
University Medical Center Groningen in the
Netherlands approved the usage of data from the
database of the GSC for this study at February 11,
2016.
4 RESULTS
4.1 Interrater Agreement
The MPAs judged 50 cases on treatments and Table
2 shows the distribution of these judgments on the
rehabilitation and surgery treatments.
Table 2: Distribution of treatment among the judged 50
cases for rehabilitation and surgery.
Treatment received
no
yes
Rehabilitation
27 (54%)
23 (46%)
Surgery
48 (96%)
2 (4%)
The interrater agreement analysis showed that the
agreement among MPAs of the GSC was substantial,
with an average Fleiss Kappa of 0.67. The highest
consensus was observed for Rehabilitation, namely
0.77. The consensus on Surgery was 0.65.
4.1 Machine Learning
In WEKA, 25 different base classification algorithms
were trained to model decision making on
Rehabilitation and Surgery. The performances of the
models with an AUC > 0.55 in both, 10-fold cross
validation and testing, in step 1 are shown in Table 3.
The second part of Table 3 shows the model
performances when these algorithms where used as
input for the WEKA meta classification algorithm
CostSensitiveClassifier.
Table 3 shows that the best performing models on
decision making for treatments may differ per
treatment. The AUC values indicate small to medium
learning effects. The model accuracies approached, or
were equal, to the percentages of the majority classes
in the datasets. For the 10-fold cross validation on the
training dataset these percentages were 74%/91% for
Rehabilitation/Surgery (Table 1). For test dataset,
these percentages were 54%/96% for
Rehabilitation/Surgery (Table 2).
Table 3 also shows that cost-sensitive learning has
effect on model accuracies. For example, the 10-fold
cross validation accuracy of the BayesNet model for
Rehabilitation improves from 65% to 67%. On the
other hand, the testing accuracy of the PART model
for Rehabilitation drops from 56% to 54%.
5 DISCUSSION
In this study, we investigated the possibility of
applying machine learning on patient-reported data to
model the decision-making on the selection of
appropriate treatments for patients with LBP. As this
was a pilot study, we focused on two treatments:
Rehabilitation and Surgery. With the idea to expand
to other treatments in future studies when applying
machine learning on patient-reported data proves to
be rewarding. It may be questioned whether patient
reported data is reliable or not, but other studies show
that accuracy of self-reported data is high (Dueck,
2015)(Kool, 2017).
The interrater agreement among the MPAs of the
GCS was proven substantial, and therefore it could be
concluded that all patients were referred to treatments
in substantial the same way. This also meant that the
patient-reported treatments could be used for reliable
labelling of the training dataset used for the machine
learning.
The results showed small to medium machine
learning effects based on the AUC values of the
models. This indicated that the classification
algorithms indeed learned from the training dataset.
The model performances should be improved further
before the models can be actually used in in real
practice to support physicians in the selection of
appropriate treatments for patients with LBP. The
AUC of the model should at least be 0.72 as this will
indicate a large effect (Rice, 2005). Next to this, the
prediction accuracy of a model should preferably also
be higher than the percentage of the majority class in
the dataset to be sure that the model does not classify
all cases as majority class (López, 2013).
5.1 Future Research
In this study, we used patient-reported data. It would
be of great benefit when in future research also data
from EHRs and other data sources can be involved in
the machine learning, also called multimodal machine
Applying Machine Learning on Patient-Reported Data to Model the Selection of Appropriate Treatments for Low Back Pain: A Pilot Study
121

Table 3: Model performances on 10-fold cross validation and testing with the test dataset of the models with an
AUC > 0.55 after step 1. C.I. = confidence interval.
Step 1: Base classification algorithms AUC > 0.55
Treatment Rehabilitation
10-fold cross validation
Testing
Accuracy % (95%-CI)
AUC
Accuracy % (95%-CI)
AUC
RandomForest
0.74 (0.72 – 0.76)
0.63
0.58 (0.44 – 0.71)
0.64
PART
0.74 (0.72 – 0.76)
0.63
0.56 (0.42 – 0.69)
0.65
DecisionStump
0.74 (0.72 – 0.76)
0.56
0.54 (0.40 – 0.67)
0.59
REPTree
0.72 (0.69 – 0.74)
0.62
0.58 (0.44 – 0.71)
0.62
VotedPerceptron
0.72 (0.69 – 0.74)
0.57
0.58 (0.44 – 0.71)
0.59
NaiveBayes
0.66 (0.63 – 0.68)
0.66
0.62 (0.48 – 0.74)
0.68
BayesNet
0.65 (0.63 – 0.67)
0.67
0.60 (0.46 – 0.72)
0.64
Treatment Surgery
10-fold cross validation
Testing
Accuracy % (95%-CI)
AUC
Accuracy % (95%-CI)
AUC
DecisionStump
0.91 (0.89 – 0.92)
0.66
0.96 (0.87 – 0.99)
0.56
RandomForest
0.91 (0.89 – 0.92)
0.59
0.94 (0.84 – 0.98)
0.71
RandomTree
0.86 (0.85 – 0.88)
0.58
0.92 (0.81 – 0.97)
0.84
NaiveBayes
0.77 (0.75 – 0.79)
0.67
0.80 (0.67 – 0.89)
0.72
BayesNet
0.76 (0.74 – 0.79)
0.67
0.78 (0.68 – 0.87)
0.70
Step 2: Meta classification algorithm CostSensitiveClassifier
Treatment Rehabilitation
10-fold cross validation
Testing
Accuracy % (95%-CI)
AUC
Accuracy % (95%-CI)
AUC
PART
0.74 (0.72 – 0.76)
0.63
0.54 (0.40 – 0.67)
0.56
RandomForest
0.74 (0.72 – 0.76)
0.62
0.56 (0.42 – 0.69)
0.64
DecisionStump
0.74 (0.72 – 0.76)
0.56
0.54 (0.40 – 0.67)
0.59
VotedPerceptron
0.74 (0.72 – 0.76)
0.53
0.56 (0.42 – 0.69)
0.51
REPTree
0.73 (0.71 – 0.76)
0.62
0.54 (0.40 – 0.67)
0.57
NaiveBayes
0.68 (0.66 – 0.70)
0.66
0.62 (0.48 – 0.74)
0.68
BayesNet
0.67 (0.65 – 0.70)
0.67
0.62 (0.48 – 0.74)
0.62
Treatment Surgery
10-fold cross validation
Testing
Accuracy % (95%-CI)
AUC
Accuracy % (95%-CI)
AUC
DecisionStump
0.91 (0.89 – 0.92)
0.66
0.96 (0.87 – 0.99)
0.56
RandomForest
0.91 (0.89 – 0.92)
0.59
0.96 (0.87 – 0.99)
0.75
RandomTree
0.87 (0.85 – 0.88)
0.53
0.90 (0.79 – 0.96)
0.77
NaiveBayes
0.79 (0.77 – 0.81)
0.66
0.84 (0.71 – 0.92)
0.73
BayesNet
0.78 (0.76 – 0.80)
0.67
0.80 (0.67 – 0.89)
0.69
HEALTHINF 2020 - 13th International Conference on Health Informatics
122

learning (Baltrušaitis, 2018). For example, when also
EHR data can be used, data imbalance can be limited,
and more cases can be retrieved to increase the size
of the training dataset with data. However, at this
moment it is still a very time-consuming process to
gain data out of EHRs (Kool, 2017), although health
data integration and interoperability between healthcare
systems is a main topic in current research (Oyeyemi,
2018). When EHR data, and other data sources on
(chronic) LBP, can be integrated in the application of
machine learning, it is expected that this will improve
model performances and facilitate model
maintenance.
The dataset in this study contained 287 features as
input variables for the classification algorithms.
These features were related to all data variables a
patient could enter into the baseline questionnaire.
Future research should also focus on which features
are most predictive on the selection of a treatment and
to see if the number of features can be reduced
without dropping model performances. Or to put it
even more strongly, to see if model performances can
increase by using the most predictive features only.
For Surgery, a study already showed some features –
e.g. gender, previous surgery, treatment expectations,
body weight/body mass index – that could partly
predict whether a patient should be referred to surgery
or not (Dongen, 2017). We expect that predictive
features will differ per treatment, because this study
also showed different best performing decision
making models per treatment.
5.2 Study Limitations
The database we used contained imbalanced data.
The patients that did not receive the treatment were
the over-represented group of patients for both
Rehabilitation and Surgery. This makes it difficult to
create classification models that predict a patient
should receive a treatment. This also influenced the
currently retrieved model performances. We applied
cost-sensitive learning on the classification
algorithms that performed best on the data, because
cost-sensitive learning may help to reduce the number
of false-negative or false-positive errors to get better
performing models (Ling, 2011). This helped to
increase the performances of most models a little as
estimated during 10-fold cross validation.
6 CONCLUSIONS
It seems possible to apply machine learning to model
decision making on the selection of treatments for
LBP, where decision making models differ per
treatment. However, model performances have to be
improved further before machine learned decision
support tools can actually be used in real practice.
ACKNOWLEDGEMENTS
The authors would kindly like to thank all
participated MPAs in the study for their time, effort,
and willingness to judge 25 cases on chronic LBP.
The authors would also kindly like to thank the
Groningen Spine Center and the University Medical
Center Groningen for allowing us to use the database
of the Groningen Spine Center.
Part of this work is funded by a grant from the ERDF
project "Specialistische Zorg Thuis"; grant number
PROJ-00720.
REFERENCES
Balagué, F., Mannion, A. F., Pellisé, F., & Cedraschi, C.
(2012). Non-specific low back pain. The
lancet, 379(9814), 482-491.
Baltrušaitis, T., Ahuja, C., & Morency, L. P. (2018).
Multimodal machine learning: A survey and
taxonomy. IEEE Transactions on Pattern Analysis and
Machine Intelligence, 41(2), 423-443.
Beam, A. L., & Kohane, I. S. (2018). Big data and machine
learning in health care. Jama, 319(13), 1317-1318.
Berner, E. S. (2007). Clinical decision support
systems (Vol. 233). New York: Springer Science+
Business Media, LLC.
Bradley, A. P. (1997). The use of the area under the ROC
curve in the evaluation of machine learning
algorithms. Pattern recognition, 30(7), 1145-1159.
Buchbinder, R., van Tulder, M., Öberg, B., Costa, L. M.,
Woolf, A., Schoene, M., ... & Maher, C. G. (2018). Low
back pain: a call for action. The Lancet, 391(10137),
2384-2388.
Campbell, C., & Guy, A. (2007). Why Can't They Do
Anything for a Simple Back Problem?' A Qualitative
Examination of Expectations for Low Back Pain
Treatment and Outcome. Journal of health
psychology, 12(4), 641-652.
Chiarotto, A., Maxwell, L. J., Terwee, C. B., Wells, G. A.,
Tugwell, P., & Ostelo, R. W. (2016). Roland-Morris
Disability Questionnaire and Oswestry Disability
Index: which has better measurement properties for
measuring physical functioning in nonspecific low back
pain? Systematic review and meta-analysis. Physical
therapy, 96(10), 1620-1637.
Coiera, E. (2003). Clinical decision support systems. Guide
to health informatics, 2(1).
Applying Machine Learning on Patient-Reported Data to Model the Selection of Appropriate Treatments for Low Back Pain: A Pilot Study
123

Davidson, M. (2014). Roland-Morris disability
questionnaire. Encyclopedia of Quality of Life and
Well-Being Research, 5587-5590.
Dongen van, J. M., van Hooff, M. L., Spruit, M., de
Kleuver, M., & Ostelo, R. W. (2017). Which patient-
reported factors predict referral to spinal surgery? A
cohort study among 4987 chronic low back pain
patients. European Spine Journal, 26(11), 2782-2788.
Dougherty, J., Kohavi, R., & Sahami, M. (1995).
Supervised and unsupervised discretization of
continuous features. In Machine Learning Proceedings
1995 (pp. 194-202). Morgan Kaufmann.
Dua, S., Acharya, U. R., & Dua, P. (Eds.). (2014). Machine
learning in healthcare informatics (Vol. 56). Berlin:
Springer.
Dueck, A. C., Mendoza, T. R., Mitchell, S. A., Reeve, B.
B., Castro, K. M., Rogak, L. J., ... & Li, Y. (2015).
Validity and reliability of the US National Cancer
Institute’s patient-reported outcomes version of the
common terminology criteria for adverse events (PRO-
CTCAE). JAMA oncology, 1(8), 1051-1059.
Fleiss, J. L., & Cohen, J. (1973). The equivalence of
weighted kappa and the intraclass correlation
coefficient as measures of reliability. Educational and
psychological measurement, 33(3), 613-619.
Gross, D. P., Armijo-Olivo, S., Shaw, W. S., Williams-
Whitt, K., Shaw, N. T., Hartvigsen, J., ... & Steenstra,
I. A. (2016). Clinical decision support tools for
selecting interventions for patients with disabling
musculoskeletal disorders: a scoping review. Journal of
occupational rehabilitation, 26(3), 286-318.
Hall, M., Frank, E., Holmes, G., Pfahringer, B., Reutemann,
P., & Witten, I. H. (2009). The WEKA data mining
software: an update. ACM SIGKDD explorations
newsletter, 11(1), 10-18.
Han, J., Pei, J., & Kamber, M. (2011). Data mining:
concepts and techniques. Elsevier.
Hill, J. C., Whitehurst, D. G., Lewis, M., Bryan, S., Dunn,
K. M., Foster, N. E., ... & Sowden, G. (2011).
Comparison of stratified primary care management for
low back pain with current best practice (STarT Back):
a randomised controlled trial. The Lancet, 378(9802),
1560-1571.
Hooff van, M. L., van Dongen, J. M., Coupé, V. M., Spruit,
M., Ostelo, R. W., & de Kleuver, M. (2018). Can
patient-reported profiles avoid unnecessary referral to a
spine surgeon? An observational study to further
develop the Nijmegen Decision Tool for Chronic Low
Back Pain. PloS one, 13(9), e0203518..
Hoy, D., Brooks, P., Blyth, F., & Buchbinder, R. (2010).
The epidemiology of low back pain. Best practice &
research Clinical rheumatology, 24(6), 769-781.
Koes, B. W., Van Tulder, M., Lin, C. W. C., Macedo, L. G.,
McAuley, J., & Maher, C. (2010). An updated overview
of clinical guidelines for the management of non-
specific low back pain in primary care. European Spine
Journal, 19(12), 2075-2094.
Kool, M., Bastiaannet, E., Van de Velde, C. J., & Marang-
van de Mheen, P. J. (2018). Reliability of Self-reported
Treatment Data by Patients With Breast Cancer
Compared With Medical Record Data. Clinical breast
cancer, 18(3), 234-238.
Landis, J. R., & Koch, G. G. (1977). The measurement of
observer agreement for categorical data. biometrics,
159-174.
Ling, C. X., & Sheng, V. S. (2010). Cost-sensitive
learning. Encyclopedia of machine learning, 231-235.
Linton, S. J., & Boersma, K. (2003). Early identification of
patients at risk of developing a persistent back problem:
the predictive validity of the Örebro Musculoskeletal
Pain Questionnaire. The Clinical journal of pain, 19(2),
80-86.
López, V., Fernández, A., García, S., Palade, V., & Herrera,
F. (2013). An insight into classification with
imbalanced data: Empirical results and current trends
on using data intrinsic characteristics. Information
sciences, 250, 113-141.
Oyeyemi, A. O., & Scott, P. (2018). Interoperability in
health and social care: organizational issues are the
biggest challenge. Journal of innovation in health
informatics, 25(3), 196-198.
Patel, S., Hee, S. W., Mistry, D., Jordan, J., Brown, S.,
Dritsaki, M., ... & Madan, J. (2016). Identifying back
pain subgroups: developing and applying approaches
using individual patient data collected within clinical
trials. Programme Grants for Applied Research, 4(10).
Rice, M. E., & Harris, G. T. (2005). Comparing effect sizes
in follow-up studies: ROC Area, Cohen's d, and r. Law
and human behavior, 29(5), 615-620.
Shafique, U., & Qaiser, H. (2014). A comparative study of
data mining process models (KDD, CRISP-DM and
SEMMA). International Journal of Innovation and
Scientific Research, 12(1), 217-222.
Shortliffe, E. H., & Sepúlveda, M. J. (2018). Clinical
decision support in the era of artificial
intelligence. Jama, 320(21), 2199-2200.
Simpson, A. K., Cholewicki, J., & Grauer, J. (2006).
Chronic low back pain. Current pain and headache
reports, 10(6), 431-436.
Sterne, J. A., White, I. R., Carlin, J. B., Spratt, M., Royston,
P., Kenward, M. G., ... & Carpenter, J. R. (2009).
Multiple imputation for missing data in
epidemiological and clinical research: potential and
pitfalls. Bmj, 338, b2393.
Szende, A. G. O. T. A. (2007). EQ-5D value sets:
inventory, comparative review and user guide. M.
Oppe, & N. J. Devlin (Eds.). Berlin, Germany::
Springer.
Tait, R. C., Chibnall, J. T., & Krause, S. (1990). The pain
disability index: psychometric properties. Pain, 40(2),
171-182.
Widerström, B., Olofsson, N., Boström, C., & Rasmussen-
Barr, E. (2016). Feasibility of the subgroup criteria
included in the treatment-strategy-based (TREST)
classification system (CS) for patients with non-
specific low back pain (NSLBP). Manual therapy, 23,
90-97.
HEALTHINF 2020 - 13th International Conference on Health Informatics
124
