
Recognition of Online Handwritten Gurmukhi Strokes
using Convolutional Neural Networks
Rishabh Budhouliya
1
, Rajendra Kumar Sharma
1
and Harjeet Singh
2
1
Department of Computer Science and Engineering, Thapar Institute of Engineering and Technology, Punjab, India
2
Chitkara University Institute of Engineering and Technology, Chitkara University, Punjab, India
Keywords:
Convolutional Neural Networks, Data Augmentation, Stroke Warping, Gurmukhi Strokes, Online
Handwritten Character Recognition.
Abstract:
In this paper, we attempt to explore and experiment multiple variations of Convolutional Neural Networks on
the basis of their distributions of trainable parameters between convolution and fully connected layers, so as
to achieve a state-of-the-art recognition accuracy on a primary dataset which contains isolated stroke samples
of Gurmukhi script characters produced by 190 native writers. Furthermore, we investigate the benefit of data
augmentation with synthetically generated samples using an approach called stroke warping on the aforemen-
tioned dataset with three variants of a Convolutional Neural Network classifier. It has been found that this
approach improves classification performance and reduces over-fitting. We extend this finding by suggesting
that stroke warping helps in estimating the inherent variances induced in the original data distribution due to
different writing styles and thus, increases the generalisation capacity of the classifier.
1 INTRODUCTION
Research in Online Handwritten Recognition Sys-
tems seems to have peaked since the late 1990s, con-
sidering the fact that Google
0
s Multilingual Online
Handwritten Recognition System is able to support
22 scripts and 97 languages, which is being currently
used by certain commercial products like Google
Translate successfully (Keysers et al., 2017). Despite
this success in Google
0
s system, we want to bring cer-
tain factors into light which are limited to the scope of
Indo-Aryan Languages -
• Each written language has a strong variability as-
sociated with the writing style depending upon
certain demographic factors like region, age and
culture.
• In the case of such languages, major issues tackled
by any researcher include the shape complexity of
the characters, features for recognition of charac-
ters and stroke level recognition.
Motivated by these factors, our work aims to:
• Use a primary dataset called OHWR-Gurmukhi,
described in section IV, to sub sample a dataset
which includes 79 stroke classes with 100 sam-
ples each, referred as dataset 100. A Convolu-
tional Neural Network has been used to classify
the strokes to achieve a state-of-the-art accuracy.
• Explore and evaluate multiple CNN variants on
the basis of their distribution of trainable param-
eters between convolution layer and fully con-
nected layer on datasets with varying data samples
per class.
• Study the effect of stroke warping, a technique to
produce random variances within the stroke sam-
ples. The warped augmented dataset is created by
applying a combination of affine transformation
(rotation) and elastic distortions to images of the
existing stroke samples.
• Experimentally evaluate the effect of data aug-
mentation on classification accuracy of the clas-
sifier.
This paper is structured as follows. In section II, there
is a discussion about the development of character
recognition and the progression in Gurmukhi script
recognition. In section III, we introduce the Gur-
mukhi script, covering its features and the different
styles of writing the script. The generation of syn-
thetic data is covered in section IV, where we use
the technique called stroke warping, to augment the
dataset 100. After that, we delve into our main idea
in section V, an experiment which tests three classi-
fiers to validate the benefit of data augmentation and
578
Budhouliya, R., Sharma, R. and Singh, H.
Recognition of Online Handwritten Gurmukhi Strokes using Convolutional Neural Networks.
DOI: 10.5220/0008960005780586
In Proceedings of the 12th International Conference on Agents and Artificial Intelligence (ICAART 2020) - Volume 2, pages 578-586
ISBN: 978-989-758-395-7; ISSN: 2184-433X
Copyright
c
2022 by SCITEPRESS – Science and Technology Publications, Lda. All rights reserved

to achieve an optimal classification accuracy. In sec-
tion VI, the framework of the experiment is laid out
and results of the performed experiments are shown.
We discuss the result and their consequences on the
objectives of the paper in section VII and we conclude
the findings in section VIII.
2 RELATED WORK
LeNet was the very first Convolutional Neural Net-
work used for visual detection tasks including char-
acter recognition and document analysis (Jackel et al.,
1995). This neural network was used to extract local
geometric features from the input image in a way that
preserved approximate relative locations of these fea-
tures. By convolving the input image with a trainable
kernel, the network was able to produce high level
feature maps which were then fed to a linear classifi-
cation layer. For the system they created, an overall
OCR accuracy exceeding 99.00% was achieved.
Owing to the continuous academic research in
the Online Handwritten Chinese Character Recogni-
tion, it has been demonstrated (Xiao et al., 2017) that
methods based on CNNs can learn more discrimi-
native features from source data, which may lead to
a better end-to-end solution for Online Handwritten
Recognition problems. The authors of this paper con-
tinued to design a compact CNN classifier for On-
line Handwritten Chinese Character Recognition us-
ing DropWeight for pruning redundant connections
in a CNN architecture maintaining an accuracy of
96.88%. Handwritten Bangla Digit Recognition us-
ing a CNN with Gaussian and Gabor Filters, achieved
98.78% recognition accuracy (Alom et al., 2017).
Along with working on improving the recognition
accuracy of the classifiers, researchers also worked
upon writer adaptation for online handwritten recog-
nition where they used lexemes to identify the styles
present in a particular writer’s sample data which re-
sulted in the reduction of average error rate on hand-
written words (Connell and Jain, 2002).
In the present paper, we demonstrate a method
to capture the variability induced by different writ-
ing styles, thus enhancing the generalization accu-
racy of the classifier. It is pertinent here to discuss
the progression in Gurmukhi script recognition. A
recognizer using pre-processing algorithms (Normal-
ization, Interpolation and Slant Correction) has been
proposed to recognize loops, headline, straight line
and dot features from online handwritten Gurmukhi
strokes collected on a pen-tablet interface by 60 writ-
ers (Sharma et al., 2007). After this, a post proces-
sor for improving the accuracy of character recog-
nition was built to detect and aggregate strokes us-
ing set theory to recognize characters with an accu-
racy of 95.60% for single character stroke sequencing
(Kumar and Sharma, 2013). This work was done on
a dataset of 27,231 samples categorized on the ba-
sis of the proficiency of the writers. A significant
shift came after Hidden Markov Models(HMM) and
Support Vector Machines(SVM) were used for clas-
sification while employing the features extracted on
the basis of region and cursiveness. This experiment
resulted in a 96.70% recognition rate of Gurmukhi
characters (Verma and Sharma, 2016). Their experi-
ments consisted of the methods to extract features and
then classify them using SVM or HMM for classifica-
tion. Our aim in this work is to use the Deep Learn-
ing concept of learning features and then performing
extensive experimentation using CNNs to obtain bet-
ter recognition accuracy. One of the main advantage
of using a CNN is that it is able to extract features
automatically and is invariant to shift and distortion
(Wong et al., 2016).
3 GURMUKHI SCRIPT
Punjabi language is spoken by about 130 million peo-
ple, mainly in West Punjab in Pakistan and in East
Punjab in India. Indian Punjabi is written using the
Gurmukhi script, which has a fairly complex system
of tonal variance.
Some notable features of Gurmukhi script are :
• Gurmukhi script is cursive and written in left to
right direction with top down approach.
• A horizontal line, called a “shirorekha” is found
on the upper part of almost all the characters.
• Any Gurmukhi word can be divided into three
sections viz. Upper Zone, Middle Zone and the
Lower Zone. All the strokes are classified into
one of the three zone. The upper zone consists of
the region above the head line where some of the
vowels reside. The middle zone is the most popu-
lated zone, consisting of consonants and some of
the vowels. The lower zone contains some vow-
els and half characters that lie below the foot of
consonants (Verma and Sharma, 2017).
3.1 Different Styles of Writing
Gurmukhi Script
The critical area of research in Character recognition
is to capture and detect the complex nature of any
script that results in the variation of writing styles.
The documented reasons for variation in handwriting
Recognition of Online Handwritten Gurmukhi Strokes using Convolutional Neural Networks
579

Figure 1: Stroke classes for Gurmukhi character set.
style can be attributed to a distinct way of writing for
each person, and the ways can be:
• Speed of writing
• Style of holding the pen
• Formation of a character can be influenced by
the amount of strokes used to create a character.
Some users use a single stroke while others may
use multiple strokes to write the same thing.
3.2 Data Collection
The source population of our dataset is created by 190
writers of different age group to bring maximum vari-
ability in the population. A touch based, Tablet PC
has been used as input interface. The collected data
was annotated at stroke level with respective stroke
classes characterized by three zones; Upper, Middle
and the Lower zone as shown in Figure 1.
4 DATA AUGMENTATION
The data for this experiment was extracted from the
dataset called OHWR-Gurmukhi, which contains x-
and y- coordinates of the strokes captured using a
tablet PC. The x- and y- coordinates from an XML
file were parsed and converted into binary images us-
ing Python. We have chosen to work for the Mid-
dle Zone stroke set, particularly for the reason that
it contains some of the most complex strokes in any
character. Hence, dataset 100 contains 79 classes,
each class representing a distinct stroke, having 100
labeled 60×60 pixel images. This dataset was used
for two purposes. Firstly, it was used to create the
synthetic data through the augmentation techniques.
After that it was divided into a 75 images per class
training set, and 25 images per class testing set. No
Figure 2: The distribution of dataset 100 into training and
test set.
validation set was created due to the small size of the
dataset 100.
An important question to be answered is why does
an increase in data size by augmentation of sample
images increases the generalization accuracy? Also,
if there is an increase, could it be attributed to the fact
that stroke warping is able to capture the variability in
the empirical population due to the writer’s personal
characteristics as discussed above. To answer these
questions, we have set-up an experiment where the
correlation between change in nature of the dataset
due to addition of synthetic data samples and increase
in recognition accuracy can be seen and verified by
comparing performances of three different CNN clas-
sifiers on those different datasets.
4.1 Augmentation in Data-space
The debate on the correct usage of synthetic data for
training a model was provoked at the 5th ICDAR con-
ference (Baird, 1989), resulting in a list of conclu-
sions:
• Usage of synthetic data was definitely beneficial
as the model that is trained on the most data wins.
• Although producing synthetic data was consid-
ered a good practice, it was not considered safe.
Training on a mixture of real data and synthetic
data was considered the safest.
• Testing on synthetic data to claim good perfor-
mance is conceptually wrong.
At present, it has been well established that data aug-
mentation is a powerful technique to regularize neural
ICAART 2020 - 12th International Conference on Agents and Artificial Intelligence
580

Figure 3: Stroke ID:169 and Stroke ID:223, former being
the first picture position wise. Median Filter was used to
smoothen the stroke images first, then stroke warping was
applied, with a combination of varying α withing the range
of 4-6 pixels and random rotation within the range of 5 to
30 degrees in both directions.
networks to prevent over fitting and improve perfor-
mance in an imbalanced class situation. Moreover,
they have shown that there is a direct correlation be-
tween the improved object detection performance and
the increase in average number of training samples
per class. The techniques involved in creating artifi-
cial training samples range from cropping, rotating to
flipping input images. Our method of data augmen-
tation is a combination of such simple techniques and
elastic deformation, explained in the next sub-section.
4.2 Stroke Warping
Stroke warping is the technique used during the train-
ing process in order to produce random variations in
the data (Yaegar et al., 1996). This technique pro-
duces a series of characters which are consistent with
stylistic variations within the writers. In the experi-
ment, we try to find if these stylistic variations cre-
ate a synthetic sample distribution which is close to
the real population distribution of the 190 writers. In
our experiment, the warped character stroke was cre-
ated using a combination of affine transformation (ro-
tation) and elastic deformation to the existing dataset
as shown in Figure 3.
The elastic deformations on the images were cre-
ated by first generating normalized random displace-
ment field r(x, y) where (x, y) is the location of a pixel
such that
R
w
= R
o
+ α ∗ r(x, y) (1)
where R
w
and R
o
explain the location of the pixels in
the warped and original images respectively. Here, α
decides the magnitude of displacement. The displace-
ment fields are convolved with a Gaussian of standard
deviation of σ which is the smoothness factor of the
extent of elastic deformation.
Figure 4: Distribution of dataset 2000 into training and val-
idation set. Testing set was chosen to be the dataset 100.
4.3 Generation of Synthetic Data using
Stroke Warping
The binary images of size 60×60 pixel taken as bi-
nary images from the dataset 100 were first convolved
with a median filter, with kernel size 3×3 pixels to
smoothen out the irregularities in the stroke images.
After this, the images were subjected to a random
rotational transformation varying from 5
◦
to 30
◦
in
both clockwise and anti-clockwise direction. The im-
ages were distorted using elastic distortion, with σ
as 37, and α randomly varied from 4-5 pixels with
each image. This whole process was used to extrapo-
late 2,000 images per stroke from the 100 image per
stroke dataset. Hence, the produced synthetic dataset
had 1,58,000 samples in total, with 1,800 samples per
stroke devoted for training data, rest 200 images per
stroke for the validation set as shown in Figure 4. This
dataset will be referred as dataset 2000 in this paper.
It is worth mentioning that the amounts of each dis-
tortion in an image to be applied was examined by
human eye to verify that they induce a natural range
of variation in the dataset.
4.4 Division of Synthetic Dataset into
500, 1,000 and 1,500 Samples per
Stroke
The synthetic dataset, dataset 2000, was randomly
divided into smaller subsets of sizes 500, 1,000
and 1,500 images per class as shown in Figure 5.
These smaller subsets will be referred as dataset 500,
dataset 1000 and dataset 1500, respectively. This was
done with a purpose to validate the hypothesis that
classification accuracy can be increased by increasing
the data samples with the help of augmentation. All
the three classifier models have been trained on these
Recognition of Online Handwritten Gurmukhi Strokes using Convolutional Neural Networks
581

Figure 5: Redistribution of dataset 2000 into dataset 500,
dataset 1000, dataset 1500.
subsets and further tested on the original images and it
has been expected that the testing accuracy increases
as the size of the training dataset increases.
5 METHODOLOGY
In accordance to the initial objectives, we pro-
pose an experiment which is designed to find
the optimal recognition accuracy for Gurmukhi
strokes. To do so, the experiment starts with
training three different CNN classifiers on five
datasets (dataset 100, dataset 500, dataset 1000,
dataset 1500, dataset 2000). Now, 20.00% of the in-
put dataset is used for validation and testing is done
on the dataset
100, with 7,900 images. The reason
for choosing such a testing set was to ensure that our
testing accuracy depicts a good picture of the capac-
ity of the model to imitate the original distribution of
dataset 100. This process has furnished three graphs,
one for each model, depicting the performance of
each model with varying datasets. These graphs will
be used to validate the findings of the experiment.
The CNN classifier has three variants, all of them
vary on the basis of their structure in terms of number
of convolution layers or fully connected layers used
in the model. In the next section, we introduce the
reason for defining these three models and after that
we explain them in detail.
5.1 Reason behind Selection of Multiple
Classifiers for Experimentation
Our first step in understanding the dataset 100 was
to empirically train and test it on a CNN model with
9,35,760 learnable parameters. The model is de-
scribed below:
• Convolutional Layers: The model had four con-
volutional layers, all of them having a kernel of
size 5×5 pixels with number of kernels doubling
from 16 to 128 in each layer. The kernels were
initialized with He normal initializer which draws
samples from a truncated normal distribution (He
Figure 6: Classification of three CNN models on the basis of
the learnable parametric distribution between convolutional
layers and fully connected layers.
et al., 2015). ReLU was chosen as the activation
function.
• Pooling layers: Max Pooling was applied with
2×2 pixel sized filter at a sliding stride of 1.
• Fully Connected (FC) Layers: Two fully con-
nected layers were connected to the feature ex-
tracting layers, one with 512 neurons and the next
one with 128 neurons.
• Activation function for both of them was ReLU
function.
• Dropout Layers: After each FC layer, a dropout
layer with a dropout probability of 25.00% was
placed to reduce over fitting.
• Classification Layer: A fully connected layer with
79 neurons (each representing a distinct stroke
class) with Softmax activation function for find-
ing the categorical distribution has been used.
This model was trained with 6,320 images (80 stroke
images per class) and tested on an unseen data of
1,580 images (20 stroke images per class). It is ev-
ident that this dataset is small, hence a validation set
could not be created. With a batch size of 246 samples
and 35 epochs in total, testing accuracy turned out to
be 93.65% with a training accuracy of 99.17%. There
ICAART 2020 - 12th International Conference on Agents and Artificial Intelligence
582
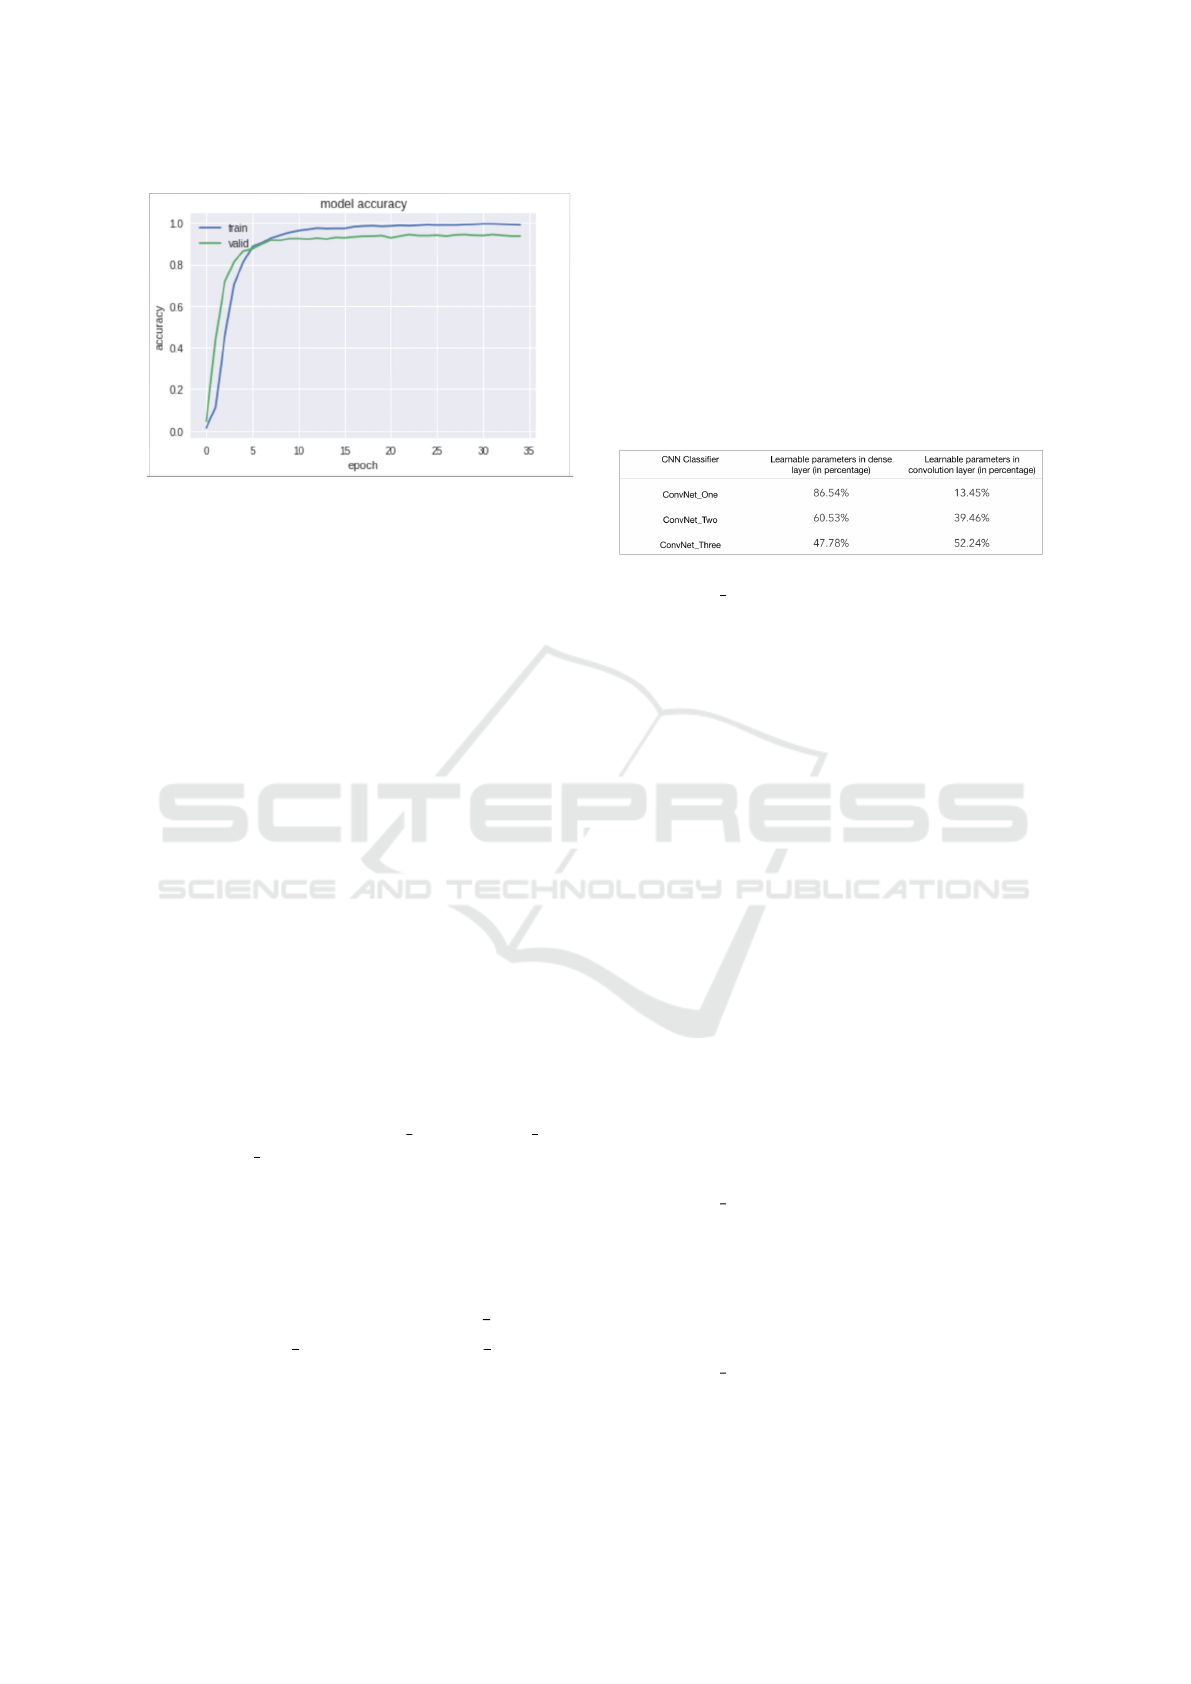
Figure 7: The gap between the training accuracy and vali-
dation accuracy depicts the high bias within the model.
is clear gap between the two accuracies, which can
be seen in Figure 7, guiding us to the fact that over-
fitting is deteriorating the generalization capacity of
the model. After this experiment, repeated scenarios
were created, and after running our data through those
scenarios, we reached to the following conclusions:
• Regularization: Among L1 regularization, L2 reg-
ularization and Dropout regularization, Dropout
seems to work best to reduce over fitting. Thus
for our experiment, we have chosen dropout lay-
ers only.
• Convolutional Layers vs Fully Connected Lay-
ers: Repeated experiments implied that fully con-
nected layers may have a greater percentage of
contribution towards the over-fitting in the model.
The reason for such a phenomenon could be at-
tributed to the fact that larger percentage of train-
able parameters reside in these layers. For com-
parison, only 28.80% of the trainable parameter
are contributed by the convolutional layers, while
the rest of the 71.20% lies within the FC layers for
this model.
These conclusions were the foundation for creating
three variations of a CNN classifier. The variations
have been referred as ConvNet One, ConvNet Two
and ConvNet Three. We assume that the distribution
of trainable parameters between convolutional layer
and fully connected layer, shown in Table 1 can be
used as a useful hyper parameter to control the over-
fitting in the model, thus finding an optimal classifier
in the process.
5.2 Proposed Models: ConvNet One,
ConvNet Two and ConvNet Three
In Figure 6, the structure of each model is explained
graphically. The fundamental difference between
these models is the percentage of trainable parameters
shared between convolutional layers and fully con-
nected layers. We have stacked convolutional layers
in the second and third model. We hypothesize that
with each model, the effects of over-fitting should di-
minish due to balanced share of trainable parameters.
Stacking convolutional layers could help in extract-
ing enhanced features and we wish to test this in the
experiment.
Table 1: Distribution of trainable parameters between con-
volutional and fully connected layer.
• ConvNet One: This is the simplest model in terms
of number of layers and trainable parameters, the
configuration of this model is as follows:
– Convolutional Layers: The model has three
convolutional layers, all of them having a ker-
nel size of 5×5 pixels with number of ker-
nels doubling from 16 to 64 for the third con-
volutional layer. The kernels were initialized
with He normal initializer which draws samples
from a truncated normal distribution. ReLU
was chosen as the activation function.
– Pooling Layers: Max Pooling was applied with
2 by 2 pixel sized filter at a sliding stride of 1.
– Fully connected layers: Two FC layers were
connected to the feature extracting layers, one
with 128 neurons and the next one with 64 neu-
rons. Activation function for both of them was
ReLU function.
– Dropout Layers: After each FC layer, a dropout
layer with a dropout probability of 25.00% was
placed to reduce over fitting.
– Classification Layer: A fully connected layer
with 79 neurons (each representing a distinct
stroke class) with Softmax activation function
for finding out the categorical distribution.
• ConvNet Two: This model has two convolutional
layers stacked together three times with dropout
layer after each stack of convolutional layers.
The dropout probability progress from 15.00% to
25.00% and then to 35.00% right after the FC
layer. Other than this, it shares the same configu-
ration with the first model.
• ConvNet Three: In this network, three convolu-
tional layers are stacked together three times with
dropout layer after each stack of convolutional
layers. The dropout probability progresses in the
Recognition of Online Handwritten Gurmukhi Strokes using Convolutional Neural Networks
583

Table 2: Configurational parameters for the experiment.
same fashion as in ConvNet Two. It shares the
same configurational details for the rest of the pa-
rameters as ConvNet One or ConvNet Two.
6 EXPERIMENTS AND RESULTS
The experiment, as explained in the methodology sec-
tion, is structured as follows:
• The experiment is divided into 5 training sessions,
each session is associated with training on a par-
ticular dataset. Each session has the same models,
with the same configuration.
• The configurational parameters for the whole ex-
periment are given in Table 2. The optimizer for
every session was chosen to be an algorithm based
on adaptive moment estimation, called Adam with
the default parameters as mentioned in the origi-
nal paper (Kingma and Ba, 2017).
• Metrics to evaluate the performance of each
model is the testing accuracy on the unseen data.
• The testing set was chosen to be dataset 100 with
7,900 images, which is the original dataset. As
each model was trained in each session, testing
accuracy was recorded for each dataset and we
have produced a graph for each model with ‘im-
age samples per class’ being the independent vari-
able and ‘testing accuracy’ being the dependent
variable.
• The difference between training accuracy and val-
idation accuracy (on the validation dataset) was
recorded for each observation as it is an indica-
tion of decreased over-fitting in a model.
• Among all the recorded observations, the highest
testing accuracy achieved would be awarded the
state of the art Gurmukhi character recognition ac-
curacy for OHWR-Gurmukhi dataset.
This experiment was created and executed to achieve
the goals laid out in the introduction section, and we
discuss them in the next sections, where we present
the model wise results in conformance to the structure
of the experiment presented above.
Table 3: A tabular representation of the progress of training
ConvNet One.
94.15
93.7
94.56
95.12
94.53
92
94
96
500 1000 1500 2000
ConvNet_One: samples per class
testing accuracy
Figure 8: A graphical representation of the performance of
ConvNet One.
6.1 ConvNet One Results
Starting with the difference between the training ac-
curacy and validation accuracy, it is clear that over-
fitting decreases in ConvNet One as the difference
decreases with an increase in data size except for
dataset 2000, shown in Table 3. Apart from that, a
look into Figure 8 reveals that testing accuracy in-
creases as samples per class increase but to a cer-
tain extent, as at dataset 2000, the accuracy has actu-
ally decreased from the previous observation, which
could be attributed due to the increase in over-fitting,
validated from the table, where the difference has in-
creased as well.
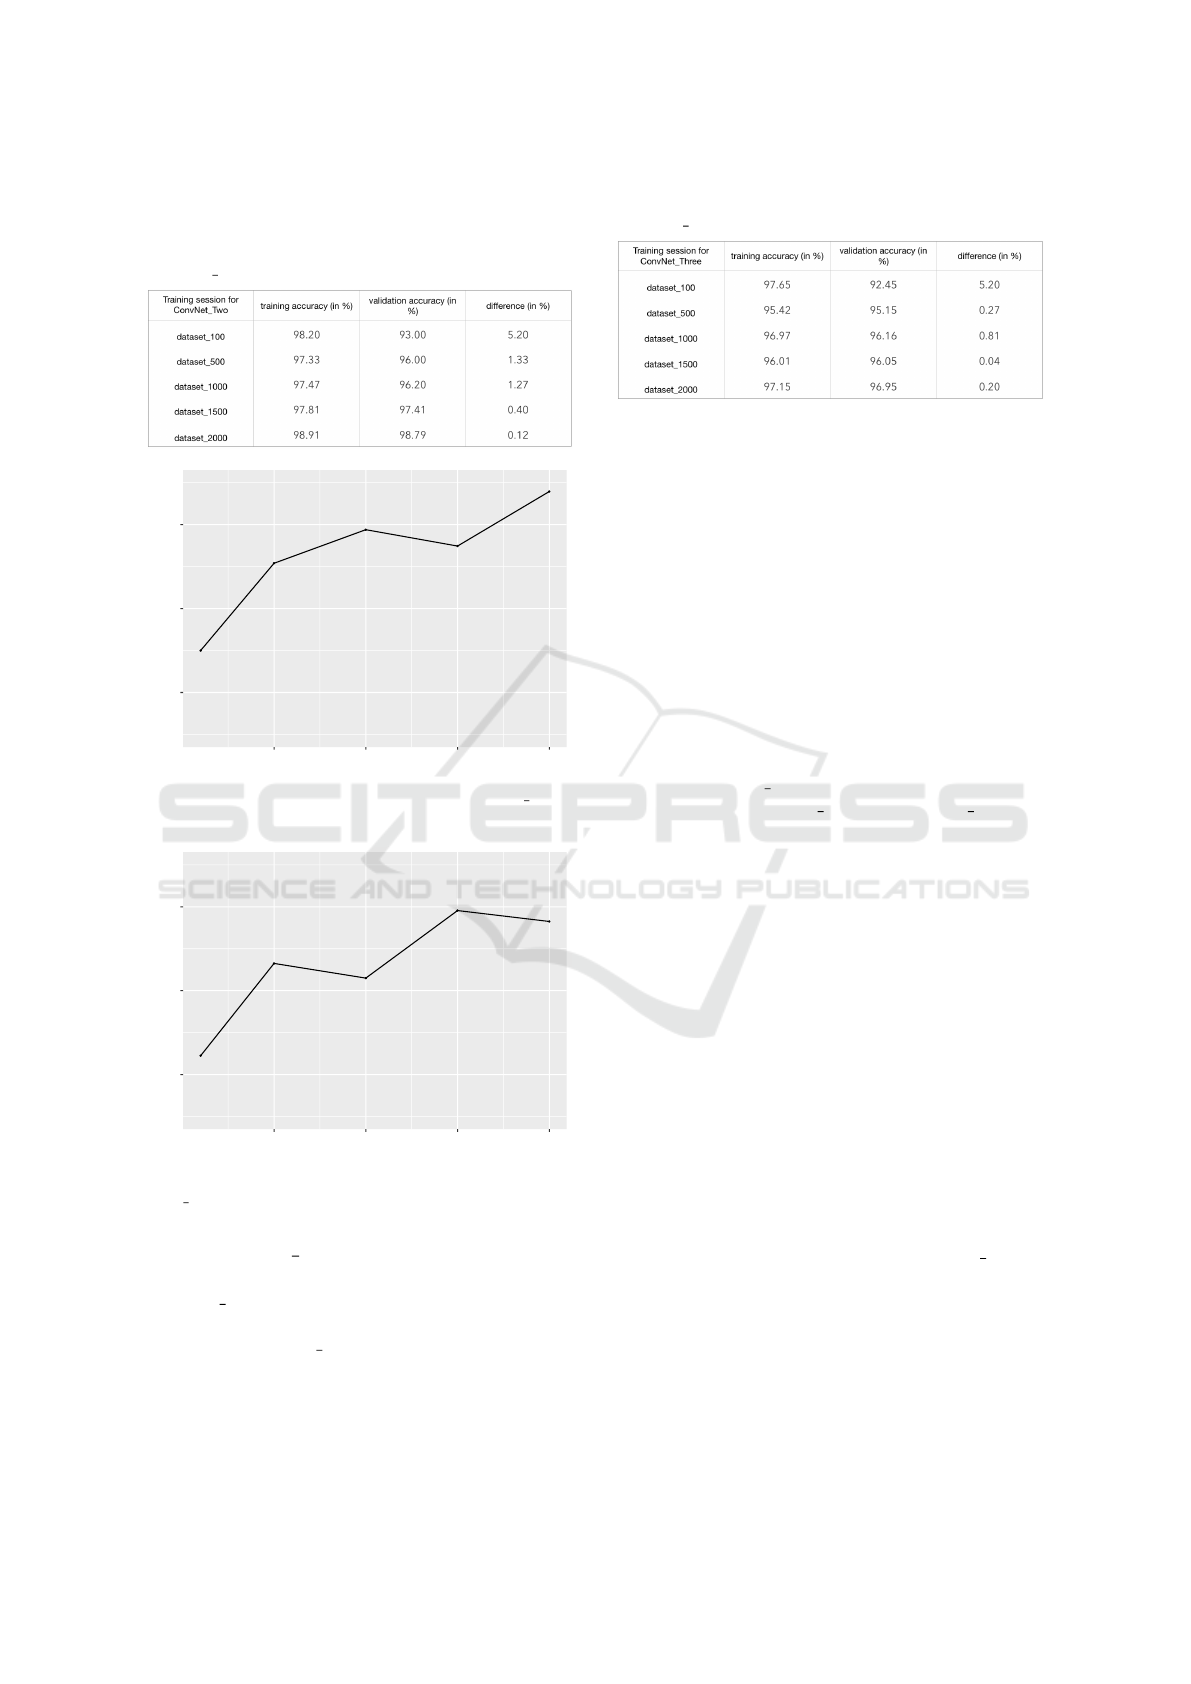
6.2 ConvNet Two Results
Here, by looking at Figure 9, it can be observed
that performance of ConvNet Two is better than Con-
vNet One in terms of testing accuracy. Since the
datasets for every model are same, this observation
could be reasoned with the fact that ConvNet Two
has a greater percentage of trainable parameters in the
convolution layers which in turn might have reduced
the over-fitting of the model. Also, the difference be-
tween the training and validation accuracy, as shown
in Table 4, has decreased in accordance to the claim
ICAART 2020 - 12th International Conference on Agents and Artificial Intelligence
584
that data augmentation can decrease over-fitting.
Table 4: A tabular representation of the progress of training
ConvNet Two.
93
95.08
95.88
95.49
96.79
92
94
96
500 1000 1500 2000
ConvNet_Two: samples per class
testing accuracy
Figure 9: A graphical representation of the ConvNet Two’s
performance.
92.45
94.65
94.3
95.91
95.65
92
94
96
500 1000 1500 2000
ConvNet_Three: samples per class
testing accuracy
Figure 10: A graphical representation of the Con-
vNet Three’s performance.
6.3 ConvNet Three Results
ConvNet Three has the most equitable distribution of
trainable parameters. Despite this, it is not able to
outperform ConvNet Two, evident in Figure 10 and
Table 5. This shows that the relationship between dis-
tribution of trainable parameters and performance of
a model is non linear, and the experiment conducted
is inadequate to claim that a 50-50% share of train-
Table 5: A tabular representation of the progress of training
ConvNet Three.
able parameters between convolution layer and fully
connected layer produces an optimal classifier.
7 DISCUSSION
It is imperative to note that all three models showcase
a common behaviour, an increase of data sample per
class improves their performance. This gives us two
results : First, we were able to achieve an optimal
Gurmukhi character recognition accuracy of 96.79%.
This is by far the highest accuracy achieved by a clas-
sifier on OHWR-Gurmukhi. Secondly, we were able
to prove that usage of data augmentation is beneficial
to the performance of a classifier but to a certain ex-
tent, as at dataset 2000, we saw a slight decline in
performance of ConvNet One and ConvNet Three.
Since data augmentation was done solely through
stroke warping, we believe that this technique is able
to produce alternate character forms that are consis-
tent with the stylistic variation within and between
writers of the collected dataset as claimed earlier by
the cited authors. This belief can be reinforced by our
results, as the generalization accuracy of each of our
model increases with the increase of synthetic sam-
ples generated through stroke warping.
8 CONCLUSION
This paper demonstrates the benefits and limitations
of data augmentation on the Gurmukhi character
strokes dataset, OHWR-Gurmukhi. It also attempts
to find a relation between distribution of trainable pa-
rameters in a Convolutional Neural Network and the
performance of a classifier, where ConvNet Two, a
model with a pair of convolution layers stacked to-
gether, is able to achieve the highest testing accuracy
among the three proposed models. We also find stroke
warping as an effective technique to augment the data
with. We would like to perform data augmentation
through Generative Adversarial Networks on OHWR-
Gurmukhi. Also, there is a scope of analyzing the
distribution of stylistic variations within and between
Recognition of Online Handwritten Gurmukhi Strokes using Convolutional Neural Networks
585

writers for a particular language which would help in
building more powerful classifiers in this classifica-
tion field.
REFERENCES
Alom, M. Z., Sidike, P., Taha, T. M., and Asari, V. K.
(2017). Handwritten Bangla Digit Recognition using
Deep Learning. https://arxiv.org/abs/1705.02680/.
Baird, H. S. (1989). The State of the Art of Document Im-
age Degradation Modeling. Xerox Palo Alto Research
Center.
Connell, S. D. and Jain, A. K. (2002). Writer Adaptation
for Online Handwriting Recognition. IEEE Transac-
tions on Pattern Analysis and Machine Intelligence,
24(3):329–346.
He, K., Zhang, X., Ren, S., and Sun, J. (2015). Delving
Deep into Rectifiers: Surpassing Human-Level Per-
formance on ImageNet Classification. https://arxiv.
org/abs/1502.01852.
Jackel, L., Battista, M., Baird, H., Ben, J., Bromley, J.,
Burges, C., Cosatto, E., Denker, J., Graf, H., Kat-
seff, H., Lecun, Y., Nohl, C., Sackinger, E., Shamil-
ian, J., Shoemaker, T., Stenard, C., Strom, I., Ting, R.,
Wood, T., and Zuraw, C. (1995). Neural-net applica-
tions in Character Recognition and Document Analy-
sis. In Neural-net applications in telecommunications.
Kluwer Academic Publishers.
Keysers, D., Deselaers, T., Rowley, H., Wang, L., and Car-
bune, V. (2017). Multi-Language Online Handwriting
Recognition. IEEE Transactions on Pattern Analysis
and Machine Intelligence, 39(6):1180–1194.
Kingma, D. P. and Ba, J. L. (2017). ADAM: A METHOD
FOR STOCHASTIC OPTIMIZATION. https://arxiv.
org/abs/1412.6980.
Kumar, R. and Sharma, R. K. (2013). An Efficient Post
Processing Alogrithm For Online Handwriting Gur-
mukhi Character Recognition Using Set Theory. In-
ternational Journal of Pattern Recognition and Artifi-
cial Intelligence, 27(4).
Sharma, A., Sharma, R., and Kumar, R. (2007). Online
Handwritten Gurmukhi Strokes Preprocessing. In Ma-
chine GRAPHICS & VISION.
Verma, K. and Sharma, R. K. (2016). Comparison of
HMM- and SVM-based Stroke Classifiers for Gur-
mukhi Script. In The Natural Computing Applications
Forum 2016.
Verma, K. and Sharma, R. K. (2017). Recognition of Online
Handwritten Gurmukhi Characters Based on Zone and
Stroke identification. Sadhana, 42:701–712.
Wong, S. C., Gatt, A., Stamatescu, V., and McDonnell,
M. D. (2016). Understanding data augmentation for
classification: when to warp? https://arxiv.org/abs/
1609.08764.
Xiao, X., Yang, Y., Ahmad, T., Jin, L., and Chang, T.
(2017). Design of a Very Compact CNN Classifier for
Online Handwritten Chinese Character Recognition
Using DropWeight and Global Pooling. 14th IAPR
International Conference on Document Analysis and
Recognition, pages 891–895.
Yaegar, L., Lyon, R., and Webb, B. (1996). Effective Train-
ing of a Neural Network Character Classifier for Word
Recognition. In Advances in Neural Information Pro-
cessing Systems (NIPS).
ICAART 2020 - 12th International Conference on Agents and Artificial Intelligence
586
