
Evaluation to Classify Ransomware Variants based on Correlations
between APIs
Jiaxing Zhou
1
, Miyuki Hirose
1
, Yoshio Kakizaki
1
and Atsuo Inomata
2
1
Tokyo Denki University, 5 Senju Asahicho, Adachiku, Tokyo, Japan
2
Osaka University, 1-1 Yamadaoka, Suita, Osaka, Japan
Keywords: Ransomware, Subspecies, SVM, Pearson Correlation Coefficient.
Abstract: Research into ransomware subspecies classification is ongoing in many organizations, but it is proving diffi-
cult to extract feature quantities from specimens and the accuracy achieved thus far remains unsatisfactory.
In this paper, we propose a method to classify subspecies that using the correlation coefficient between API
groups calculated by Application Programming Interfaces (API) frequencies as the Support Vector Machines’
(SVM) feature quantities. The motivation for using the correlation coefficient between API groups as the
feature quantity is that different ransomware families have different behavior patterns that can be reflected by
the correlation between API groups. Based on the results of an evaluation experiment, we found that the
accuracy of the proposed method was 98%, proving that the subspecies were classified correctly. Otherwise,
it is determined that the contribution of each API for classifying ransomware families is different via analysis
of the contribution of API.
1 INTRODUCTION
According to a 2018 report by Check Point Software
Technologies Ltd., malware has increased in the num-
ber of year by year. Locky, which is a type of ransom-
ware, ranked third in the global list of malware
(CheckPoint, 2018). By classifying ransomware var-
iants, it is possible not only to facilitate the creation
of countermeasures for each ransomware family,
fight against the ransomware effectively (Hull, John,
& Arief, 2019) but also to reduce the workload of an-
alysts (Zhang et al., 2019).
However, in order to classify ransomware, feature
extraction in static analysis is difficult because of the
code obfuscation (Moser, Kruegel, & Kirda, 2007).
Therefore, we propose a method based on the corre-
lation among application programming interfaces
(APIs) to classify variants via support vector ma-
chines (SVM) by using the dynamic analysis of ran-
somware. The prevailing method for dynamic analy-
sis methods is using API calls to represent malware
behaviors (Galal, Mahdy, & Atiea, 2016). As the ran-
somware is a type of malware, thus the ransomware’s
behavior can be reflected by the statistical analysis of
the windows API calling sequence (Alazab,
Venkataraman, & Watters, 2010). Because of the
higher the correlation coefficient between system API
call, the more similar the two samples are, which
means that they are likely to belong to the same fam-
ily (Seideman, Khan, & Vargas, 2014). Therefore, we
utilize the correlation coefficient between API groups
by the API frequencies as the feature quantity to de-
termine the ransomware behavior pattern and family.
In this study, benign softwares and nine ransom-
ware samples were collected and used in experiments
to evaluate our proposed method. Our experimental
results show that the accuracy level of our method is
98%, the benign software’s F1 value is 97%, and the
ransomware variants are correctly classified. Simul-
taneously, we determined the contribution of each
API to classify each ransomware family.
The contribution of this paper is mainly the fol-
lowing:
a) To understand the relationship between the ran-
somwares’ activities easily, we used the Pearson
Correlation Coefficient to quantify this relation-
ship.
b) The contribution of each API to classify each ran-
somware family was determined.
The remainder of this paper is structured as follows.
Section 2 introduces related works dealing with ran-
somware detection and classification, and Section 3
Zhou, J., Hirose, M., Kakizaki, Y. and Inomata, A.
Evaluation to Classify Ransomware Variants based on Correlations between APIs.
DOI: 10.5220/0008959904650472
In Proceedings of the 6th International Conference on Information Systems Security and Privacy (ICISSP 2020), pages 465-472
ISBN: 978-989-758-399-5; ISSN: 2184-4356
Copyright
c
2022 by SCITEPRESS – Science and Technology Publications, Lda. All rights reserved
465

gives an overview of Pearson's correlation coefficient
(K. Pearson, 1895). Section 4 introduces the proposed
method. Section 5 describes the evaluation experi-
ments for the proposed method and presents experi-
mental results. Section 6 presents the discussion. Fi-
nally, Section 7 presents a summary of this study and
discusses future issues.
2 RELATED WORK
Malware analysis techniques mainly categorized into
three parts: static, dynamic and hybrid analysis
(Sihwail, Omar, & Ariffin, 2018). And studies on
malware detection and classification are gradually in-
creasing. Idika and Mathur presented a good over-
view of malware detection techniques (Idika &
Mathur, 2007). A comparison of malware analysis
and classification techniques was presented by Gan-
dotra et al. (Gandotra, Bansal, & Sofat, 2014). For dy-
namic analysis, Hampton et al. tested the baseline op-
erations of ransomware and normal software in a vir-
tual environment (Hampton, Baig, & Zeadally, 2018).
Dahl et al. presented a novel, large-scale malware
classification method which utilizes ransom projec-
tions to reduce the input space (Dahl et al., 2013). The
main APIs, extensions, cryptographic signatures
called by ransomware in dynamic terms utilized as
features to classify and predict known and new ran-
somware variants (Medhat, Gaber, & Abdelbaki,
2018). Kakisim et al. used API-call, usage system li-
brary and operations to classify malware (Kakisim et
al., 2019). API calls sequences and deep learning al-
gorithm were utilized to detect and classify malware
(Kolosnjaji et al., 2016; Liu & Wang, 2019). Other-
wise, Jung et al. proposed a ransomware detection
method based on context-aware entropy (Jung &
Won, 2018). By modeling malware’s interaction with
system resources to classify malware’s subspecies
was presented by Stiborek et al. (Stiborek, Pevný, &
Rehák, 2018). For hybrid analysis, static and dynamic
features and multiple algorithms were utilized to clas-
sify the malware families (Islam et al., 2013; Santos
et al., 2013). Anderson et al. utilized static, dynamic
features, and SVM to classify the malware variants
(Anderson, Storlie, & Lane, 2012).
3 CLASSIFICATION OF
RANSOMWARE APIs
We contend that ransomware subspecies can be clas-
sified by the correlations between API groups becau-
se of the cosine similarity between the DLLs used in
the method proposed in Subedi et al.’s work (Subedi,
Budhathoki, & Dasgupta, 2018). In order to utilize the
correlation between API groups as the feature quan-
tity, we began by conducting a preliminary survey
into those correlations.
3.1 API Groups Correlation
Coefficient
In our method, we first calculate the Pearson correla-
tion coefficient between the API groups, and then we
create a statistical diagram. In order to calculate the
correlation coefficient between API groups, we col-
lected the calling frequency of the ransomware APIs
listed in the preliminary survey. The ransomware
families surveyed were Cerber, CryptoWall, Cryp-
toLocker, Jigsaw, Locky, Genasom, Petya, Reveton,
and TeslaCrypt. A number of non-malicious software
types were also surveyed.
Because the dynamic analysis makes use of the
system calls which interact with the operating system
and resources that reflect the ransomware behaviors
(Hampton et al., 2018; Naval et al., 2015), the sur-
veyed content first identified the API groups by type,
of which five were used in the preliminary survey:
FileAPI group which are file-related APIs, CryptAPI
group which are cryptographic APIs, RegistryAPI
group which used to modify the registry key, Socket-
API group which used by ransomware to make net-
work communication, and ProcessAPI group which
used by ransomware for executing threads or files.
The details are as shown in Table 1. After the calling
frequencies of the APIs in Table 2 were extracted and
the correlation coefficients between API groups were
calculated by (Scipy.org, 2010):
ܴ
ൌܥ
ට
ܥ
ൈܥ
ൗ
(1)
where i, j is the API group i and j. ܴ
is the correla-
tion coefficient between API group i and j, C is the
covariance matrix of API groups. A comparison of
the correlation coefficients between API groups by
the family was conducted, as shown in Figure 1. In
this figure, the horizontal axis is the family name of
the ransomware and the vertical axis is the correlation
coefficient. The range of a correlation coefficient is [-
1, 1]. However, because this statistical diagram is a
combined vertical bar, the sum exceeds 1. Addition-
ally, if the correlation coefficient is smaller than 0.2,
statistics are not generated. Correlation coefficients
between API groups are defined in Table 2. As shown
in Figure 1, we found correlation differences between
API groups for each ransomware family, which
means our proposed method can use correlation coef-
ICISSP 2020 - 6th International Conference on Information Systems Security and Privacy
466
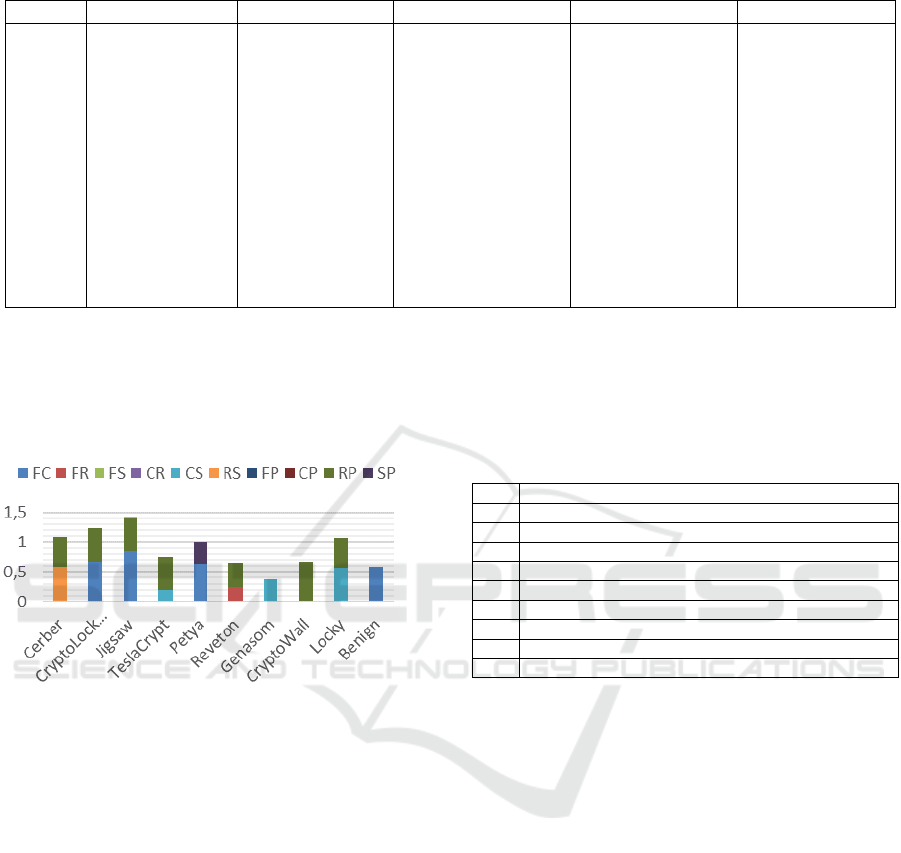
Table 1: Classification of API functions.
FileAPI CryptAPI RegistAPI SocketAPI ProcessAPI
Func-
tions
FindNextFile, Find
FirstFile, FindFirsF
ileEx, SetFilePointe
r, SetFilePointerEx,
GetFileSize, GetFil
eSizeEx, SetFileAtt
ributes, GetFileTyp
e, CopyFileEx, Cop
yFile, DeleteFile, E
ncryptFile, NtRead
FIle, NtWriteFile,
GetFileAttributes,
GetFileAttributesEx
CryptDerveKey, Cry
ptDecodeObject, Cr
yptGenKey, CryptI
mportPublicKeyInfo
, CryptAcquireConte
xt, CryptAcquireCo
ntextW
RegCloseKey, RegCrea
teKeyExW, RegDelete
KeyW, RegQueryValue
ExW, RegSetValueEx
W, RegEnumKeyExA,
RegOpenKeyExW, Nt
QueryValueKey, NtOp
enKey
socket, InternetOpen,
shutdown, sendto, con
nect, bind, listen, acce
pt, recv, send, Internet
OpenUrl, InternetRea
dFile, InternetWriteFil
e
CreateThread, Creat
eRemoteThread, Nt
ResumeThread, NtG
etContextThread, Nt
SetContextThread, C
reateProcessInternal
W, NtOpenProcess,
Process32NextW, Pr
ocess32FirstW, NtTe
rminateProcess
ficients between API groups as feature quantities
when working to classify subspecies. However, when
performing classification experiments, correlation
coefficients were used as feature quantities even if
they were smaller than 0.2.
Figure 1: Comparison of correlation coefficients quantities
between API groups of different families.
4 PROPOSED SCHEME
After analyzing the Pearson correlation coefficient
between API groups’, we will present the details of
the proposed scheme in this section.
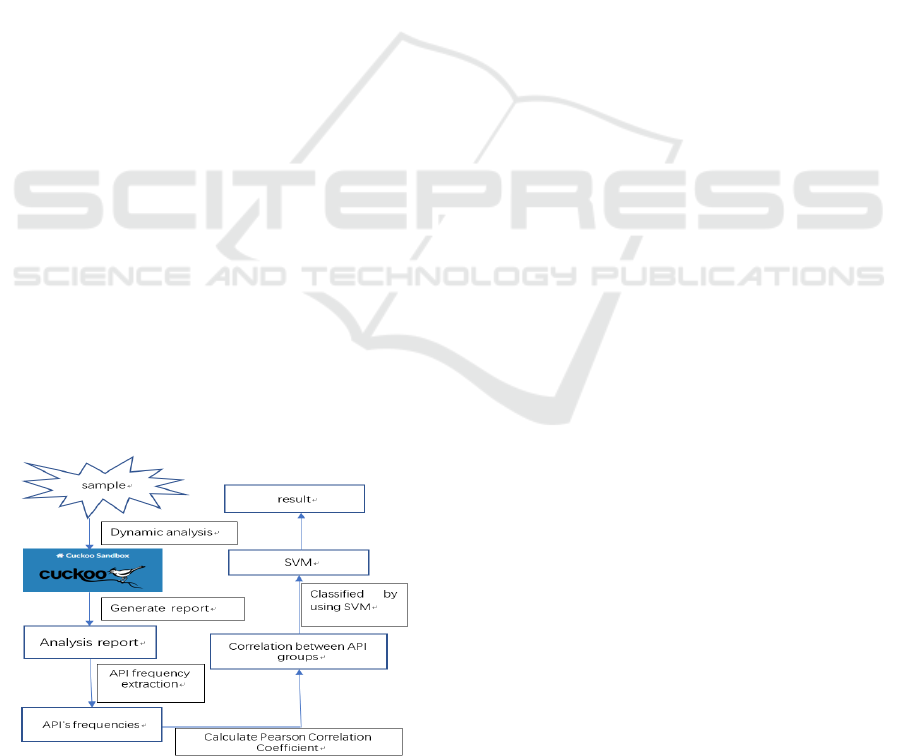
4.1 Method Outline
An outline of the proposed method in our work is
shown in Figure 2.
1) Cause the sample to be executed by dynamic anal-
ysis and then generates an analysis report for the
sample.
2) The calling frequency of the API from the list in
Table 1 is extracted from the generated reports
3) Obtain the Pearson correlation coefficients.
4) Finally, the classification is performed using
SVM.
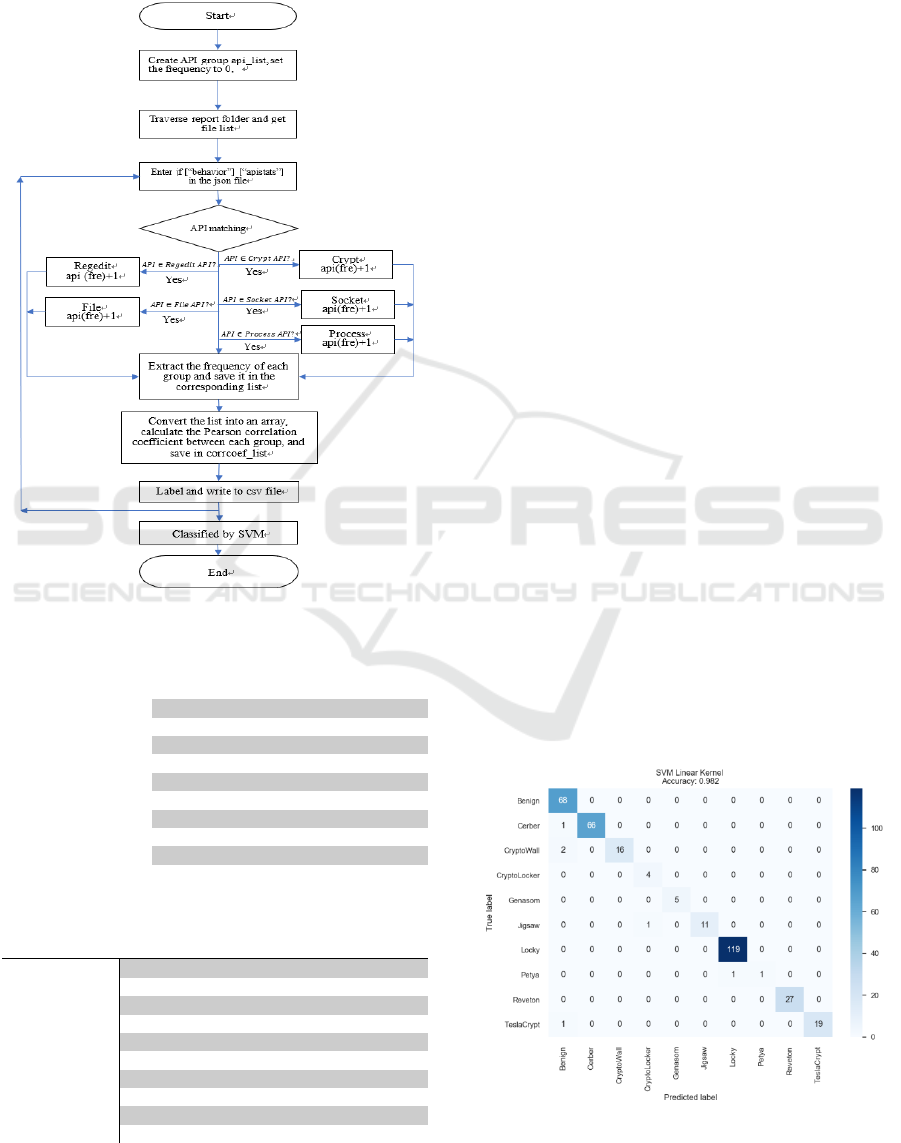
The algorithm of the proposed method is shown in
Figure 3. In the algorithm, api (fre) is the calling fre-
quency of the API. Next, we will explain the algo-
rithm.
Table 2: List of abbreviations.
FC API Group for File and API Group for Crypt
FR API Group for File and API Group for Registry
FS API Group for File and API Group for Socket
CR API Group for Crypt and API Group for Registry
CS API Group for Crypt and API Group for Socket
RS API Group for Registry and API Group for Socket
FP API Group for File and API Group for Process
CP API Group for Crypt and API Group for Process
RP API Group for Registry and API Group for Process
SP API Group for Socket and API Group for Process
4.2 Feature Extraction
The Cuckoo Sandbox (Cuckoo Sandbox, 2012) is a
well-known tool to analysis malware dynamically,
hence we utilize the Cuckoo Sandbox to analysis ran-
somware samples in order to obtain the dynamic dy-
namic analysis report.
1) Creating five API groups as shown in Table 1,and
initialize the API calling frequency to 0, traverse
the report folder, and then apply the algorithm to
each file.
2) If the API in “api_list” is included in [“apistats”],
the calling frequency of the corresponding API in
“api_list” is increased by 1 and saved in the cor-
responding list. The dynamical analysis reports
are saved in JavaScript Object Notation (JSON)
format, and the statistical information of the called
API is stored in [“apistats”].
4.3 Feature Conversion and Label
After extracting features, we convert the frequency
Evaluation to Classify Ransomware Variants based on Correlations between APIs
467
list to an array, calculate the Pearson correlation co-
efficients between API groups, and save them in the
“corrcoef_list”. Once a “corrcoef_list” has been cre-
ated for one file, it is labeled and written to a comma-
separated value (CSV) file. The label is the family
name of the sample. This process is then repeated to
extract the calling frequency of the corresponding
APIs in all JSON files in the report folder. Finally, the
created CSV file is used as input data and classified
by SVM.
5 EXPERIMENT
As previously mentioned, the purpose of this research
is to calculate the correlations between API groups
based on the frequencies of APIs called by ransom-
ware, and then to use those correlations as feature
quantities to classify ransomware variants.
5.1 Experiment Setup
In our classification experiment, Python 3.7 sklearn
(scikit-learn, 2008) were used, and the classification
method was SVM. The reason we used SVM is that
SVM has the advantage of high accuracy and can
work well even if the data is not linearly separable in
the basic feature space through an appropriate kernel.
Before classification, we optimized the SVM param-
eters. We used the dataset mentioned in Section 5.2
and GridSearchCV to find the best parameter, used
ShuffleSplit to do cross-validation. We set parameter
C:[1, 10, 100, 1000], kernel:[linear, rbf, poly, sig-
moid],gamma:[0.001, 0.0001], and degree:[2, 3, 4].
The optimal parameters are SVC, C = 1000, and ker-
nel = linear. We use Cuckoo Sandbox to extract the
frequencies of APIs called by the ransomwares.
Figure 2: Proposed method.
5.2 Dataset
The ransomware samples used in the experiment are
collected from several public websites (Hybrid-Anal-
ysis, 2013; Virusshare, 2007; Virusign, 2014; theZoo,
2015) and the number of samples for each family is
shown in Table 3. All collected benign software was
in a portable executable (PE) file format. Addition-
ally, the training and test data used for SVM are ran-
domly divided using train_test_split of sklearn. The
size of the test data is 30%. Because of the imbal-
anced dataset, we set the SVC’s parameter
“class_weight” to “balanced” (scikit-learn, 2008) (EE
Osuna, 1998) to reduce the impact of the unbalanced
dataset on classification.
5.3 Experimental Results
The rating scale of the prediction result is precision,
recall, F1, and support. The experimental results are
shown in Table 4 which is based on the ShuffleSplit
cross-validation. Then, to determine if our algorithm
is commonly mislabeling one as another, we made a
confusion matrix shown in Figure 4.
In addition, the benign classification results were
all above 0.9, which is considered to be correctly clas-
sified as normal software. The accuracy level reached
0.98, which is higher than the training results accu-
racy level, 0.933, and the testing result accuracy,
0.9414, in the previous research (Medhat et al., 2018).
These results show that the proposed method can be
considered useful for the classification of ransom-
ware variants.
Then, we made a comparison between the pro-
posed method’s results and related works’ results. As
shown in Table 5. From the comparison result, it is
clear that our proposed method has the highest accu-
racy which is 98.2%. Comparing with the related
works, the malware’s kinds which we analyzed were
just ransomware. And in terms of feature selection,
our feature types are very simple, only the correlation
between API groups. Therefore, although our pro-
posed method classified ransomware subspecies ef-
fective, it has certain limitations on classifying all
kinds of malware. Especially in the (Islam et al.,
2013)’s works, their proposed method’s results indi-
cate that integrating static and dynamic features can
improve accuracy. On the other hand, our work is dif-
ferent from related works in the feature analysis. It is
possible to understand the ransomware’s activities
pattern easily and determine the most important API
of each ransomware family because we analyzed the
correlation between features and behavior. However,
ICISSP 2020 - 6th International Conference on Information Systems Security and Privacy
468
in the related works, although they analyzed the ran-
somware behavior and utilized multiple features to
present the behavior pattern, for lack of deeply feature
analysis.
Figure 3: Algorithm of the proposed method.
Table 3: Dataset.
Family Name Quantity
Cerber 247
CryptoLocker 20
CryptoWall 47
Genasom 25
Jigsaw 29
Locky 334
Petya 6
Reveton 126
TeslaCrypt 65
Benign 241
Table 4: Experimental results.
Precision Recall F1 Support
Cerber 1.00 0.99 0.99 67
CryptoLocker 0.80 1.00 0.89 4
CyptoWall 1.00 0.89 0.94 18
Genasom 1.00 1.00 1.00 5
Jigsaw 1.00 0.92 0.96 12
Locky 0.99 1.00 1.00 119
Petya 1.00 0.50 0.67 2
Reveton 1.00 1.00 1.00 27
TeslaCrypt 1.00 0.95 0.97 20
Benign 0.94 1.00 0.97 68
6 DISCUSSION
After classifying the ransomware subspecies, we used
the sklearn’s library: OneVsRestClassifier and Ran-
domForestClassifier to determine the contribution of
each API to classify each ransomware family. In this
method, we used the randomForestClassifier as the
classifier to output the importance of the feature
(API) after each classification (feature_impor-
tances_) through OneVsRestClassifier, because On-
eVsRestClassifier involves training a single classifier
per class, with the samples of that class as positive
samples, and all other samples as negatives. In the ex-
periment of feature extraction, we used the APIs’ fre-
quencies as the feature quantities, because the corre-
lation coefficient is calculated from the frequencies
and the contribution of the correlation between the
APIs’ groups cannot indicate the contribution of indi-
vidual APIs. From the APIs’ contribution, we can de-
termine which type of API is important for classifying
which type of ransomware subspecies. For this reason,
we first used the APIs’ frequencies as feature quanti-
ties and OneVsRestClassifier, RandomForestClassi-
fier as the classifier to classify the ransomware sub-
species, the ransomware samples used in this experi-
ment are shown in Table 3. Including the normal soft-
ware, there are ten families, therefore we set Random-
ForestClassifier’s parameter “n_estimators” as 10. In
addition, we also used the train_test_split of sklearn
to divide the ransomware samples, and the size of the
test data is 30%. The accuracy of the classification
using the APIs’ frequencies as the feature quantities
is 99%. The experimental result indicates the APSs’
frequencies can be used as the feature quantity. Be-
cause of the characteristics of the OneVsRestClassi-
fier, after each classification, we outputted the API’s
contribution to classify the current family.
Figure 4: Confusion Matrix.
Evaluation to Classify Ransomware Variants based on Correlations between APIs
469
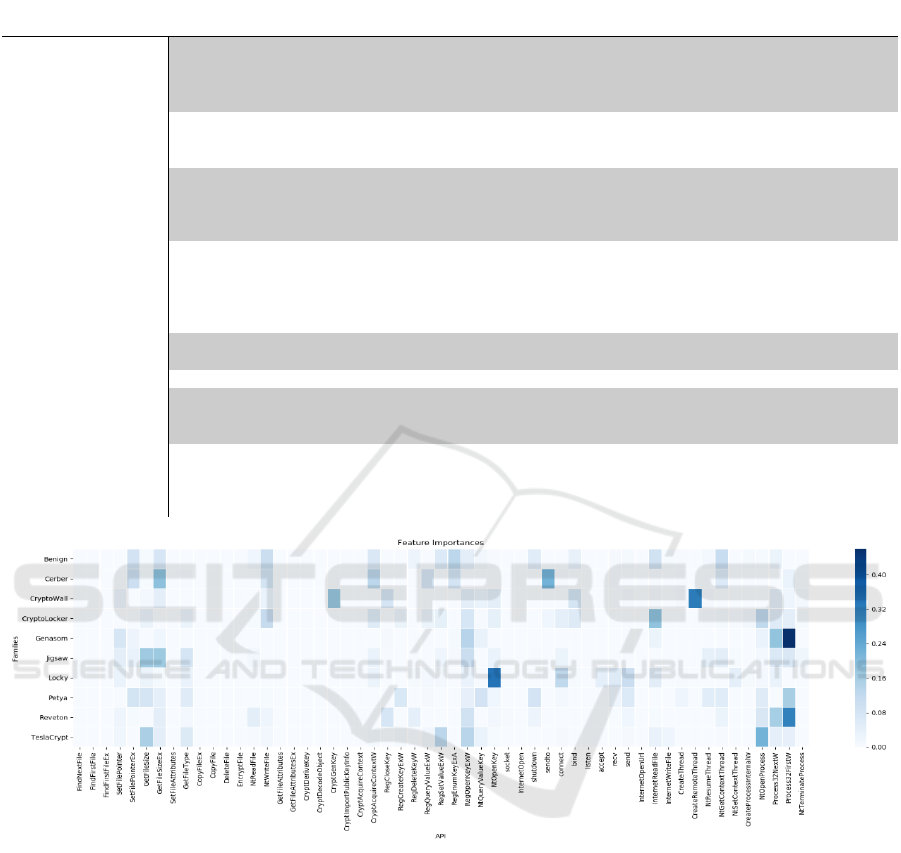
Table 5: Comparison with Related Works.
Feature extraction
methods
Classification method Feature analysis Accuracy achieved
(Medhat et al., 2018)
API functions, crypto-
graphic signatures, file
keywords, file exten-
sions
Novel framework based
YARA
Yara rule and fea-
ture thresholds
groups
94.14%
(Islam et al., 2013)
Dynamic feature set
(API calls) and static
features
Multiple classifier
Integrated feature
set
97.4%
(Kakisim et al., 2019)
API call, usage system
library and file opera-
tion
Decision Tree, Random
Forest, SVM, Hidden Mar-
kov Model
Dynamic features
HMM:93.38%(API-Bigram)
USL-Bigram+FS;
J48:100% RF:100%
SVM:100%
(Stiborek et al., 2018)
Similarity between file
paths, network traffic,
mutex names, registry
names, clustering of re-
source names
Machine learning based
Multiple instance learning
Interactions with
the operating sys-
tem and network
resources
RF:94.3%
Linear SVM:94.4%
MLP: 93.8%
(Kolosnjaji et al.,
2016)
System calls ConvNet+LSTM API usage 89.4%
(Liu & Wang, 2019) API sequences BLSTM API usage 97.85%
(Nunes, Burnap,
Rana, Reinecke, &
Lloyd, 2019)
API call and other dy-
namic features, static
features
Machine Learning
Dynamic and static
features
AdaBoost Classifier:93.84%
Proposed Method
Correlation between
API groups
Linear SVM
Quantify activities
relationship, the
importance of each
APIs
98.2%
Figure 5: Feature Importances.
The importance (contribution) of each API to
classify ransomware families is shown in Figure 5.
The color depth represents the level of contribution.
The darker the color, the higher the contribution. For
example, the “Process32Firstw” has a great impact on
the classification of Genasom, but it has less effect on
the Reveton. Likewise, although “NtOpenKey” has a
great impact on the Locky, it has little effect on the
Genasom, and so on. From the experimental results
shown in Table 4 and the confusion matrix shown in
Figure 4, we figured out the reason for the proposed
method misclassified the Cerber, CryptoWall, Tes-
laCrypt as the benign, the Jigsaw as the CryptoLocker
and the Petya as the Locky. Firstly, because of the
“SetFeilePointerEx”, “NtWriteFile”, “Cryp-
toAcquireContextW”, “RegEnumKeyExA”, and
“NTGetContextThread” made the almost same af-
fection on classification. For CryptoWall, the reason
for misclassification is that “GetFileSizeEx”,
“RegOpenKeyExW”, “bind”, “Process32NextW”
have made the almost same affection on classification.
And for TeslaCrypt, “GetFileSizeEx”,
“RegOpenKeyExW”, “InternetReadFile” have made
the almost same affection on classification. For the
same reason misclassified the Petya as the Locky be-
cause of the “GetFileType”, “RegOpenKeyExW”,
and “send” made the almost same affection on the
ICISSP 2020 - 6th International Conference on Information Systems Security and Privacy
470

classification. Finally, misclassified the Jigsaw as the
CryptoLocker because of “RegSetValueExW”,
“RegOpenKeyExW”, “NtOpenKey”, “connect”,
“Process3
2NextW”, “Process32FirstW” have the al-
most same affection on classification. From the re-
sults, as can be seen, the APIs that affect the classifi-
cation of each ransomware family is different. There-
fore, we can select APIs which have a great effect on
the classification of the ransomware family by the fig-
ure shown in Figure 5 when we want to propose a
method to detect or classify the ransomware.
But our proposed method has weaknesses that by
calling useless APIs to change the ransomware be-
havior pattern. We rely on the correlation coefficient
between API groups to classify ransomware variants,
so if the ransomware maker deliberately calls a large
number of useless APIs, the accuracy of our proposed
method will be greatly reduced. For example, as
shown in Figure 1, CryptoLocker and Jigsaw’s FC
and FS values are very similar. In this case, if an at-
tacker calls a large number of file-related APIs, then
our proposed method will be difficult to classify
CryptoLocker and Jigsaw.
7 CONCLUSION
In this study, we proposed a method for extracting the
calling frequency of an API from a report generated
by the dynamic analysis of the ransomware, obtaining
Pearson correlation coefficients, using them as fea-
ture quantities and then classifying the ransomware
via SVM. effective. We also found that it was possi-
ble to determine the types of APIs that influence the
classification of each ransomware family, and it is
thought that this capability could reduce the analysis
time required by other ransomware researchers.
As additional future tasks, we intend to explore
more features and samples and use them to improve
our proposed method.
REFERENCES
Check Point Software Technologies Ltd (2018, Sept). 2018
Information Security Report: Future Cyber Security.
Retrieved from http://www.checkpoint.co.jp/re-
sources/cyber-security-report-2018/2018-security-re-
port-web_Low-Reso.pdf.
Pearson, K. (1895). Notes on Regression and Inheritance in
the Case of Two Parents Proceedings of the Royal So-
ciety of London, 58, 240-242.
Scipy.org (2010, Oct.). Retrieved from
https://docs.scipy.org/doc/numpy/.
Anderson, B., Storlie, C., & Lane, T. (2012). Improving
malware classification: Bridging the static/dynamic
gap. Proceedings of the ACM Conference on Computer
and Communications Security, 3–14.
https://doi.org/10.1145/2381896.2381900
Alazab, M., Venkataraman, S., & Watters, P. (2010).
Towards understanding malware behaviour by the
extraction of API calls. Proceedings - 2nd Cybercrime
and Trustworthy Computing Workshop, CTC 2010, 52–
59. https://doi.org/10.1109/CTC.2010.8
Chandramohan, M., Tan, H. B. K., Briand, L. C., Shar, L.
K., & Padmanabhuni, B. M. (2013). A scalable
approach for malware detection through bounded
feature space behavior modeling. 2013 28th IEEE/ACM
International Conference on Automated Software
Engineering, ASE 2013 - Proceedings.
https://doi.org/10.1109/ASE.2013.6693090
Dahl, G. E., Stokes, J. W., Deng, L., & Yu, D. (2013).
Large-scale malware classification using random
projections and neural networks. ICASSP, IEEE
International Conference on Acoustics, Speech and
Signal Processing - Proceedings, 3422–3426.
https://doi.org/10.1109/ICASSP.2013.6638293
EE Osuna. (1998). Support Vector Machine:Training and
Application. Doctoral Dissertation, Massachusetts
Institue of Technology.
Galal, H. S., Mahdy, Y. B., & Atiea, M. A. (2016).
Behavior-based features model for malware detection.
Journal of Computer Virology and Hacking
Techniques. https://doi.org/10.1007/s11416-015-0244-
0
Gandotra, E., Bansal, D., & Sofat, S. (2014). Malware
Analysis and Classification: A Survey. Journal of
Information Security, 05(02), 56–64.
https://doi.org/10.4236/jis.2014.52006
Hampton, N., Baig, Z., & Zeadally, S. (2018). Ransomware
behavioural analysis on windows platforms. Journal of
Information Security and Applications, 40, 44–51.
https://doi.org/10.1016/j.jisa.2018.02.008
Hull, G., John, H., & Arief, B. (2019). Ransomware
deployment methods and analysis: views from a
predictive model and human responses. Crime Science,
8(1). https://doi.org/10.1186/s40163-019-0097-9
Idika, N., & Mathur, A. P. (2007). A Survey of Malware
Detection Techniques. Purdue University, 48, 2.
Islam, R., Tian, R., Batten, L. M., & Versteeg, S. (2013).
Classification of malware based on integrated static and
dynamic features. Journal of Network and Computer
Applications, 36(2), 646–656.
https://doi.org/10.1016/j.jnca.2012.10.004
Jung, S., & Won, Y. (2018). Ransomware detection method
based on context-aware entropy analysis. Soft
Computing, 22(20), 6731–6740. https://doi.org/
10.1007/s00500-018-3257-z
Kakisim, A. G., Nar, M., Carkaci, N., & Sogukpinar, I.
(2019). Analysis and evaluation of dynamic feature-
based malware detection methods. Lecture Notes in
Computer Science (Including Subseries Lecture Notes
in Artificial Intelligence and Lecture Notes in
Evaluation to Classify Ransomware Variants based on Correlations between APIs
471

Bioinformatics), 11359 LNCS, 247–258.
https://doi.org/10.1007/978-3-030-12942-2_19
Kolosnjaji, B., Zarras, A., Webster, G., & Eckert, C. (2016).
Deep learning for classification of malware system call
sequences. Lecture Notes in Computer Science
(Including Subseries Lecture Notes in Artificial
Intelligence and Lecture Notes in Bioinformatics), 9992
LNAI, 137–149. https://doi.org/10.1007/978-3-319-
50127-7_11.
Liu, Y., & Wang, Y. (2019). A robust malware detection
system using deep learning on API calls. Proceedings
of 2019 IEEE 3rd Information Technology,
Networking, Electronic and Automation Control
Conference, ITNEC 2019, (Itnec), 1456–1460.
https://doi.org/10.1109/ITNEC.2019.8728992
Medhat, M., Gaber, S., & Abdelbaki, N. (2018). A New
Static-Based Framework for Ransomware Detection.
2018 IEEE 16th Intl Conf on Dependable, Autonomic
and Secure Computing, 16th Intl Conf on Pervasive
Intelligence and Computing, 4th Intl Conf on Big Data
Intelligence and Computing and Cyber Science and
Technology Congress (DASC/PiCom/DataCom/
CyberSciTech), 710–715. https://doi.org/10.1109/
DASC/PiCom/DataCom/CyberSciTec.2018.00124
Moser, A., Kruegel, C., & Kirda, E. (2007). Limits of static
analysis for malware detection. Proceedings - Annual
Computer Security Applications Conference, ACSAC.
https://doi.org/10.1109/ACSAC.2007.21
Naval, S., Laxmi, V., Rajarajan, M., Gaur, M. S., & Conti,
M. (2015). Employing Program Semantics for Malware
Detection. IEEE Transactions on Information
Forensics and Security. https://doi.org/10.1109/
TIFS.2015.2469253.
Nunes, M., Burnap, P., Rana, O., Reinecke, P., & Lloyd, K.
(2019). Getting to the root of the problem: A detailed
comparison of kernel and user level data for dynamic
malware analysis. Journal of Information Security and
Applications, 48, 102365. https://doi.org/10.1016/
j.jisa.2019.102365
Santos, I., Devesa, J., Brezo, F., Nieves, J., & Bringas, P.
G. (2013). OPEM: A static-dynamic approach for
machine-learning-based malware detection. Advances
in Intelligent Systems and Computing. https://doi.org/
10.1007/978-3-642-33018-6_28
Seideman, J. D., Khan, B., & Vargas, A. C. (2014).
Identifying malware genera using the Jensen-Shannon
distance between system call traces. Proceedings of the
9th IEEE International Conference on Malicious and
Unwanted Software, MALCON 2014. https://doi.org/
10.1109/MALWARE.2014.6999409
Shankarapani, M., Kancherla, K., Ramammoorthy, S.,
Movva, R., & Mukkamala, S. (2010). Kernel machines
for malware classification and similarity analysis.
Proceedings of the International Joint Conference on
Neural Networks. https://doi.org/10.1109/IJCNN.2010.
5596339
Sihwail, R., Omar, K., & Ariffin, K. A. Z. (2018). A survey
on malware analysis techniques: Static, dynamic,
hybrid and memory analysis. International Journal on
Advanced Science, Engineering and Information
Technology, 8(4–2), 1662–1671.
Stiborek, J., Pevný, T., & Rehák, M. (2018). Multiple
instance learning for malware classification. Expert
Systems with Applications
, 93, 346–357.
https://doi.org/10.1016/j.eswa.2017.10.036
Subedi, K. P., Budhathoki, D. R., & Dasgupta, D. (2018).
Forensic analysis of ransomware families using static
and dynamic analysis. Proceedings - 2018 IEEE
Symposium on Security and Privacy Workshops, SPW
2018, 180–185. https://doi.org/10.1109/SPW.2018.
00033
Zhang, H., Xiao, X., Mercaldo, F., Ni, S., Martinelli, F., &
Sangaiah, A. K. (2019). Classification of ransomware
families with machine learning based on N-gram of
opcodes. Future Generation Computer Systems, 90,
211–221. https://doi.org/10.1016/j.future.2018.07.052
Cuckoo Sandbox (2012, April 24). Retrieved from
https://cuckoosandbox.org/.
scikit-learn (2008, Aug. 20). Retrieved from https://scikit-
learn.org/stable/
Hybrid-Analysis (2013, May 18). Retrieved from
https://www.hybrid-analysis.com/.
Virusshare (2007 March 5). Retrieved from https://virussh-
are.com/.
Virusign (2014 Jan. 6). Retrieved from https://www.vi-
rusign.com/.
theZoo (2015, Aug. 5). Retrieved from
https://github.com/ytisf/theZoo.
ICISSP 2020 - 6th International Conference on Information Systems Security and Privacy
472
