
Visual-auditory Volume Rendering of Dynamic Quantum Chemistry
Molecular Fields
Evgeniya Malikova
1
, Valery Adzhiev
1
, Oleg Fryazinov
1
and Alexander Pasko
1,2
1
Bournemouth University, Bournemouth, U.K.
2
Skolkovo Institute of Science and Technology, Moscow, Russia
Keywords:
Volume Rendering, Visual-auditory Ray-casting, Signed Distance Fields, Multi-scale Visualisation, Molecular
Visualisation.
Abstract:
This work deals with a visual-auditory visualisation of dynamic heterogeneous objects represented by contin-
uous scalar fields obtained from quantum chemistry. The research concentrates on complex phenomena mod-
elling and rendering aspects and takes advantage of GPU implementation. The approach uses the constructive
HyperVolume for the multi-scale representation of the molecular phenomena. To propose an approach to the
visual-auditory rendering, we adapt the real-time interactive volume ray-casting to compute the optical and
auditory properties. We demonstrate the approach application for the visual-auditory rendering of dynamic
molecular structures.
1 INTRODUCTION
As computer simulations or experimental studies are
involved, scalar fields are used in many research areas
such as computational chemistry, medical data anal-
ysis and physical phenomena studies. We consider
an example of the analysis of the molecular struc-
tures that are dynamic objects with internal properties
and geometry changing in time. As the detailed and
accurate study of the properties of molecular struc-
ture can be computationally expensive, the analysis
of the molecular structures benefits from simultane-
ous use of representations of various objects’ prop-
erties (Wahle and Wriggers, 2015) that are obtained
with different computational procedures. We consider
a particular case study of dynamic molecular struc-
tures obtained by the quantum chemistry simulation.
The modelling, rendering and visual analysis of
such multi-scale representations of the phenomena
are not straightforward. In Volume Rendering the
problem is addressed with the use of Multidimen-
sional Transfer Functions (TF) (Kniss et al., 2003)
and optical models with complex object-light interac-
tions (Wahle and Wriggers, 2015). Those techniques
are used to improve the quality of visual analysis and
to highlight features of interest. However, limitations
of the visual perception can not be avoided solely with
the enhancement of the optical model. The visual
system can be overloaded and perturbed due to the
fatigue of the user. An introduction of auditory sen-
sory stimuli is a well-known technique that is used to
address a problem of visual analysis limitations (Her-
mann et al., 2011). For scalar data analysis problem,
the works (Lodha et al., 1997) and (Gionfrida and Ro-
ginska, 2017) introduce the auditory analysis to ad-
dress the problems, where the visual analysis fails.
We suggest a simultaneous visual-auditory analy-
sis as a tool to address a problem of molecular struc-
tures complexity for a particular problem of the re-
sults of quantum chemistry problem study. The main
contributions of this work are the following:
1. We propose a unified approach to the visual-
auditory study of the physical phenomena the
molecular fields based on ray-casting.
2. We take advantage of HyperVolume (HV)
(Pasko et al., 2001) model for scene representa-
tion as a dynamic heterogeneous object with vi-
sual and auditory properties.
3. We consider the case study of the molecular struc-
ture, that is a result of quantum simulation, to per-
form simultaneous visual-auditory analysis to get
insight into the multi-scale representation of the
phenomena.
We demonstrate how the GPU implementation of the
constructive approach for HV scene can be used to ef-
ficiently perform simultaneous visual-auditory analy-
sis on the base of the ray-casting procedure.
Malikova, E., Adzhiev, V., Fryazinov, O. and Pasko, A.
Visual-auditory Volume Rendering of Dynamic Quantum Chemistry Molecular Fields.
DOI: 10.5220/0008957001930200
In Proceedings of the 15th International Joint Conference on Computer Vision, Imaging and Computer Graphics Theory and Applications (VISIGRAPP 2020) - Volume 3: IVAPP, pages
193-200
ISBN: 978-989-758-402-2; ISSN: 2184-4321
Copyright
c
2022 by SCITEPRESS – Science and Technology Publications, Lda. All rights reserved
193
2 BACKGROUND AND RELATED
WORKS
2.1 Volume Rendering of Scalar Fields
A scalar field is a mapping f : x → ℜ,x ∈ ℜ
n
, which
associates any point in space with a scalar value. Vi-
sualisation of scalar fields usually employs Volume
Rendering technique that operates the initial data as
volumes that are stored in the texture memory.
The conventional Volume Rendering scheme sug-
gests the volume boundary (or scalar field domain)
is defined by a bounding box. The ray/volume inter-
section is computed to define the ray’s start and end
points and after the equations 1,2 are solved with the
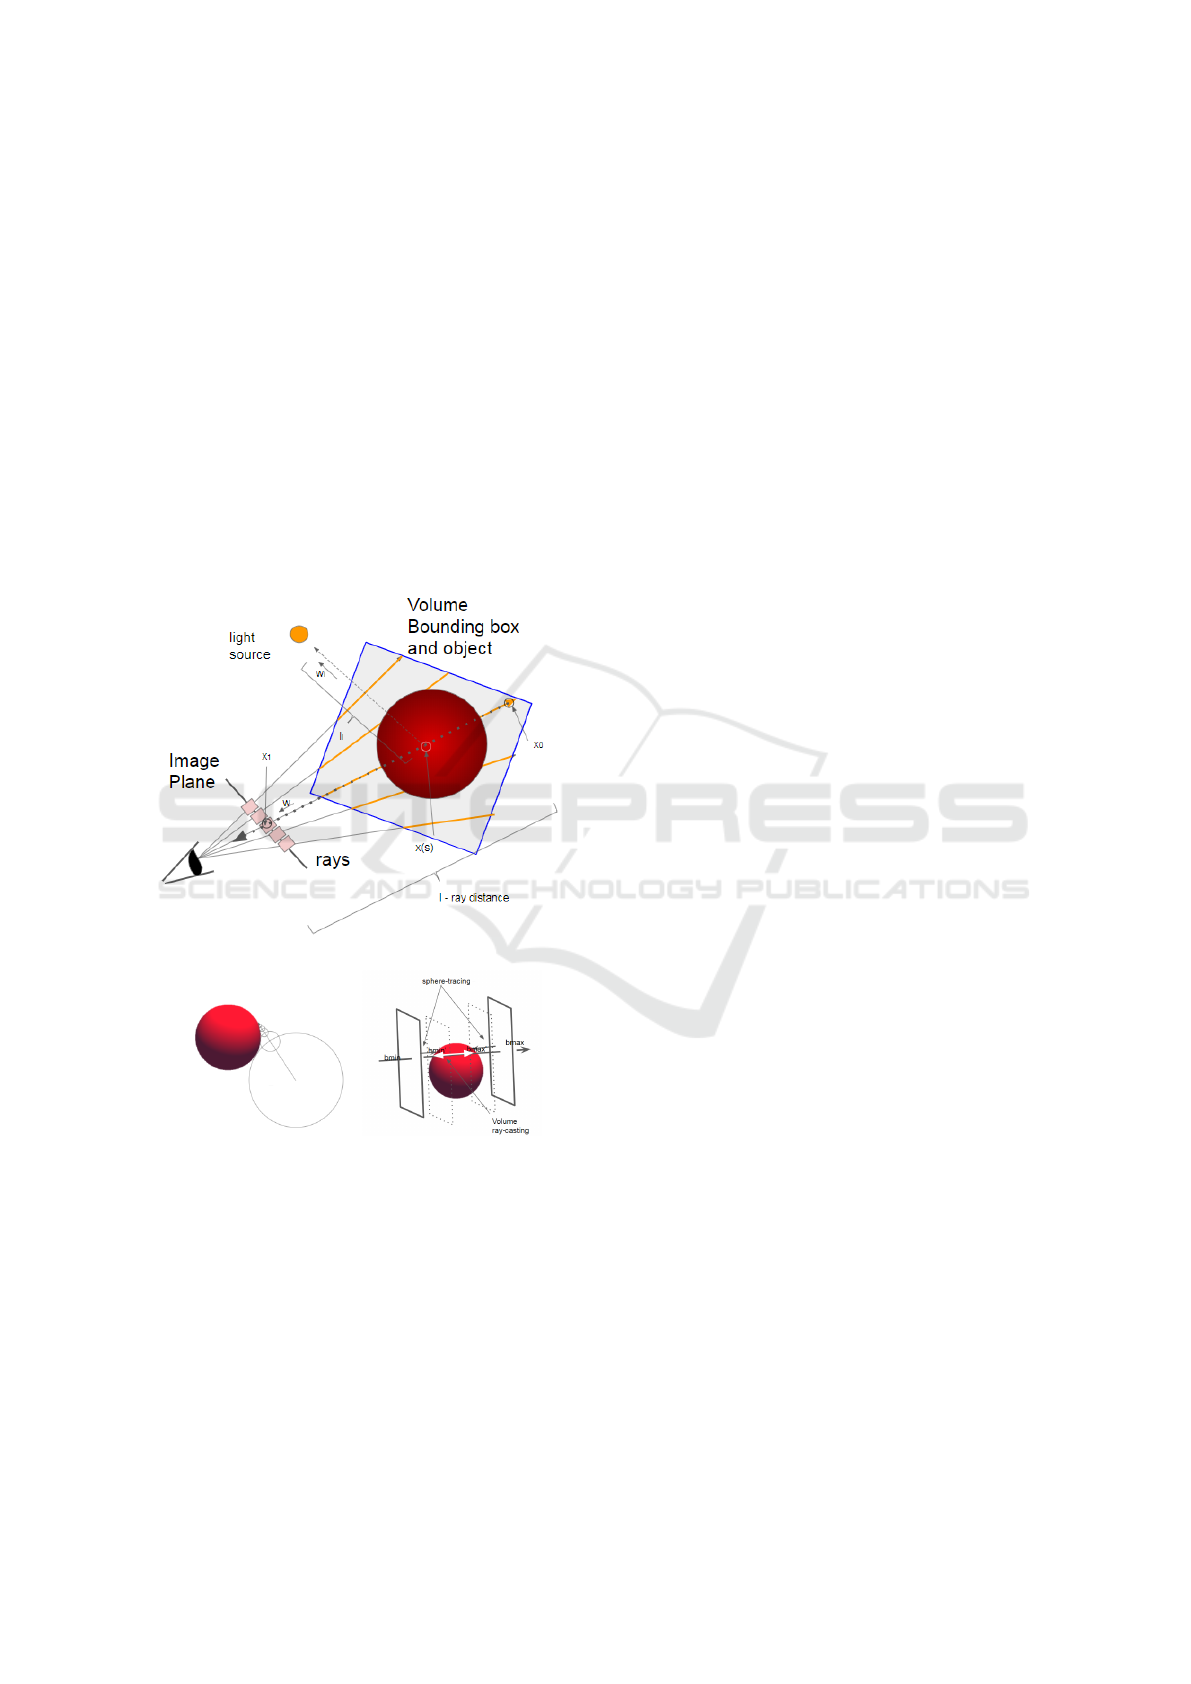
ray-marching procedure (Fig. 1 (a)).
(a)
(b) (c)
Figure 1: Volume Rendering a) Schematic representation of
basic ray tracing for Volume rendering; b) Sphere-tracing
scheme (Hart, 1996); c) SDF accelerated Volume Rendering
on basis of sphere-tracing scheme.
In Volume Rendering a simple model of light in-
teraction with an object considers only emission and
absorption (J
¨
onsson et al., 2014):
L(~x
1
,
~
ω ) = T (~x
0
,~x
1
)L(~x
0
,
~
ω )+
Z
~x
1
~x
0
T (~x
s
,~x
1
)E(~x
s
)d~x
s
(1)
where L(~x
1
,
~
ω ) is an intensity at the point x
1
;
T (~x
s
,~x
1
) = e
−
R
~x
1
~x
s
σ
t
(~x )d~x
is an attenuation of light
as it travels from the point x
s
to x
1
defined in the
general case by an extinction coefficient σ
t
(~x
1
) =
σ
a
(~x
1
) + σ
s
(~x
1
) that takes into account absorption
and scattering (not considered in this model); E(~x
s
)
is a light contribution at the point x
s
, in other words,
the term describing emission process that can be writ-
ten as σ
a
(~x
s
) ∗ L
e
(~x
s
,
~
ω ).
The extended equation takes into account a single
light scattering (Max and Chen, 2010) and is also con-
sidered for an interactive Volume Rendering (J
¨
onsson
et al., 2014):
L(~x
1
,
~
ω) = T (~x
0
,~x
1
)L(~x
0
,
~
ω)+
Z
~x
1
~x
0
(σ
a
(~x
s
) ∗ L
e
(~x
s
+ σ
s
(~x
s
)∗
L
ss
(~x
s
,
~
ω))T (~x
s
,~x
1
))d~x
s
(2)
where L
ss
(~x
s
,
~
ω) represents the scattered radiance in
the direction
~
ω.
The shading and depth perception can provide an
addition to 3D shape cues and thus enhance visual
analysis and highlight the features of interest (Kniss
et al., 2003). The Blinn-Phong model (Levoy, 1988)
was an initial enhancement of the classical emission-
absorption model 1. This model is widely used in Vol-
ume Rendering to highlight features of interest such
as edges (J
¨
onsson et al., 2014), although it was de-
signed for shading the surfaces and can produce dark
regions (Kniss et al., 2003).
Complex optical model computation like in the
equation 2 allows to significantly enhance visual anal-
ysis quality (Wahle and Wriggers, 2015), however,
are still computationally expensive (J
¨
onsson et al.,
2014) for the interactive and dynamic Volume Ren-
dering.
Computation of complex optical models for in-
teractive Volume Rendering takes advantage of mod-
ern graphics hardware (Schlegel et al., 2011). The
modern algorithms often employ the idea of splitting
the optical model computation into separate parts,
mainly concerned with the lighting conditions that
can be precomputed into textures independently and
updated on-demand (Kniss et al., 2003), (Schlegel
et al., 2011).
The other tool to address the complexity of stud-
ied phenomena in Volume Rendering is the Multidi-
mensional Transfer Function (TF) (Kniss et al., 2003).
TFs are used to address a problem of simultaneous
visual analysis of more complex objects represented
with two and more scalar fields describing various
object properties. In this research, we consider a
distance-based TF in Volume Rendering that high-
IVAPP 2020 - 11th International Conference on Information Visualization Theory and Applications
194

lights features of interest mostly determined by the
distance to reference structures (Tappenbeck et al.,
2006). Those type of TFs takes advantage of Signed
Signed Distance Field (SDF).
The Signed Distance Field (SDF) is a type of a
scalar field, where the scalar value takes the value of
a distance to the surface dS of a solid object S(Jones
et al., 2006). The distance property of SDF allows for
efficient ray-casting (Hart, 1996) and efficient compu-
tation of complex light-object interactions in optical
model. Moreover, in this research, we will take ad-
vantage of the GPU implementation of the construc-
tive approach for the entire dynamic volume scene
modelling (Wang et al., 2011) based on SDF.
2.2 Auditory Properties
The auditory model often takes advantage of simi-
larities in light and sound propagation (Takala and
Hahn, 1992). The acoustic rendering equation (Sil-
tanen et al., 2007) is a time-dependent version of the
general rendering equation (Kajiya, 1986) that is a
basis of the optical Volume Rendering models (Max
and Chen, 2010). The sound propagation and au-
ditory perception of this process to model auditory
feedback (McArthur et al., 2017) are open research
areas in augmented (Ribeiro et al., 2012) and virtual
(Begault, 1994) reality. Auditory stimuli are well-
known tools in molecular structures interactive study
(Liu and van der Heide, 2019) that is often consid-
ered as an alternative to haptic ones in the traditional
area of their application. The reason is that it does not
have to deal with haptic device limitations and allows
for mapping and perception of a much wider range of
properties (May et al., 2019).
The auditory study of volumetric structures as a
part of data analysis is an open research area (Gion-
frida and Roginska, 2017), (Malikova et al., 2019).
The interpretation of sound parameters for the au-
ditory analysis and control of the auditory represen-
tation of the phenomena can be not straightforward
(Hermann, 2018). Thus, the research in the area
mostly deals with the design of auditory mapping pro-
cedures for specific applications (Gionfrida and Ro-
ginska, 2017).
In this work, we take advantage of similarities in
the light and sound propagation to introduce an audi-
tory model based on sound wave generation as a result
of impulse propagation through the object. Thus, we
consider the ray-tracing technique for the simultane-
ous visual-auditory rendering of multi-scale phenom-
ena.
We discuss auditory feedback as distance-based
guidance or measurement procedure. For such pro-
cedures design, we consider the physical process
of sound propagation. Thus, the proposed auditory
model allows natural perception and interpretation of
the distance-dependent aspects of objects-sound wave
interaction. An auditory guidance procedure can be
used to inform of the spatial orientation and position
while interacting with virtual objects. A measurement
procedure allows tracking of small changes in fea-
tures of dynamic phenomena. As the visual system
can be fully engaged while performing a complex per-
ception task, the additional source of information pro-
vided through other sensory stimuli is needed (Hou
and Sourina, 2011). Thus, such auditory procedures
are quite important.
The conceptual framework for the introduced pro-
cedures is based on sound propagation the digital
waveguide approach to physically-based sound syn-
thesis (Cook, 2002). We consider the use of a basic
plucked string (Smith, 1992) model that allows au-
ditory tracking of even the small changes in the dis-
tance of sound propagation with a pitch characteristic
of sound.
3 OUR APPROACH TO
VISUAL-AUDITORY ANALYSIS
OF MOLECULAR FIELDS
Let us consider the case of the molecular structure
that is a result of quantum simulation as the two main
models are used for the phenomena analysis. The
most common geometrical representation of molec-
ular structures is the ”Balls and Stick” model (Berg
et al., 2002) (Fig. 2) (a). The model suggests that
atoms are represented with spheres and atomic radii
and distance between atoms approximate bonds be-
tween atoms and their types. Despite these simpli-
fications, this model is good for measurements and
monitoring of distance-related parameters.
Another model arises from quantum chemistry
calculations and concentrates on the analysis of more
complex abstraction for the representation of the
molecular structure (Shusterman and Strauss, 2001)
that usually suggests the necessity of simultaneous
analysis of two scalar fields. The shape of the Elec-
tron density field is treated like molecule interaction
boundary as it defines a probability of an electron oc-
cupying an infinitesimal element of space surround-
ing any given point. At the same time, its topological
analyses provide a deeper understanding of bonding.
The Electrostatic potential field represents a charge
distribution, a property that allows predicting the be-
haviour of complex molecules. In the ideal case, the
Visual-auditory Volume Rendering of Dynamic Quantum Chemistry Molecular Fields
195
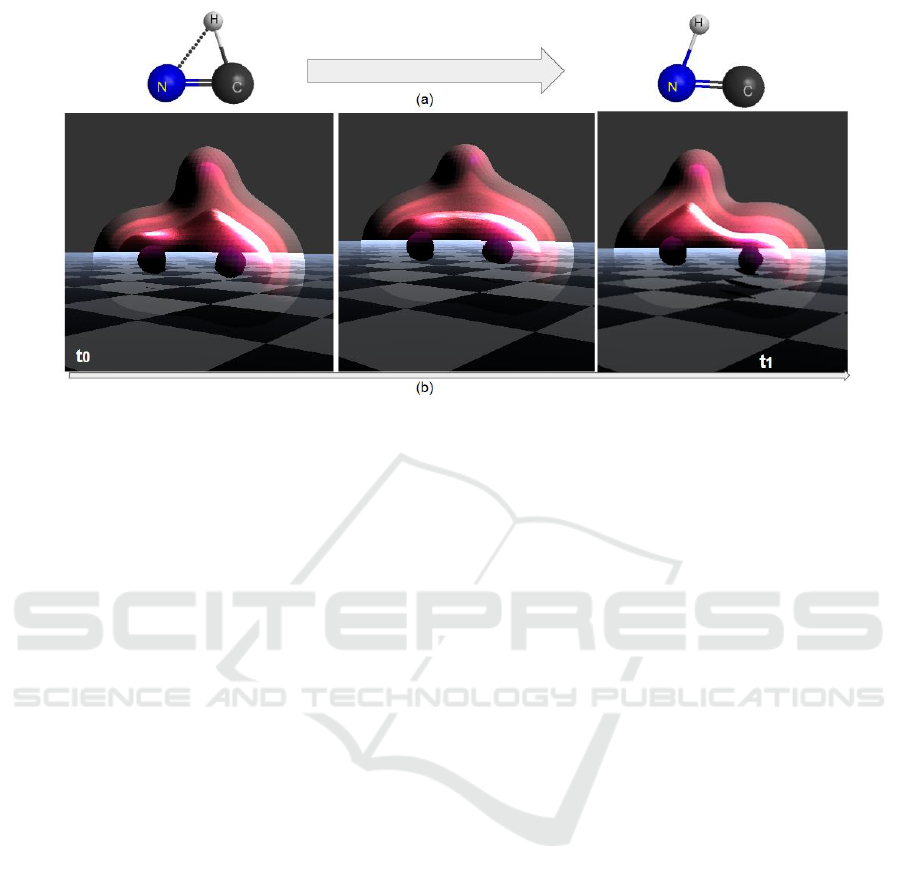
Figure 2: Selected frames of dynamic Volume Rendering of the chemical transformation from HCN to the HNC isomer. Balls
and Stick model (a) and quantum chemistry model (b).
user should be able to analyse both of those fields si-
multaneously (Shusterman and Strauss, 2001). Un-
like balls and sticks, this model allows for more ac-
curate analysis of the properties of a molecular phe-
nomenon such as bonding, although its computation
is expensive (see Fig. 2)(b)).
In our visual-auditory approach, we are employ-
ing both models in the analysis process keeping in
mind the dynamic nature of the phenomena. As a
case study, we analyse the dynamic reaction of the
transformation of HCN to the HNC isomer (see Fig.
2). We employ dynamic Volume Rendering for si-
multaneous visual analysis of changes in both scalar
fields of quantum chemistry model (see Fig. 2 (b)).
We consider the auditory analysis as a well-proven
tool for monitoring of small changes in dynamic char-
acteristics and employ it for simultaneous measure-
ments performed on the ”Balls and Stick” model (see
Fig. 2)(a). Below we will consider the HyperVol-
ume model for the multi-scale representation of the
phenomena and its further rendering to visual and au-
ditory stimuli.
3.1 HyperVolume Model
We use a HyperVolume (HV) model to describe a
studied phenomena through a tuple:
m(t) = (G(t),A
o
(t),A
s
(t)) : (F(X|t),S
o
(X|t), S
s
(X|t))
(3)
where G(t) is dynamic geometry described with func-
tion F(X|t); S
o
(X|t) and S
s
(X|t) are point attribute
functions S defining optical A
o
and auditory A
s
prop-
erties of heterogeneous object.
Thus, we define a vector-valued function. The first
component F is responsible for the object geometry
G. In our approach F is an SDF, which is obtained
from the input scalar field by using signed distance
transform (Jones et al., 2006). The auditory properties
in the form of the generated sound wave are defined
with S
s
(X) . The attribute S
o
(X) defines the results
of mapping to the optical properties such as colour
and opacity. Note that in the general case attributes S
are not scalars but vectors. For example, the colour
and transparency information in S
o
is normally repre-
sented as a four-component RGBA value.
In the case of the molecular structure, the dynamic
geometry G(t) is represented with electron density
field isosurface as it is interpreted as a molecule in-
teraction boundary. The optical model S
o
(X) is used
for visual analysis of the quantum chemistry phenom-
ena representation. The auditory model S
s
(X) is used
to judge about the dynamic change of measured char-
acteristics performed on the basic ”Ball and Sticks”
model. In this case study, we consider its use for bond
length measurement.
The SDF-based ray-tracing is used for dynamic
visual-auditory rendering of multi-scale objects. We
use the constructive approach for modelling S
o
(X|t)
and S
s
(X|t) attributes of dynamic object m(t) (Pasko
et al., 2001) with SDF based geometry representation
for F(X |t) and implement most of visual-auditory
analysis pipeline on GPU (see section 4). Below we
consider optical and auditory models in more detail.
IVAPP 2020 - 11th International Conference on Information Visualization Theory and Applications
196
3.2 Optical Model for Ray-casting
The main target of the optical model S
o
(X) in equa-
tion 3 is to allow the user getting insight into the
molecular phenomena through colour and opacity. To
address the problem of complex phenomena repre-
sented with two scalar fields (Electron density and
Electrostatic potential) visualisation, we propose a
custom distance-based TF, that operates those two
fields simultaneously. We consider optical models
described with equations 1 and 2 for visual analysis
quality enhancement.
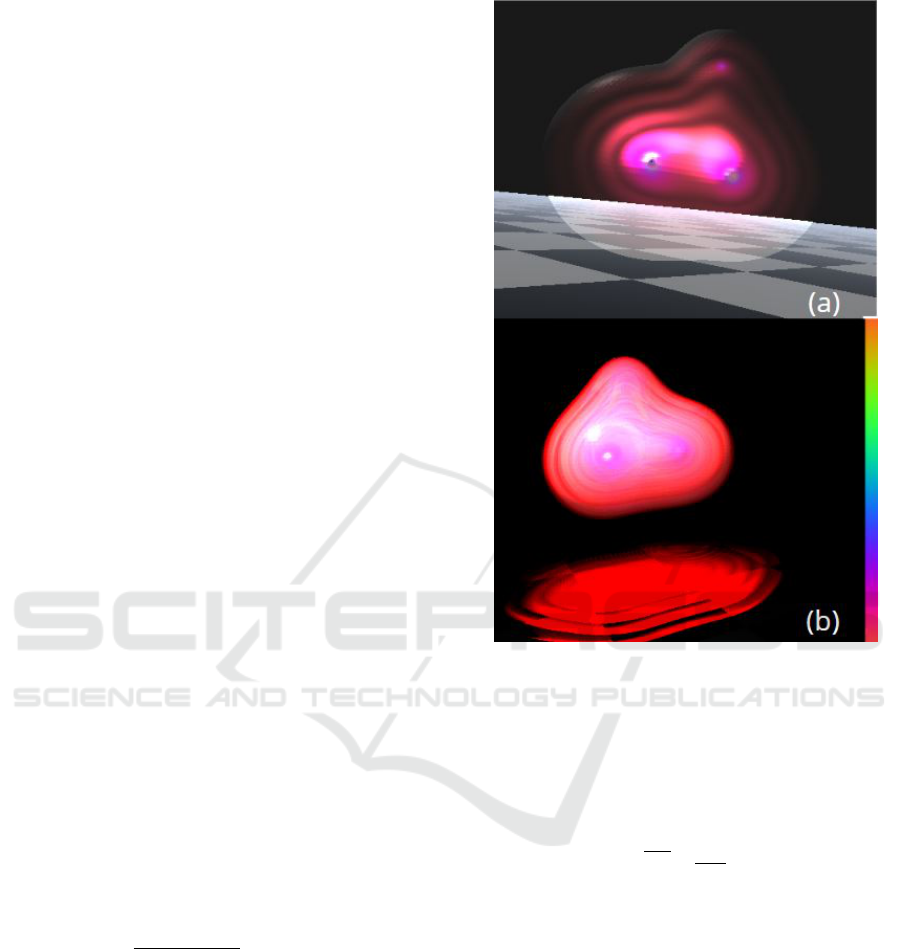
The emission-absorption 1 based S
o
(x) was not
particularly efficient. We had to adjust the trans-
parency value to handle dark regions that made the
model look like a set of coloured isosurfaces (see
Fig.3(a)). The single scattering with a colour blending
allowed assessing both changes of the Electron Den-
sity isosurface shape and the Electrostatic Potential
distribution (see Fig.3(b)).
The results of conventional Volume Rendering for
various models S
o
(x), we have suggested for HCN
molecule case study, are presented in Fig. 3. Below
we will describe the proposed distance-based TF. The
use of SDF allows for optical model accelerated com-
putation of lightning and scattering.
3.2.1 Transfer Function
To define a distance-based TF, we consider the Blinn-
Phong model and use the SDF object geometry defi-
nition. The proposed TF highlights the shape of Elec-
tron Density Field and to allows judging on the value
of the Electrostatic Potential Field. We employ the
specular and diffuse shading to provide highlights of
both scalar fields and especially closer to the ”atom”
regions.
As described in (Levoy, 1988), a numerical optical
model for colour at i-th voxel C
i
= C(x
i
) for a parallel
light source is:
C
i
= c
p
· k
a
+
c
p
k
1
+ k
2
· d(x
i
)
·
[k
d
(
~
N(x
i
) ·
~
L ) + k
s
(
~
N(x
i
) ·
~
H )
n
] (4)
where
~
N(x
i
) is a surface normal at voxel x
i
location,
~
L is a normalised vector in the direction of the light
source,
~
H is a normalised vector in the direction of
maximum highlight; c
p
is a component of colour par-
allel to the light source; k
1
,k
2
are constants used in
a linear approximation of the depth-queuing; d(x
i
) is
perpendicular distance from the picture plane to the
voxel location x
i
.
The ambient, diffuse, specular coefficients k
a
,k
d
,
k
s
are vary at different parts of the volume and are
Figure 3: Volume Rendering of the HCN molecule. Render-
ing with introduced TF and the following optical models: a)
without scattering; b) with basic single scattering.
controlled by the SDF value of the Electron Density
Field in order to highlight how colour is distributed on
selected isosurfaces. We multiply the opacity value
of the TF by the coefficient controlling the isosurface
highlight o
h
: o
h
= o
d(x
i
)
d
max
0
· |
d(x
i
)
d
max
· π · f |, where f is a
number of isosurfaces; d
max
is a maximum value of
the distance field; o
0
is a basic coefficient that is the
maximum o
h
value can take. If o
h
is greater than a
certain threshold value we apply surface shading with
k
s
and k
d
values equal to o
h
.
3.3 Auditory Model for Ray-casting
The proposed approach allows the visual-auditory
analysis of both quantum chemistry and ”Balls and
Sticks” representations. The optical property S
o
(X)
allows judging on phenomena through colour and
opacity. The sound perception has the potential to
provide a wider range of auditory entities for inter-
pretation such as pitch, volume, duration, rhythm, etc.
We employ the physical process of sound propaga-
Visual-auditory Volume Rendering of Dynamic Quantum Chemistry Molecular Fields
197
tion to directly construct a sound wave representation.
We consider the task of auditory analysis through the
pitch of the dynamic length changes in NC bond for
the dynamic chemical reaction of transformation from
the HCN to the HNC isomer.
The atoms of ”Balls and Sticks” model are repre-
sented as SDF spheres Sp
h
,Sp
c
,Sp
n
with sufficiently
small radii. We take advantage of an ideal string
model to render distance property of NC bond to
sound wave and judge about the bond length through
the pitch. The process is schematically presented in
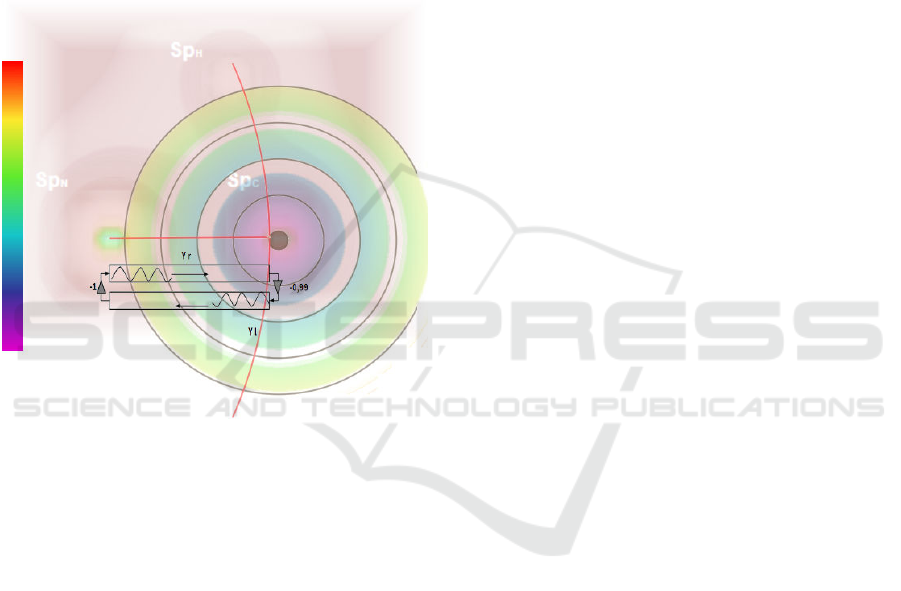
Fig. 4 and is described as follows.
Figure 4: Rendering to auditory stimuli. Schematic repre-
sentation of ray-casting the length of NC bond and mapping
it into the sound with the ideal string model.
We adapt the travelling wave solution for an ideal
plucked string (Smith, 1992) for introduced auditory
model. The result of an initial impulse of the plucked
string travelling wave y(x,t) can be represented as a
sum of the right going y
r
(x − ct) and left going y
l
(x +
ct) waves (see Fig. 4 (b)).
The travelling waves are simulated through the de-
lay lines. Once the initial waves are generated as a
result of a string picking, they travel along the string.
Thus, the time impulse needs to pass the distance till
it is reflected. The propagation process is aurally per-
ceived through the pitch: l = 2 ∗ R/p, where R is a
sampling rate, string length l and p is a perceived
pitch. We perform auditory analysis to judge on small
changes and we use the ray-casting procedure to com-
pute the sound wave.
4 IMPLEMENTATION
The HV model is described through a construction
tree. The leaves are initial scalar fields data loaded
to GPU memory as 3D textures, and the nodes are op-
erations similar to the initial idea presented in (Pasko
et al., 2001). The conventional TF is considered as
the ”node of operation” within the construction tree
of the HV model.
We take advantage of the modern CUDA graph
API (NVIDIA, 2019) to describe such construction
trees and render them to textures on-demand with the
updated parameters. The final 3D textures represent
the HV model m(t) and the lighting conditions. Those
textures are sampled during the conventional Volume
Rendering and auditory feedback computation (see
the example in Fig. 5). The GPU data flow model al-
lows integration of image processing techniques that
can be implemented as graph nodes applied to tex-
ture volumes with CUDA graph API. Currently, we
have considered a basic case of ”host” implementa-
tion with Image Processing Toolkit (ITK) (Johnson
et al., 2015), to extract the centres of SDF spheres
Sp
h
,Sp
c
,Sp
n
that represent the atoms of the molecule
from scalar fields.
The final visual-auditory scene is presented as a
set of objects S = (HV,SDF
o
,L), where HV are Hy-
perVolume representations in a form of a tuple de-
scribed above; SDF
o
is a set of the SDF geometry in
the scene; L are the precomputed lighting conditions
for the scene. This representation naively supports
further extension with interactive procedures that pro-
vide auditory feedback. The further extension can be
introduced on the same basis of SDF geometry mod-
elling and ray tracing.
The different parts of the scene in Fig. 5 repre-
sentation are evaluated in advance, stored as textures
and updated on-demand (see section 2.1 for details).
The proposed approach handles the rendering of both
surfaces and volume objects in a similar way. Thus,
the entire scene is procedurally modelled, stored and
rendered on GPU. Below we describe the obtained re-
sults for dynamic visual-auditory molecular phenom-
ena study.
5 RESULTS
We analyse the dynamic reaction of the transforma-
tion of HCN to the HNC isomer (see Fig. 2) through
the obtained visual-auditory image of the phenomena.
The initial data is a sample data from the GAMESS
software package (M.W.Schmidt et al., 1993) that de-
scribes an HCN initial saddle point state before the
IVAPP 2020 - 11th International Conference on Information Visualization Theory and Applications
198
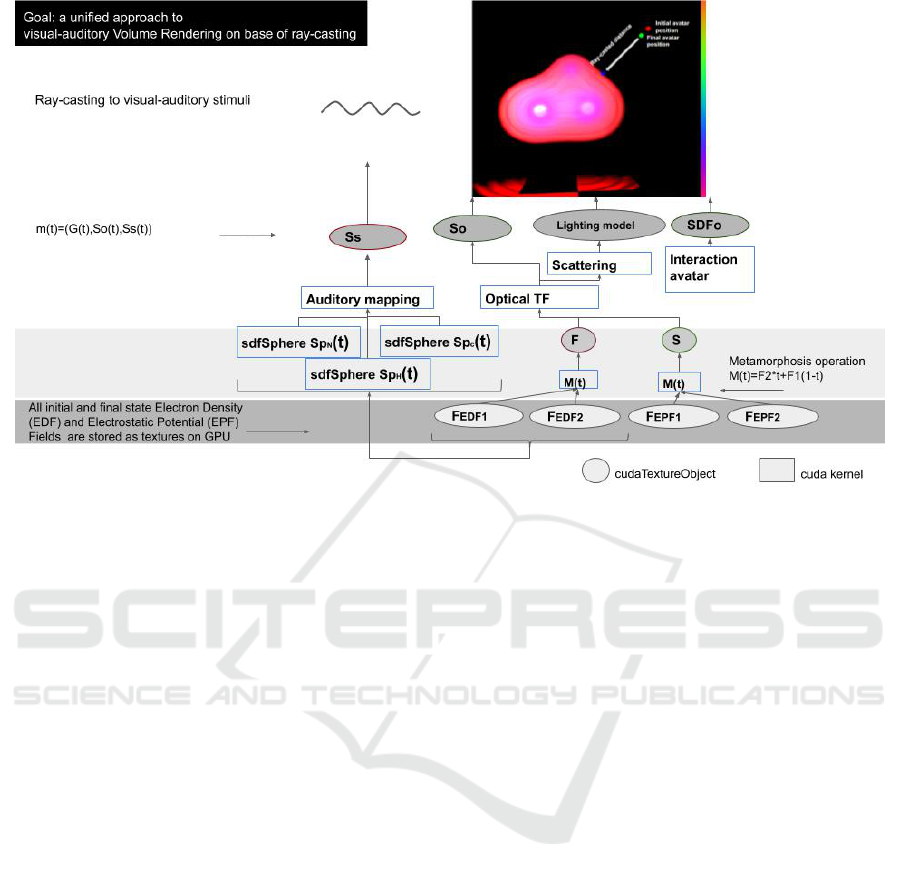
Figure 5: The CUDA implementation scheme of the HyperVolume model construction tree for the the process of HCN to the
HNC isomer reaction.
HNC isomer reaction and the final state - HNC iso-
mer (see Fig.2(a,b)). The results of visual-auditory
rendering are presented in the accompanying video.
We use the auditory feedback for measurements per-
formed on the molecular structure.
As an example, we use it to highlight a process
of small changes of CN bond length in HNC iso-
mer reaction dynamic process (Fig. 2(a)) and judge
about the dynamic change of distance through the
pitch. The process is schematically presented in Fig.
4 (b). The pitch changes from lower to higher values
as the distance becomes smaller. At the same time,
we judge visually on dynamic change within quantum
chemistry representation of the molecular phenomena
through the dynamic Volume Rendering.
6 CONCLUSIONS AND
DISCUSSION
This paper presents a novel approach to the scientific
visualisation of complex physical phenomena such as
dynamic molecular fields based on the visual-auditory
Volume Rendering. The proposed solution is based
on the techniques used for multi-scale, heterogeneous
objects modelling and rendering. The main features
of the approach are HyperVolume model for visual-
auditory scene representation and ray-casting to vi-
sual and auditory stimuli.
We have addressed a particular problem of anal-
ysis of molecular fields that are results of quantum
chemistry simulation. Taking this case study as an ex-
ample, we have demonstrated how the visual-auditory
analysis based on the presented approach can be used
to get insight into dynamic multi-scale phenomena as
solely visual analysis can be challenging. We have
implemented our approach on GPU, demonstrated its
flexibility and considered the representative case stud-
ies. The approach allows GPU data flow for visual-
auditory Volume Rendering.
The SDF technique has applications in image pro-
cessing tasks and is an essential part of computa-
tionally expensive interactive procedures, like colli-
sion detection. The proposed approach has the poten-
tial to combine the heterogeneous objects modelling
procedures and the conventional image processing on
GPU. The proposed approach further extension will
also consider the interactive visual-auditory rendering
tasks that target the enhancement of molecule editing
and other interactive exploration procedures.
So far we have considered the basic optical model
and have taken into account only single scattering.
Rendering of more complex auditory and optical
models is the area of future research. Exploring multi-
scale object shapes and internal properties through the
perception of the spatial 3D sound is on our agenda.
Visual-auditory Volume Rendering of Dynamic Quantum Chemistry Molecular Fields
199

REFERENCES
Begault, D. R. (1994). 3D Sound for Virtual Reality and
Multimedia. Academic Press Professional, Inc., San
Diego, CA, USA.
Berg, J. M., Tymoczko, J. L., and Stryer, L. (2002). Ap-
pendix: Depicting Molecular Structures. New York:
W. H. Freeman.
Cook, P. R. (2002). Real Sound Synthesis for Interactive
Applications. A. K. Peters, Ltd., Natick, MA, USA.
Gionfrida, L. and Roginska, A. (2017). A novel sonifica-
tion approach to support the diagnosis of alzheimer’s
dementia. Frontiers in Neurology, 8:647.
Hart, J. C. (1996). Sphere tracing: a geometric method for
the antialiased ray tracing of implicit surfaces. The
Visual Computer, 12(10):527–545.
Hermann, T. (2018). Wave space sonification. In ICAD
2018, pages 49–56.
Hermann, T., Hunt, A., and Neuhoff, J. G., editors (2011).
The Sonification Handbook. Logos Publishing House,
Berlin, Germany.
Hou, X. and Sourina, O. (2011). Six degree-of-freedom
haptic rendering for biomolecular docking. Transac-
tions on Computational Science, 12:98–117.
J
¨
onsson, D., Sund
´
en, E., Ynnerman, A., and Ropinski, T.
(2014). A survey of volumetric illumination tech-
niques for interactive volume rendering. Computer
Graphics Forum, 33(1):27–51.
Johnson, H. J., McCormick, M. M., and Ibanez, L. (2015).
The ITK Software Guide Book 1: Introduction and De-
velopment Guidelines - Volume 1. Kitware, Inc., USA.
Jones, M. W., Bærentzen, A., and
ˇ
Sr
´
amek, M. (2006). 3d
distance fields: A survey of techniques and applica-
tions. IEEE Transactions on Visualization and Com-
puter Graphics, 12(4):581–599.
Kajiya, J. T. (1986). The rendering equation. SIGGRAPH
Comput. Graph., 20(4):143–150.
Kniss, J., Premoze, S., Hansen, C., Shirley, P., and McPher-
son, A. (2003). A model for volume lighting and mod-
eling. IEEE Transactions on Visualization and Com-
puter Graphics, 9(2):150–162.
Levoy, M. (1988). Display of surfaces from volume data.
IEEE Comput. Graph. Appl., 8(3):29–37.
Liu, D. and van der Heide, E. (2019). Interactive auditory
navigation in molecular structures of amino acids: A
case study using multiple concurrent sound sources
representing nearby atoms. In ICAD 2019, Newcas-
tle upon Tyne, UK., pages 140–146. Georgia Institute
of Technology.
Lodha, S. K., Beahan, J., Heppe, T., Joseph, A. J., and Zane-
Ulman, B. (1997). Muse: A musical data sonifica-
tion toolkit. In ICAD1997, Palo Alto, California, page
36–40. Georgia Institute of Technology.
Malikova, E., Adzhiev, V., Fryazinov, O., and Pasko, A.
(2019). Visual-auditory volume rendering of scalar
fields. In ICAD 2019, Northumbria University, New-
castle upon Tyne, UK. Georgia Institute of Technol-
ogy.
Max, N. and Chen, M. (2010). Local and global illumi-
nation in the volume rendering integral. In Scientific
Visualization: Advanced Concepts, pages 259–274.
May, K. R., Sobel, B., Wilson, J., and Walker, B. N. (2019).
Auditory displays to facilitate object targeting in 3d
space. In ICAD 2019, Newcastle upon Tyne, UK.
Georgia Institute of Technology.
McArthur, A., Sandler, M., and Stewart, R. (2017). Dis-
tance in audio for vr: Constraints and opportunities.
In Proceedings of the 12th International Audio Mostly
Conference on Augmented and Participatory Sound
and Music Experiences, AM ’17, pages 28:1–28:7,
New York, NY, USA. ACM.
M.W.Schmidt, K.K.Baldridge, J.A.Boatz, S.T.Elbert,
M.S.Gordon, J.H.Jensen, S.Koseki, N.Matsunaga,
K.A.Nguyen, S.Su, T.L.Windus, M.Dupuis, and J.,
J. (1993). General atomic and molecular electronic
structure system. Comput. Chem., 14:1347–1363.
NVIDIA (2019). CUDA C++ Programming Guide.
Pasko, A., Adzhiev, V., Schmitt, B., and Schlick, C. (2001).
Constructive hypervolume modeling. Graphical Mod-
els, 63(6):413–442.
Ribeiro, F., Flor
ˆ
encio, D., Chou, P. A., and Zhang, Z.
(2012). Auditory augmented reality: Object sonifica-
tion for the visually impaired. In 2012 IEEE 14th In-
ternational Workshop on Multimedia Signal Process-
ing (MMSP), pages 319–324.
Schlegel, P., Makhinya, M., and Pajarola, R. (2011).
Extinction-based shading and illumination in gpu vol-
ume ray-casting. IEEE Transactions on Visualization
and Computer Graphics, 17(12):1795–1802.
Shusterman, A. and Strauss, L. (2001). Teaching chemistry
with electron density models. 2. can atomic charges
adequately explain electrostatic potential maps? The
Chemical Educator, 6:36–40.
Siltanen, S., Lokki, T., Kiminki, S., and Savioja, L. (2007).
The room acoustic rendering equation. 122:1624.
Smith, J. O. (1992). Physical modeling using digital waveg-
uides. Computer Music Journal, 16(74):74–91.
Takala, T. and Hahn, J. (1992). Sound rendering. In Pro-
ceedings of the 19th Annual Conference on Computer
Graphics and Interactive Techniques, SIGGRAPH
’92, pages 211–220, New York, NY, USA. ACM.
Tappenbeck, A., Preim, B., and Dicken, V. (2006).
Distance-based transfer function design: Specification
methods and applications. In SimVis2006, pages 259–
274.
Wahle, M. and Wriggers, W. (2015). Multi-scale visualiza-
tion of molecular architecture using real-time ambient
occlusion in sculptor. In PLoS Computational Biol-
ogy, volume 11.
Wang, L., Yu, Y., Zhou, K., and Guo, B. (2011). Multiscale
vector volumes. ACM Trans. Graph., 30(6):167:1–
167:8.
IVAPP 2020 - 11th International Conference on Information Visualization Theory and Applications
200
