
Using Eyetracker to Find Ways to Mitigate Ransomware
Budi Arief
1 a
, Andy Periam
1
, Orcun Cetin
2
and Julio Hernandez-Castro
1 b
1
School of Computing, University of Kent, Canterbury CT2 7NF, U.K.
2
Department of Natural Science and Engineering, Sabanci University, Istanbul, Turkey
Keywords:
Ransomware, Ransom Notes, Splash Screens, Eye Tracker, Countermeasures, Mitigation, User Study.
Abstract:
Ransomware is a form of malware designed to prevent access to data by either locking out the victims from
their system or encrypting some or all of their files until a ransom has been paid to the attacker. Victims would
know that they had been hit by ransomware because a ransom demand (splash screen) would be displayed on
their compromised device. This study aims to identify key user interface features of ransomware splash screens
and see how these features affect victims’ likelihood to pay, and how this information may be used to create
more effective countermeasures to mitigate the threat of ransomware. We devised an experiment that contained
three broad types of splash screens (Text, Time-Sensitive Counter, and Other). A total of nine splash screens
were shown to each participant, from which data on the participants’ eye behaviour were collected. After each
splash screen, participants were also asked a set of questions that would help describe their experience and be
cross-referenced with the eye tracking data to aid analysis. Our experiment collected quantitative eye tracker
data and qualitative data regarding willingness to pay from 25 participants. Several key components of the
splash screens such as the text, logo, images, and technical information were analysed. Comments from the
participants on whether they would pay the ransom or not, and the reasons behind their decision were also
recorded. We found that there is no clear indication that one type of splash screen would have a higher chance
of success with regard to ransom payment. Our study revealed that there are some characteristics in splash
screens that would strongly discourage some victims from paying. Further investigation will be carried out in
this direction, in order to design and develop more effective countermeasures to ransomware.
1 INTRODUCTION
Ransomware is a term used to describe a particular
type of malware which restricts the functionality of
and/or access to data stored on the infected device. At
the same time, ransomware typically displays a ran-
som note in an attempt to extract payment from the
victim in order to restore the functionality/data to the
state before the infection.
The first instance of ransomware appeared nearly
three decades ago with the concept of cryptovirus
that encrypt the victim’s files and demand payment
(Young and Yung, 1996). However, very little growth
of ransomware variants and infections was seen until
2015, perhaps due to the state of the computing tech-
nology up to that point, as well as the lack of practical
ways to exploit the technique (especially in dealing
with the payment part) on a large scale. The increased
popularity of cryptocurrencies changed all that. There
a
https://orcid.org/0000-0002-1830-1587
b
https://orcid.org/0000-0002-6432-5328
were 35 known ransomware variants in 2015, but this
figure jumped to 193 in 2016 (Ferreira, 2018).
With the increasing popularity of ransomware – as
well as the significant threat that ransomware poses
to our society – it is important to understand vari-
ous facets of ransomware so that researchers can de-
vise ways to mitigate the risks associated with ran-
somware. Preventative measures such as having a reg-
ular backup of important data would help, but many
users often did not do this. Detection and recovery
actions should ideally be done at the earliest oppor-
tunity. However, in most cases, victims would only
know that they had been hit by ransomware when
their computer was frozen and a ransom note (or a
ransomware “splash screen”, as we call it in this pa-
per) was displayed. It will be useful to understand
the kinds of splash screen used in ransomware, and
the likely reaction that a victim may have upon seeing
these splash screens. In particular, we are interested
to find out whether certain splash screens may have
a better or worse success rate (in terms of persuading
448
Arief, B., Periam, A., Cetin, O. and Hernandez-Castro, J.
Using Eyetracker to Find Ways to Mitigate Ransomware.
DOI: 10.5220/0008956004480456
In Proceedings of the 6th International Conference on Information Systems Security and Privacy (ICISSP 2020), pages 448-456
ISBN: 978-989-758-399-5; ISSN: 2184-4356
Copyright
c
2022 by SCITEPRESS – Science and Technology Publications, Lda. All rights reserved

the victim to pay the ransom demand).
As such, the main aims of our research were to
investigate a range of ransomware splash screens
and to address the fundamental research question of
whether the design of a ransomware splash screen has
any impact on a victim’s willingness to pay. In turn,
this information can be used by security researchers
and Law Enforcement Agencies to devise ways to per-
suade ransomware victims not to pay the ransom.
To achieve these aims, we carried out a user study
involving an eye tracker and specially selected ran-
somware splash screens. The set up of our experiment
would present a series of splash screens to each partic-
ipant while their eye activities were being monitored
using an eye tracker. Eye-tracking is an established
method to understand where individuals are directing
their attention when processing information and mak-
ing decisions (Orquin and Loose, 2013). The partic-
ipants were then asked whether they would be will-
ing to pay the ransom demand based on the splash
screen they just saw. Their answers were then corre-
lated with the eye tracking data to see whether there
were any specific characteristics in the splash screen
interface that would have positive (or negative effect)
on the participants’ willingness to pay.
Contributions. Our key contributions are the insights
into common types of ransomware splash screens and
the suggestion of potential factors that may affect the
likeliness of a victim to pay the ransom demand. The
results from this research can then be used to see
where security efforts may be spent to mitigate the
threats of ransomware, or even to devise psychologi-
cal countermeasures to discourage victims to pay.
2 RELATED WORK
The process of ransomware infection can be typically
broken down into the three stages of infecting the tar-
get, removing functionality or access to data and fi-
nally displaying ransom note (Gazet, 2010). A more
detailed analysis of ransomware deployment stages
(Hull et al., 2019) sees that ransomware’s behaviour
may be:
• stealthy (it tries to stay undetected while it pre-
pares the groundwork for the attack). Typical op-
erations in this stage include fingerprinting the tar-
get device, exploring the possibility of propaga-
tion to other systems in the network.
• suspicious (it starts performing operations that
damage the victim’s device, but it likely is still
undetected by the victim). This includes the pro-
cess of encrypting valuable data on the victim’s
device, and locking functionality of the device.
• obvious (it announces its presence to its victim).
At this stage, a ransom note will be displayed, and
in some cases, destructive actions may also start.
This paper focuses on the obvious stage of ran-
somware deployment. In particular, we would like
to investigate the effectiveness of ransomware splash
screens in persuading victims to pay. We hope that by
understanding the cyber psychology of these splash
screens, more appropriate countermeasures can be
created to discourage ransomware victims to pay.
Current development in ransomware defence has
primarily focused on detection methods aimed to pre-
vent users from infection before the loss of func-
tionality stage. Majority of antivirus software uses
signature-based techniques in which known malicious
code is assigned a signature by dissembling the binary
(Mathur and Hiranwal, 2013). When the antivirus ex-
amines any new or existing binary on the machine, it
will look to see if this signature is present and if so,
block the execution where possible.
Unfortunately, the creation rate of malware of-
ten exceeds the creation of known signatures, result-
ing in machines still being vulnerable to infection.
Behaviour-based techniques are designed to analyse
a wide range of parameters and determine if any of
them start to respond in a way that resembles known
infection behaviour (Mathur and Hiranwal, 2013).
Kharraz et al. (Kharaz et al., 2016) introduced a ran-
somware detection and classification system called
“Unveil”, which identifies ransomware by tracking
changes made on artificial environment. An alterna-
tive approach by Sgandurra et al. (Sgandurra et al.,
2016) proposed an automated program called “El-
deRan” which uses machine learning to classify mali-
cious samples based on dynamic analysis of their be-
haviour. Key behavioural features are then mapped in
order to enable detection of new variants.
At the other end of the ransomware life cycle,
Huang et al. tracked Bitcoin ransom payments from
victims, to the cash-out by the ransomware opera-
tors. Their analysis found out that 16 million USD
has been extorted from 20,000 victims over 2 years
period (Huang et al., 2018).
Game theoretic models examining whether to pay
the ransom (or not) are presented by Cartwright et al.
in (Cartwright et al., 2018). It compares ransomware
to a crime of kidnapping, whereby a criminal takes
control of a victim’s device in expectation of some fi-
nancial gain. The paper dissects various aspects, from
criminal’s incentives to return files, to the challenges
faced by the victim on deciding whether to pay or not,
due to incomplete information, and even whether the
victim should or should not bargain with the criminal.
Designs of ransomware splash screens – whether
Using Eyetracker to Find Ways to Mitigate Ransomware
449

conscious or not – often incorporate the use of a
wide range of social engineering techniques. Some
fundamental techniques have been identified such
as scarcity, authority and liking (Hadlington, 2017).
Scarcity is used by limiting a person’s desires unless
they obey a particular request. The perception of au-
thority has also shown to increase the probability of a
person complying, a slight contrast from liking where
people comply with a greater sense of willingness due
to liking someone or something (Hadnagy, 2010).
3 METHODOLOGY
This study aims to investigate various types of ran-
somware splash screens and see whether their design
has an overall effect on a victim’s likelihood to pay.
The study contained an experiment that allowed for
responses from participants to be captured when pre-
sented with a ransomware infection. Combined with
these responses, we analysed captured eye tracking
data to determine whether there was any correlation
between the splash screen designs, the participants’
responses and their likelihood to pay.
3.1 Experiment Design
The experiment was conducted using a single factor
design in which splash screen type was encoded as
TYPE, which contains three categories: ”Text” (T)
type encompasses splash screens that are presented in
a textual format; ”Time-Sensitive Counter” (C) type
uses active countdown timer as a way of applying
scarcity (Hadlington, 2017); and ”Other” (O) type
covers splash screens that do not have any immedi-
ately apparent dynamic scarcity, while also providing
a more advanced user interface than a simple text file.
We looked at each splash screen’s Areas of Interest
(AOI) under four key categories: Objects, Text, Pres-
sure, and Technical. Each of the categories contain
several tags as shown in Table 1.
We collected 38 splash screens from New Jersey
Cybersecurity & Communications Integration Cell
(NJCCIC, nd), and from that list, a selection of 22
where chosen for the experiment, to cover a mixture
of designs and complexity, from plain text files, to
interactive elements and active components such as
timers. Selection was also determined by the presence
of the social engineering techniques (scarcity, author-
ity and likeness) as well as the inclusion of some large
profile attacks such as WannaCry. The full list of the
ransomware splash screen used, their statistical usage
data in the experiment, as well as their success rates
can be seen later in Section 4 as Table 2.
Before each splash screen was presented to the
participant, a simulation of a Windows 10 environ-
ment displaying a webpage was shown for 3 seconds.
This was followed by a simulated ransomware infec-
tion for 2.5 seconds, where visible desktop files were
encrypted and deleted, and the desktop background
was changed to black. The ransomware splash screen
could be displayed for up to a minute or terminated
early by the investigator. A blank screen would ap-
pear at the end of the splash screen, with the next
splash screen in the sequence only commencing at the
investigator’s control.
3.2 Setup
The experiment used a computer with a 13.3” LCD
at a resolution of 1920 x 1080 and set to a maximum
brightness of 500 nits. A Tobii X2-30 compact eye
tracker (Tobii Pro, nd) – which allows for eye track-
ing data to be captured at a rate of up to 60Hz – was
placed at the bottom centre of the display. The cen-
tre alignment of the eye tracker was also reconfigured
via Tobii software at the start of each setup. Each par-
ticipant was seated and placed approximately 60-65
cm (23-26”) as recommend by the Tobii user guide
(Olsen, 2012). The placement was based on the dis-
play size, to ensure that the participant was within the
recommended gaze angle.
3.3 Sampling
For the experiment, a total of 25 participants were
recruited (mostly from the research team’s circle at
the university), with their ages ranging from 18 to 59
years old. To participate, subjects had to meet the
condition that they currently used a personal comput-
ing device frequently, whether for personal or profes-
sional use. Participants were not paid for their time.
3.4 Ethical Considerations
The research was assessed and approved by our Uni-
versitys Research Ethics Committee. The experi-
ments were conducted on an individual basis. Each
participant was given a participant information sheet
that outlined the detail of the experiment. They were
also presented with a consent form, which explained
the voluntary nature of the participation. Each par-
ticipant was required to sign a consent form before
proceeding. All collected data were anonymised and
saved in a password protected environment.
ICISSP 2020 - 6th International Conference on Information Systems Security and Privacy
450
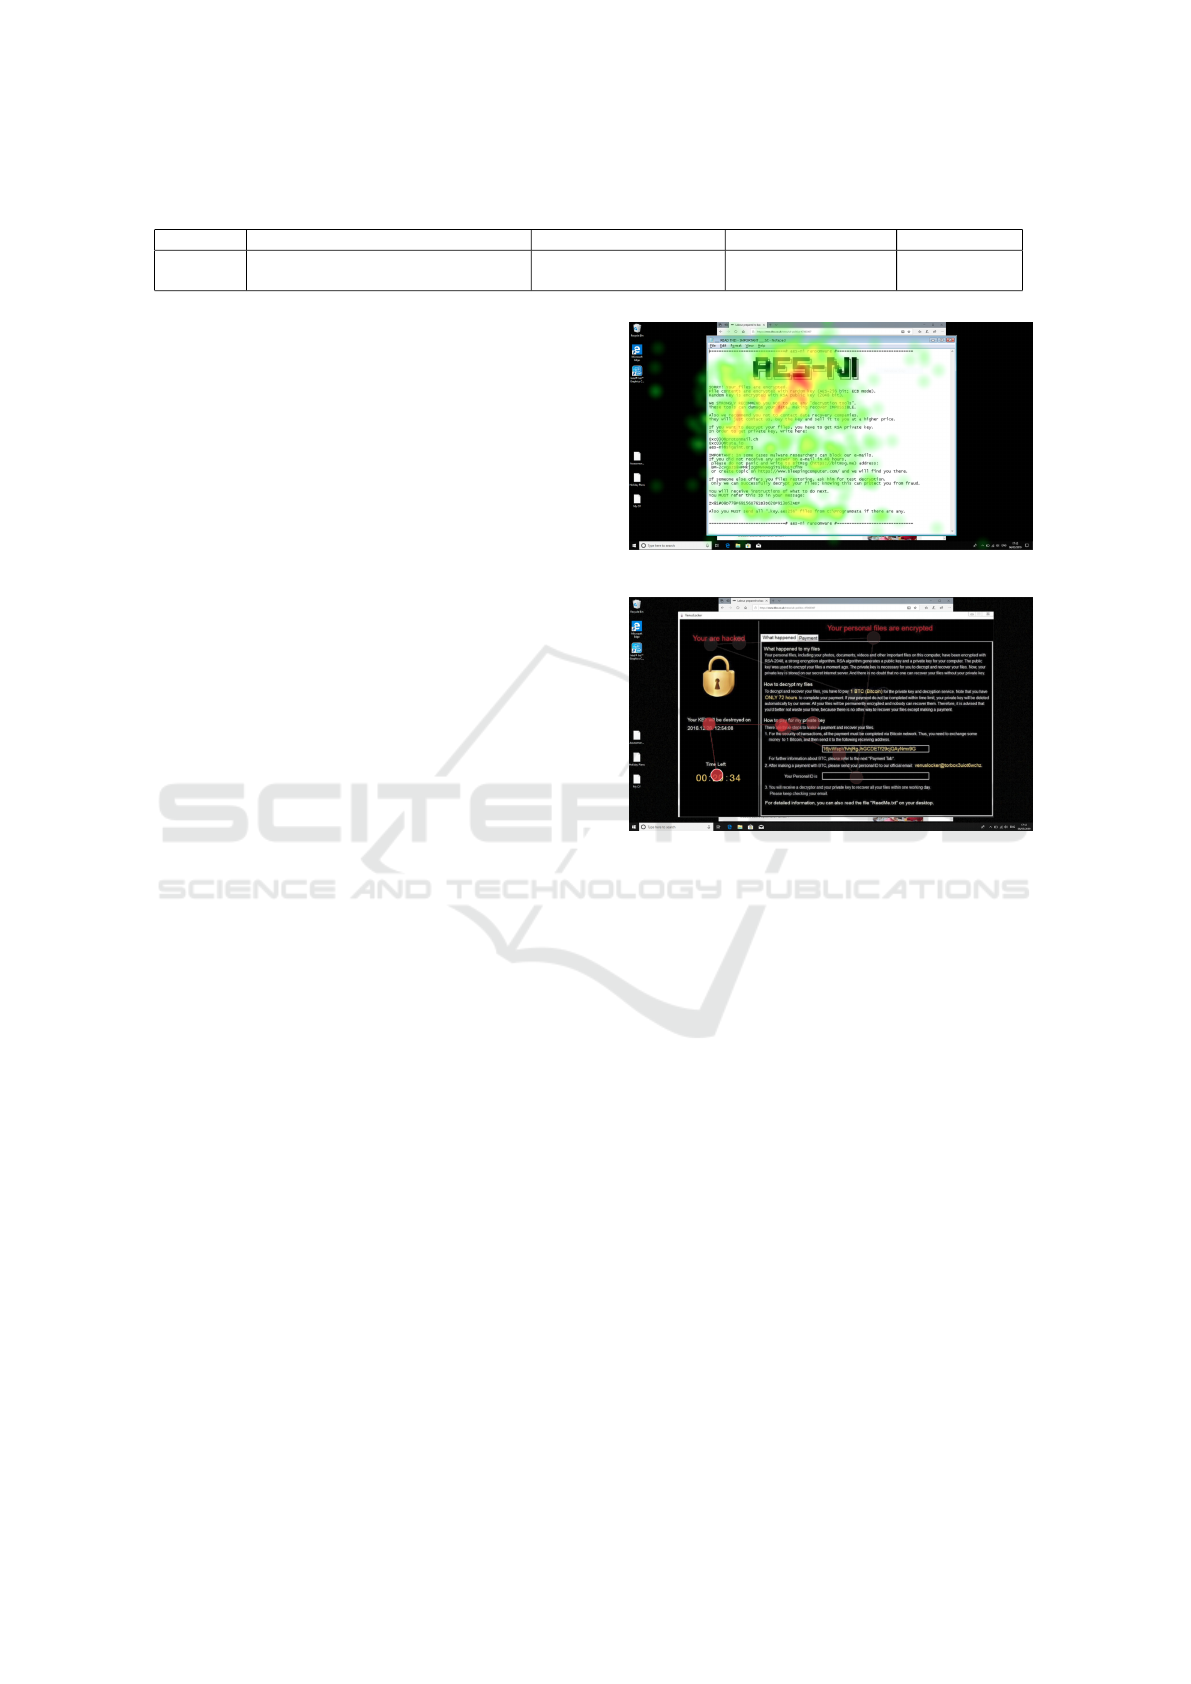
Table 1: Summary of AOI Tags.
Categories Object Text Pressure Technical
Tags Button, Contact, External link, Graphic logo,
Image, Input field, Payment amount, Text logo
Heading, Subheading, Bullet
point, Numbered list
Static timer, Active timer,
Language
Encryption type,
Key
3.5 Procedure
At the start of an experiment, the eye tracker was
configured in which the angle and distance from the
participant were adjusted to meet the previously de-
scribed settings. Once set, a five-point eye tracking
reference was done to complete the configuration step
and would be repeated in the event of insufficient data.
Before beginning the ransomware simulation, the
investigator would give the participant a sense of what
questions would be asked about each splash screen to
minimise any order effect on the questionnaire results.
Once the ransomware simulation began, eye data was
recorded to be able to identify the order in which AOI
was viewed. The investigator would allow the partici-
pant to view each splash screen for 30 seconds before
prompting the participant on their thoughts concern-
ing the splash screen. Participants were allowed to
start communicating before the investigator prompt,
as preliminary testing showed this helped reduce the
chances of respondent fatigue.
At this stage, the investigator was not required
to ask all four questions about each splash screen
directly and was permitted to extract those answers
from casual conversation with the participant, ask-
ing directly when needed, and echoing their response
back when clarification was required. The process
was repeated for the remaining eight splash screens.
Data from all 25 participants were exported using
the “Metrics export” feature integrated with Tobii Pro
Lab and applying the fixation filter to the results. The
filter enabled the raw eye data that had been captured
to be viewed in a tabled format, displaying key areas
of interest with recorded measurements in seconds.
There are several key parameters in relation to AOI:
• Total Fixation Duration (TFD) reports an average
time of how long a participant spent looking at all
of the AOI on the particular splash screen
• Time to First Fixation (TFF) defines how long it
would take a participant to locate an initial AOI
• Time to Next Fixation (TNF) reports how long it
would take the participant to move on to another
AOI; in combination with TFF, it allows for the
AOI attention effectiveness to be determined
• Total Visit Duration (TVD) measures how long the
participant looked at a particular AOI, which can
be a good indicator to determine what parts of the
splash screens captured the participant’s attention
the most overall
Figure 1: A sample heatmap of the AES-NI splash screen.
Figure 2: Fixations sequence on VenusLocker.
• Fixation Count (FC) and Visit Count (VC) pro-
vide an insight into how many times the partici-
pant would visit an AOI and how many fixations
would occur in the AOI
Heatmaps from each splash screen were gathered,
with an example from the AES-NI ransomware is
shown in Figure 1. A heatmap indicates the attrac-
tive elements of the screen in the form of “hot” (red)
and “cold” (green) regions.
The Tobii tool can also capture the trace of the
order of fixations, with the highest intensity being the
most recent, as shown in an example involving Venus-
Locker (see Figure 2). The lines here are just indicat-
ing how the participant’s eyes moved from one point
to the next.
4 RESULTS
From the questionnaire data, we compiled a table of
each ransomware’s success rate, which is calculated
using the answer that each participant gave after being
shown a splash screen and asked whether they would
pay or not (see Table 2). The key findings are:
Using Eyetracker to Find Ways to Mitigate Ransomware
451
• The highest success rate recorded was 44.44%,
with BadRabbit, BTCWare and CryptoShield.
• In three cases (Matrix, RedBoot and Shifr), all of
the involved participants just refused to pay.
• The highest success rates for each type were
44.44% for Counter type (BadRabbit), 44.44%
for Other type (BTCWare, CryptoShield), and
33.33% for Text type (AES-NI).
We then looked into the eye tracker data to see
if there was any correlation with various AOI. The
dependent variables are represented in seconds with
the mean and standard deviation (enclosed in paren-
theses). Table 3 shows that there is some difference
between the three types, but this appears to have min-
imal impact on the overall success rate. Further anal-
ysis of the data showed that there is signification vari-
ation between four out of the six dependent variables,
suggesting there is enough variation between the three
types to cause a difference in participant attention.
Table 2: The list of the ransomware splash screens used,
their type, how many times they were used in the experi-
ment (denoted as ‘#’), how many participants would pay,
and success rates.
Ransomware Type # Pct Would Pay Success
AES-NI Text 9 4.00% 3 33.33%
Amnesia Text 9 4.00% 2 22.22%
Apocalypse Text 16 7.11% 4 25.00%
BadRabbit Counter 9 4.00% 4 44.44%
BTCWare Other 9 4.00% 4 44.44%
CERBER Other 7 3.11% 2 28.57%
CradleCore Counter 9 4.00% 1 11.11%
CryptoShield Other 9 4.00% 4 44.44%
FireCrypt Other 9 4.00% 3 33.33%
JigSaw Counter 16 7.11% 3 18.75%
Matrix Other 7 3.11% 0 0.00%
ODCODC Text 16 7.11% 4 25.00%
OpenToYou Other 9 4.00% 3 33.33%
PyCL Counter 16 7.11% 4 25.00%
RedBoot Other 9 4.00% 0 0.00%
Sage Counter 9 4.00% 2 22.22%
Samsam Other 7 3.11% 2 28.57%
Shifr Text 9 4.00% 0 0.00%
SyncCrypt Other 9 4.00% 1 11.11%
VenusLocker Counter 7 3.11% 3 42.86%
Wannacry Counter 9 4.00% 3 33.33%
xData Text 16 7.11% 5 31.25%
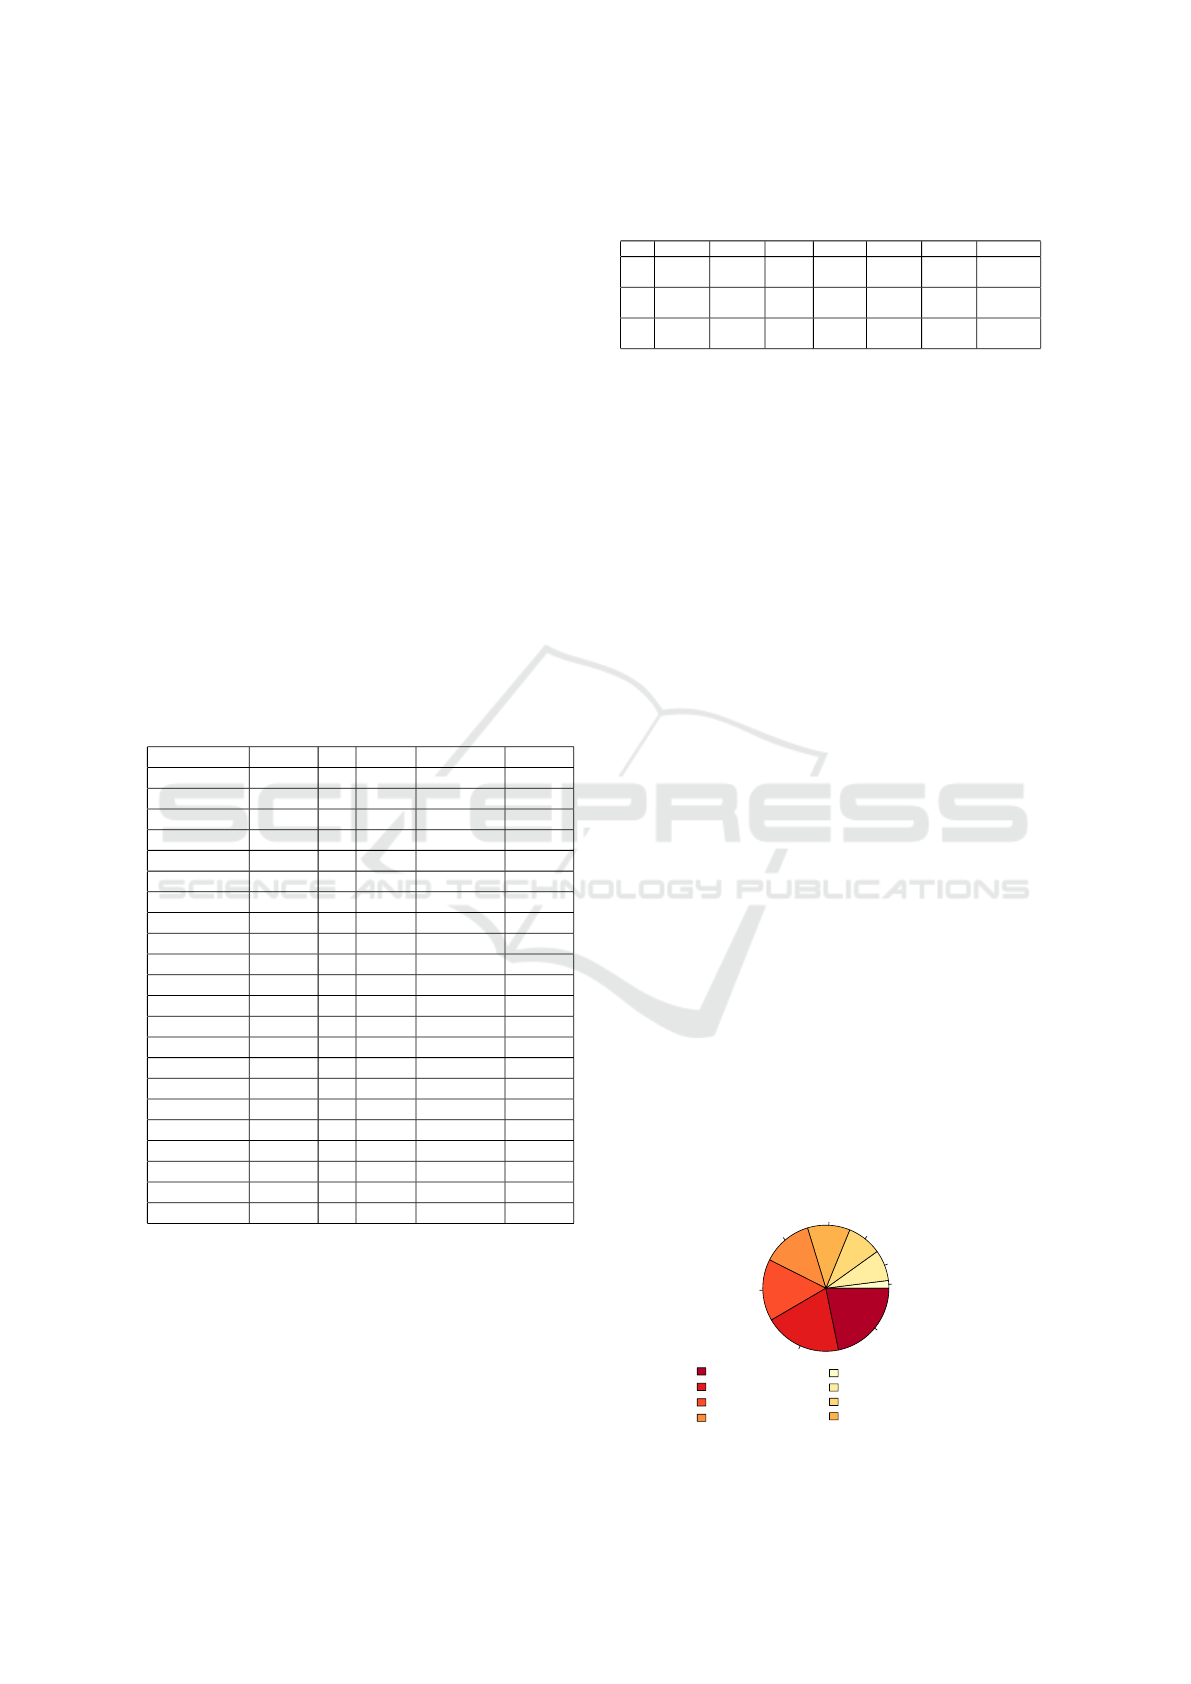
Figure 3 shows the spread of TVD AOI tags, with
Object: Images having the highest proportion at 22%,
and Technical: Encryption receiving the lowest at 2%.
It should be noted that in some instances, Object: Im-
ages contained some of the largest AOI hit zones due
to the use of background images which would be a
contributing factor to its high score. It is also shown
that Text AOI had the second and third highest TVD
proportions.
Table 3: Mean AOI recordings across types (in seconds) and
their success rates (participants’ likelihood to pay).
TFD FC TFF TNF TVD VC Rate
T
2.24
(1.72)
5.00
(3.35)
5.74 10.07
2.40
(1.90)
3.39
(1.74)
35.09%
C
1.93
(0.87)
5.45
(2.10)
8.69 4.00
2.08
(0.95)
3.53
(1.09)
35.09%
O
1.91
(1.20)
4.83
(2.46)
3.15 7.74
2.06
(1.27)
3.29
(1.29)
29.82%
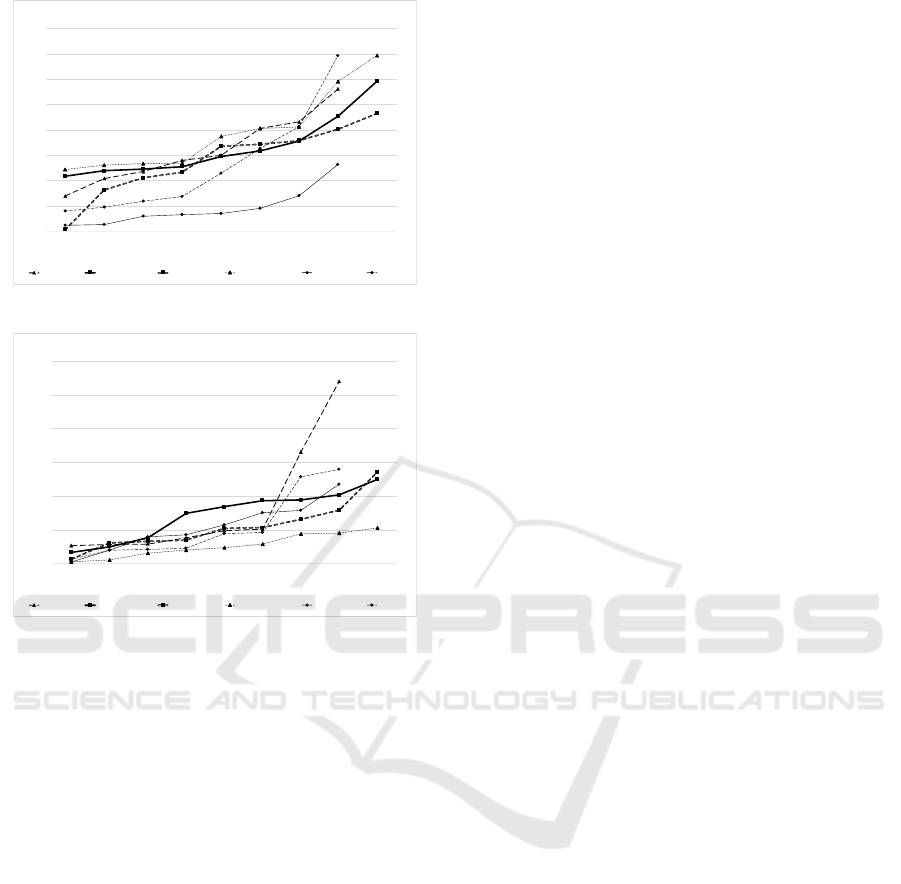
Scores of TFF from six splash screens – com-
prised of two highest success rate (BadRabbit and
BTCWare), two mid success rate (AES-NI and
CradleCore) and two lowest success rate (RedBoot
and Shifr) – show that while these splash screens had
distantly different characteristics, there was little di-
vergence when comparing the ranges of TFF AOI (see
Figure 4). The TFF values for the six splash screens
range from 0.3 to 34.68 seconds, following a simi-
lar gradient. Perhaps what is interesting to see here
is the TFF values for RedBoot, which had a zero suc-
cess rate. These were notably much lower (1.19-13.17
seconds) in comparison to other TFF values, includ-
ing Shifr (which also had a zero success rate). This
could be due to the simplicity of the RedBoot inter-
face (only 3 lines of text).
TVD scores for the same six had displayed that
in general, splash screens managed to obtain a steady
growth in user attention for AOI. The majority of the
TVD values fell within the 0.1 to 5.69 seconds bracket
(see Figure 5). However, AES-NI had a spike of AOI
values of 6.62 and 10.78 seconds. A plausible expla-
nation for this is because AES-NI is a Text type ran-
somware, and some participants might have tried to
read the ransom note more carefully.
4.1 Participants’ Comments
On top of these technical and quantitative data, we
also collected qualitative data from the participants,
in the form of free text to explain why they would
or would not pay for a particular ransomware. These
data provide a richer context to the thinking process
behind the participants’ decision. They list some un-
expected factors that would discourage victim to pay:
• Authoritarian tone of the note (e.g. pretending to
2%
8%
9%
11%
13%
16%
20%
22%
Technical:Encryption type
Objects:Graphic logos
Objects:Text logos
Objects:Contact
Pressure:Active timers
TEXT:Subheading
TEXT:Heading
Objects:Images
Figure 3: AOI tags TVD.
ICISSP 2020 - 6th International Conference on Information Systems Security and Privacy
452
0
5
10
15
20
25
30
35
40
1 2 3 4 5 6 7 8 9
Time/in/Seconds
Participant/Numbers
TFF/AOI
AES
-NI
BadRabbit
BTCWare
CradleCore
RedBoot
Shifr
Figure 4: Six mixed performing splash screens’ TFF AOI.
!"!!
#"!!
$"!!
%"!!
&"!!
'!"!!
'#"!!
' # ( $ ) % * & +
,-./0-102/34156
789:-3-;81:0<=.>/96
,?@0ABC
AD2
E<C
F85G8>>-:
F,HI89/
H985J/H49/
G/5F44:
2K-L9
Figure 5: Six mixed performing splash screens’ TVD AOI.
be the FBI, like in the case of Matrix, which had
a zero success rate) seemed to have put off partic-
ipants from paying
• Having the ransom note containing ty-
pos/grammatical mistakes also discouraged
people to pay (e.g. RedBoot and SyncCrypt,
which had 0% and 11.11% success rates)
• Some participants had a negative pre-conception
on Bitcoin (which is the common cryptocurrency
used for paying the ransom), in which they asso-
ciated Bitcoin with illegal online activities, which
in turn dissuaded many people to pay due to the
mention of Bitcoin
• Having complicated instruction (or too much in-
formation) in the splash screen also put off our
participants from paying
• Not having a clear way to contact the ransomware
operator appeared to make several potential vic-
tims decided that there was no way to check
whether their payment would have reached the
destination or not, hence they opted not to pay
5 DISCUSSION
Over the course of the experiment, splash screens
were shown a total of 225 times (see Table 2). The
results showed that while the distinctions between the
three types led to a difference in participant’s FC,
TFF, TNF and VC, the study did not find any sta-
tistically significant difference that would influence a
participant’s likelihood to pay.
5.1 Insights from the Text Type
When exploring the responses received for the highest
success rate splash screen of TYPE Text (AES-NI),
participants that were willing to pay had all stated that
the Object: Text logo was a key element that stood
out. The participant’s response remained consistent
with the tracking data which showed that this was the
first AOI they viewed, having 62.5% of participants
recorded a TFF of less than 2 seconds and an average
TVD of 8.25 seconds – at least seven times longer
than any other AOI (as can be seen in Figure 5).
While it is evident that the Object: Text logo is
effective in engaging participants’ attention, there is
no evidence to suggest that there is any correlation
between this element and a participant’s likelihood to
pay. This can be deduced from the observation that
the remaining 66.67% participants who did not want
to pay showed some of the more compelling results
when it came to capturing user’s attention.
BadRabbit – which held the highest success rate
within TYPE Time-Sensitive Counter – somewhat
emphasises this. This splash screen had been marked
with seven AOI compared to AES-NI’s nine. Like
AES-NI, BadRabbit also incorporated the use of an
Object: Text logo, but in this instance, when partic-
ipants were asked of any elements that stood out to
them, only one out of the group who said they would
consider paying had mentioned that particular AOI.
With the BadRabbit splash screen, in general partici-
pants took longer to visit their first AOI with the first
TFF being recorded at an average of 11.07 seconds.
However, this AOI was not an Object: Text logo, but
rather a TEXT: Subheading . On average, Object:Text
logo had a TFF of 12.50 seconds and an average TVD
of 2.35 seconds, placing it fourth amongst other AOI.
It is worth noting that the participant who was will-
ing to consider payment and did mention this element
had a significantly higher TVD on this AOI. However,
50% of participants who also stated they would con-
sider payment did not even register a gaze reading for
this object, suggesting that it had a little overall effect.
Using Eyetracker to Find Ways to Mitigate Ransomware
453

5.2 Insights from the Time-sensitive
Counter Type
BadRabbit’s highest recorded TVD was for Pressure:
Active timers at 4.03 seconds with a TFF of 13.90
seconds, which is 2.38 seconds slower than the av-
erage first TFF. 50% of participants who would con-
sider paying had mentioned the counter as being the
primary reason for payment which could be due to the
short timer variant being used in this splash screen.
Upon further analysis, it would appear that overall
this may not be the case. PYCL splash screen had a
long and short variant for testing, and when compar-
ing these two, it was found that the counter provid-
ing participants with around 72 hours had a success
rate of 42.85%, in contrast to the short 20-minute ver-
sion which only yielded a success rate of 11.11%. In
this case, 66.66% of participants who responded with
considering paying the long alternative had not even
registered a gaze on the Pressure: Active timers AOI.
Further exploration amongst Pressure: Active
timers with the lowest success rate splash screen
under TYPE Time-Sensitive Counter (CradleCore)
uncovered that for this element, participants’ TVD
was the second longest viewed AOI at 1.29 seconds
but was fifth in TFF (at 18.50 seconds) out of 8
AOI. These figures are comparable to BadRabbit and
PYCL TFF order which was third out of six and sec-
ond out of seven respectively. With relatively little
variation in the order the AOI was viewed across dif-
ferent success rates, we deducted that there is no sig-
nificant effect with the incorporation of Pressure: Ac-
tive timers.
5.3 Insights from the Other Type
Last but not least, we looked at splash screens that
adopt the use of Object: Graphic logo. WannaCry im-
plemented the use of this element in the form of a pad-
lock, a design choice that also appears in OpenToYou,
both of which share the same success rate of 33.33%.
A critical distinction between these two is the amount
of AOI, with WannaCry containing nine and Open-
ToYou only containing three. 66.66% of participants
who did not object to potentially paying OpenToYou
had commented on the padlock, whereas none of the
participants that were subject to WannaCry had men-
tioned the AOI. Eye tracking data showed that par-
ticipants who saw both splash screens shared virtu-
ally identical TVD with only 0.03 seconds separating
them apart, even though the use was far more pro-
nounced in OpenToYou (with only two other AOI to
contend with).
While Object: Contact and Text: Heading seem
to appear in multiple high success rate splash screens,
they are also prevalent across the set of splash screens,
so their effectiveness cannot be concluded in this in-
stance. Note that some participants did respond by
stating that they would get in contact with the attacker
on occasions where contact information was avail-
able, before deciding on whether to pay or not. There-
fore, there is a slight indication that Object: Contact
can be a contributing factor to a victim’s decision.
Exploring the effects caused by Technical: En-
cryption type highlighted that it appeared in splash
screens with a success rate of 25% or greater. This
includes CryptoShield, which shared the highest suc-
cess rate of 44.44%. An interesting discovery ob-
tained by participant’s answers was that even though
they did not pick up specifically on technical lan-
guage, the appearance of being technical was enough
to persuade them into considering paying. xData –
which had a success rate of 31.25% – had responses
that commented on its technical appearance but in ac-
tuality had no Technical AOI, which indicates that
participants may not necessarily be fully absorbing
the information in these circumstances and that per-
haps giving the illusion of technical know-how may
be a sufficient attribute in encouraging victims to pay.
5.4 Ideas for Mitigating Ransomware
It is often difficult to persuade victims not to pay the
ransom. For example, in some circumstances – such
as if the victims’ livelihood or business critically de-
pend on the data or services being ransomed – it may
look like paying the ransom is the easiest way out.
Moreover, the amount of the ransom demand may not
sound too expensive (compared to the associated costs
of the clean up actions or loss revenuess) which might
tip the decision making process towards paying up.
Some companies even have cyber insurance policies
to cover the ransom.
Therefore, mitigating the effect of ransomware
once an infection occured (in particular, minimising
the chance of victims paying up the ransom demand)
is a very complex challenge. However, insights from
our study suggest there are some ideas that can be fol-
lowed up to construct more practical mitigation strate-
gies against ransomware:
• Setting up more human-centric awareness cam-
paigns to discourage victims to pay. This includes
providing advice based on human traits/aspects of
the splash screen that victims should consciously
pay attention to (in some cases, nudging), which
will evoke a feeling on the victims’ part that the
attacker cannot be trusted and that paying ransom
should be avoided. For example, victims should
ICISSP 2020 - 6th International Conference on Information Systems Security and Privacy
454

be directed to spot any spelling or grammatical
mistakes in the ransom notes, and they should be
made aware that impersonating an authority is of-
ten the modus operandi of the attacker.
• By understanding the characteristics of ran-
somware splash screen that are likely to be more
successful in persuading victims to pay, Law
Enforcement Agencies can prioritise in tackling
these first, so that that the impact can be min-
imised. Of course this is not an absolute mea-
sure, so such approach should be taken more as
a heuristic rather than a prescribed protocol.
These should be taken in consideration along with
effective preventative measures (e.g. having a sensi-
ble backup system, and not clicking potentially ma-
licious links), better detection and containment tools
against ransomware infection (so that the damage can
be minimised), and appropriate recovery mechanisms
(so that valuable data can be salvaged).
5.5 Limitations
Our results showed that a victim’s likelihood to pay
could potentially be linked more to psychological rea-
soning and personality characteristics. Future stud-
ies should consider a multi-factor experiment design,
taking into account other factors such as age, gender,
technical know-how, and so on.
The experiment has low ecological validity as par-
ticipants had nothing to lose or gain. The ransomware
splash screens were simulated on the researcher’s de-
vice. The sample size (25 participants) was rather
small, so we would like to increase this in the future.
Furthermore, in this setup participants were primed to
expect a ransomware splash screen, which is different
from what they would encounter in real life. These
issues will need to be considered for improving the
validity of the findings.
6 CONCLUSION
Investigating the aspects of ransomware splash screen
design and its effects on a victim’s likelihood to pay
was the main aim of the study presented in this pa-
per. To achieve this aim, we carried out an experi-
ment that enabled participants’ eye tracking data to
be monitored and examined when presented with a
variety of ransomware splash screen. Three types of
splash screen designs (Text, Time-Sensitive Counter,
and Other) were examined, and they contained a col-
lection of four possible AOI categories, which in turn
consisted of a total of 17 sub-categories or tags.
It was found that between the three types, there
was no inherent impact on participants’ likelihood to
pay. When looking at the six key parameters to AOI
(TFD, FC, TFF, TNF, TVD, and VC) we found that
TFD and TVD were the only ones that retained the
null hypothesis with no significant difference found.
This finding verified that there was enough distinc-
tion between the three types that led to a difference in
participants’ eye tracking data.
A comparison between the two highest-rated
splash screens from different types revealed that while
they both had common AOI of Object: Text logo, par-
ticipants’ TFF and TVD between the two types did
differentiate with a large portion having failed to reg-
ister gaze data for this element. This would strongly
suggest that the use of this element plays no signifi-
cant role in a victim’s likelihood to pay.
One of the interesting insights we gleaned from
our study is the identification of some characteristics
of the ransomware splash screens that would discour-
age victims to pay. This finding can be used to devise
more effective countermeasures, such as to provide a
list of things to watch out for in the ransom note that
can help make victim realise that the ransomware op-
erator cannot be trusted, and paying a ransom is not a
good idea (e.g. the threatening nature of the demand,
or the mistakes contained in the note).
We hope that the results of this study may also
assist in the construction of technical defensive coun-
termeasures against ransomware. Possible uses may
include an advanced antivirus software that incor-
porates behaviour-based techniques to monitor pro-
grams for any active User Interface elements that in-
dicate ransomware infection, and automatically take a
preventive action to mitigate the risk (e.g. by making
all files read only to protect them).
REFERENCES
Cartwright, E., Hernandez-Castro, J., and Stepanova, A.
(2018). To pay or not: game theoretic models of ran-
somware. In Workshop on the Economics of Informa-
tion Security (WEIS), Innsbruck, Austria.
Ferreira, A. (2018). Why ransomware needs a human touch.
In 2018 International Carnahan Conference on Secu-
rity Technology (ICCST), pages 1–5. IEEE.
Gazet, A. (2010). Comparative analysis of various ran-
somware virii. J. in computer virology, 6(1):77–90.
Hadlington, L. (2017). Exploring the psychological mech-
anisms used in ransomware splash screens. https:
//www.dora.dmu.ac.uk/handle/2086/15583.
Hadnagy, C. (2010). Social engineering: The art of human
hacking. John Wiley & Sons.
Huang, D. Y., Aliapoulios, M. M., Li, V. G., Invernizzi, L.,
Using Eyetracker to Find Ways to Mitigate Ransomware
455

Bursztein, E., McRoberts, K., Levin, J., Levchenko,
K., Snoeren, A. C., and McCoy, D. (2018). Tracking
ransomware end-to-end. In 2018 IEEE Symposium on
Security and Privacy (SP), pages 618–631. IEEE.
Hull, G., John, H., and Arief, B. (2019). Ransomware de-
ployment methods and analysis: views from a predic-
tive model and human responses. Crime Science, 8(2).
Kharaz, A., Arshad, S., Mulliner, C., Robertson, W., and
Kirda, E. (2016). {UNVEIL}: A large-scale, auto-
mated approach to detecting ransomware. In 25th
{USENIX} Security Symposium ({USENIX} Security
16), pages 757–772.
Mathur, K. and Hiranwal, S. (2013). A survey on tech-
niques in detection and analyzing malware executa-
bles. International Journal of Advanced Research in
Computer Science and Software Engineering, 3(4).
NJCCIC (n.d.). Ransomware. https://www.cyber.nj.gov/
threat-profiles/ransomware-variants/.
Olsen, A. (2012). The tobii i-vt fixation filter. Tobii Tech-
nology.
Orquin, J. L. and Loose, S. M. (2013). Attention and choice:
A review on eye movements in decision making. Acta
psychologica, 144(1):190–206.
Sgandurra, D., Mu
˜
noz-Gonz
´
alez, L., Mohsen, R., and
Lupu, E. C. (2016). Automated dynamic analysis of
ransomware: Benefits, limitations and use for detec-
tion. arXiv preprint arXiv:1609.03020.
Tobii Pro (n.d.). Tobii Pro X2 eye tracker. https://www.
tobiipro.com/product-listing/tobii-pro-x2-30/.
Young, A. and Yung, M. (1996). Cryptovirology:
Extortion-based security threats and countermeasures.
In Proceedings 1996 IEEE Symposium on Security
and Privacy, pages 129–140. IEEE.
ICISSP 2020 - 6th International Conference on Information Systems Security and Privacy
456
