
Atlas Shrugged: Device-agnostic Radiance Megatextures
Mark Magro
a
, Keith Bugeja
b
, Sandro Spina
c
, Kevin Napoli
d
and Adrian De Barro
e
CGVG, University of Malta, Msida, Malta
Keywords:
Megatextures, Sparse Virtual Textures, Distributed Rendering, RTX, Real-time, Ray Tracing, Path Tracing,
Networking, Client-server, Streaming, Texture Atlas, Shading Atlas.
Abstract:
This paper proposes a novel distributed rendering pipeline for highly responsive high-fidelity graphics based
on the concept of device-agnostic radiance megatextures (DARM), a network-based out-of-core algorithm that
circumvents VRAM limitations without sacrificing texture variety. After an automatic precomputation stage
generates the sparse virtual texture layout for rigid bodies in the scene, the server end of the pipeline populates
and updates surface radiance in the texture. On demand, connected clients receive geometry and texture
information selectively, completing the pipeline by asynchronously reconstituting these data into a frame using
GPUs with minimal functionality. A client-side caching system makes DARM robust to network fluctuations.
Furthermore, users can immediately start consuming the service without the need for lengthy downloads or
installation processes. DARM was evaluated on its effectiveness as a vehicle for bringing hardware-accelerated
ray tracing to various device classes, including smartphones and single board computers. Results show that
DARM is effective at allowing these devices to visualise high quality ray traced output at high frame rates and
low response times.
1 INTRODUCTION
The evergrowing number of desktop-class applica-
tions ported to tablet, mobile and other traditionally
weak devices has driven up user expectations with
respect to high-fidelity graphics, biasing user expe-
rience. Users start with high expectations, only to
find that graphics fidelity has been scaled back, to sus-
tain a higher frame rate, or conversely, the frame rate
reduced in favour of higher image fidelity. The re-
cent investment in cloud-gaming streaming technolo-
gies by industry giants such as Google, Microsoft and
Sony, with Stadia, Project xCloud and PlayStation
Now respectively, is a push towards the consolidation
of user experience, especially in the department of vi-
sual fidelity, that is independent of the device used
to consume the content. Streaming solutions assume
a pristine network connection, with low connection
latencies and sufficient bandwidth to accomodate the
desired video resolution. By and large, fluctuations in
network quality degrade user experience; when low
a
https://orcid.org/0000-0002-7602-4979
b
https://orcid.org/0000-0002-3111-1251
c
https://orcid.org/0000-0001-7197-410X
d
https://orcid.org/0000-0001-9749-0509
e
https://orcid.org/0000-0002-3087-9218
latencies are imperative to operating an application
correctly, the service may degrade to the point of be-
ing unusable. The principal cause behind user exas-
peration is known as input lag and manifests when
system response times are large enough that output
from the application visibly trails behind in response
to user commands.
Distributed rendering pipelines attempt to miti-
gate input lag by decoupling rendering stages and dis-
tributing them across different machines. Typically,
expensive computations are moved to a server in the
Cloud, while the client device is tasked with the parts
of the pipeline that contribute most to the percep-
tion of responsiveness. Most implementations dele-
gate indirect lighting generation to the Cloud, with the
rest of the rendering executed on the client. So far,
the primary focus of distributed rendering pipelines
has been that of relieving the computational load of
resource-constrained hardware. As a consequence,
two other equally important factors, memory capacity
and boot time, have rarely been taken into consider-
ation. Limited memory, both in terms of storage or
RAM/VRAM, leads to lower texture quality or vari-
ety, generally affecting the overall fidelity of the ren-
dering. Besides occupying more storage, applications
with a multitude of large assets incur lengthy down-
loads or installation processes, which are avoided
Magro, M., Bugeja, K., Spina, S., Napoli, K. and De Barro, A.
Atlas Shrugged: Device-agnostic Radiance Megatextures.
DOI: 10.5220/0008954902550262
In Proceedings of the 15th International Joint Conference on Computer Vision, Imaging and Computer Graphics Theory and Applications (VISIGRAPP 2020) - Volume 1: GRAPP, pages
255-262
ISBN: 978-989-758-402-2; ISSN: 2184-4321
Copyright
c
2022 by SCITEPRESS – Science and Technology Publications, Lda. All rights reserved
255

Figure 1: DARM (Device-Agnostic Radiance Megatextures).
when the service is entirely streamed from the Cloud.
This paper introduces a novel distributed render-
ing pipeline to address these limitations. The cen-
trepiece of this pipeline is the concept of device-
agnostic radiance megatextures (DARM), a network-
based out-of-core algorithm that circumvents VRAM
limitations without sacrificing texture variety. The
aim of DARM is to bring low-latency high-fidelity
(ray-tracing enabled) network graphics to a plethora
of different devices. To accomplish this, video stream
decoders, which are hardware enabled on most con-
sumer devices, are exploited for data compression;
furthermore, no advanced GPU functionality is as-
sumed of any client, except for the ability to draw
unlit textured geometry.
2 LITERATURE REVIEW
2.1 Megatextures
The term megatexture was introduced by John Car-
mack when discussing the computer game Quake
Wars. It is generalisable to sparse virtual texture sys-
tems, a concept not dissimilar to memory paging in
operating systems. Textures, which are usually larger
than physical memory, are loaded in VRAM on de-
mand; the major difference from paging systems is
that while a process can stall after a pagefault until
a page frame is loaded, the rendering process can-
not. Therefore, when a texture is not found in mem-
ory, the system has to default to a lower quality vari-
ant, typically stored at a higher MIP-level. Barrett
provides more insight into how virtual textures are
implemented and volunteers a reference implemen-
tation (Barrett, 2008). Mittring furthers the discus-
sion of sparse virtual textures and their implications
on game engine design, covering several practical ex-
amples from his experience with Crytek’s implemen-
tation in CryEngine (Mittring et al., 2008).
The unwrapping of geometry and its packing into
virtual textures and atlases may lead to seams form-
ing at the edges on higher MIP levels; Ray et al.
present an approach that generates texture atlases
without seams, based on grid-preserving parameter-
isations (Ray et al., 2010). Their method requires a
postprocessing step before the textures may be used
for rendering. Van Waveren discusses the challenges
encountered when trying to parallelise their virtual
texture implementation to ensure the computer game
Rage executes at 60 Hz (van Waveren, 2009). He
also provides further insight in the implementation of
an efficient virtual texture system in software with-
out special hardware support, from experience with
the system in Rage (van Waveren, 2012). Obert et al.
discuss the OpenGL paging extensions for hardware
regions, to facilitate the implementation of sparse vir-
tual textures (Obert et al., 2012). Hollenmeersch et al.
improve on existing systems by providing a CUDA
implementation with GPU-based optimisations. Al-
though their solution carried additional GPU over-
head compared to systems without virtual texturing,
there were still marked advantages to using their sys-
tem (Hollemeersch et al., 2010).
2.2 Parameterisation
The parameterisation of geometry and texture infor-
mation is a very important step in the generation of
virtual textures. Previous work on large scale terrain
rendering precalculated the levels of detail of geome-
try and textures, while other approaches dynamically
generated the geometry level of detail without the use
of virtual textures (van Waveren, 2012). The first ter-
rain rendering methods to use virtual textures with
per-fragment address translation were clip-map based
techniques (Tanner et al., 1998). Carr et al. use a
multi-resolution texture atlas for real-time procedural
solid texturing that supports mipmapped minification
antialiasing and linear magnification filtering (Carr
and Hart, 2002). Texture samples are arranged in a
GRAPP 2020 - 15th International Conference on Computer Graphics Theory and Applications
256
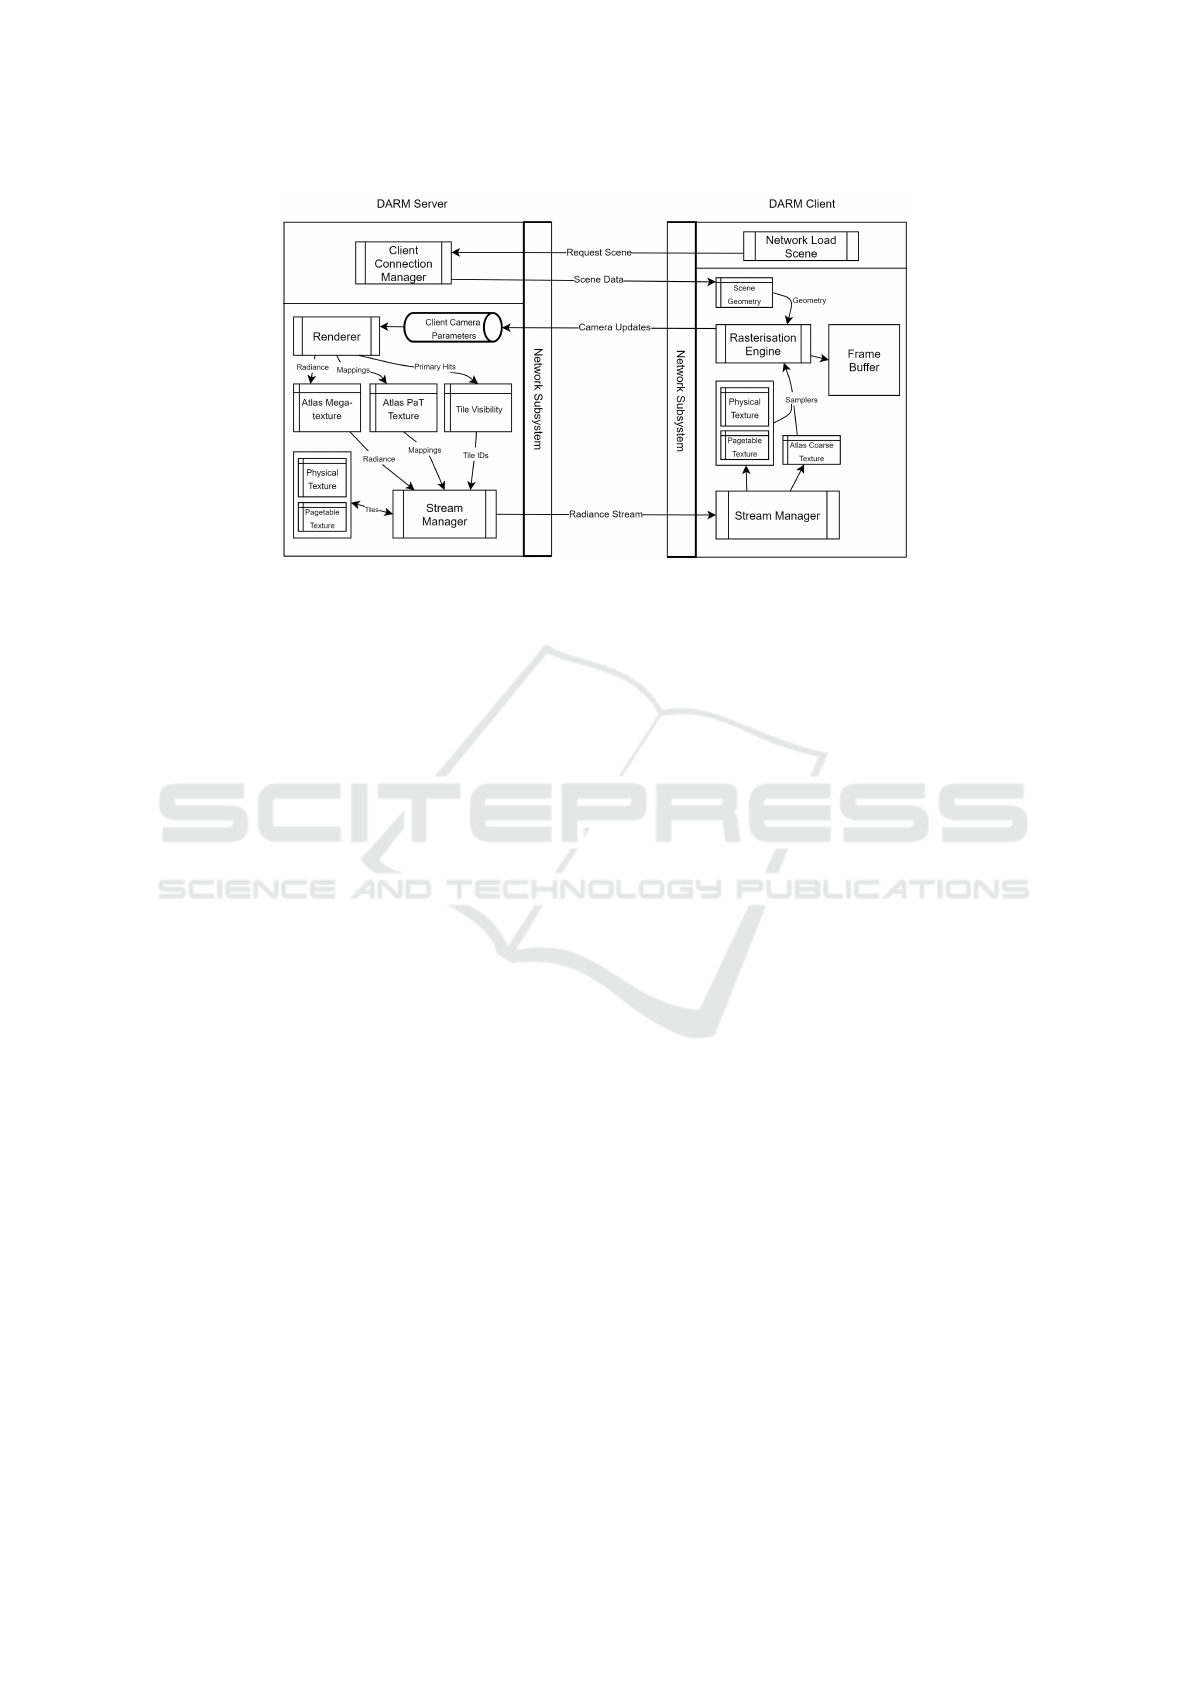
Figure 2: DARM (Device-Agnostic Radiance Megatextures) architecture.
nearly uniform distribution. The texture is resynthe-
sised on demand, when its parameters change, while
the texture atlas is reconstituted only when an object
changes shape. Levy et al. propose an automatic
texture atlas generation method for polygonal mod-
els that can handle complex geometric models (L
´
evy
et al., 2002). Prior to packing the geometry, models
are segmented into a set of charts, with boundaries
positioned in such a way as to reduce discontinuities
that cause texture artefacts. Another constraint they
impose is that charts must be homeomorphic to discs
and should be parameterisable without too much de-
formation. A texture atlas is then created by merg-
ing all the texture coordinate domains of the charts,
by way of achieving a non-overlapping placement of
polygons. This is ensured through enclosing rectan-
gles of minimum area. The texture coordinates are
then re-scaled to fit the size of the texture.
2.3 Atlas Streaming
Shaded Altas Streaming (SAS) is a distributed ren-
dering pipeline that streams geometry and texture in-
formation to the client on a frame by frame basis.
The client device sends object pose information to
the server; these are used to render a new frame and
build the respective shading atlas and geometry meta-
information, which are sent back to the client for
composing and presenting output to the user (Mueller
et al., 2018). Tessellated Shading Streaming (TSS),
a similar approach, does not require a preprocessing
stage for building the texture atlas, but adapts to the
shape of each triangle on screen (Hladky et al., 2019).
This results in a sharper output and avoids visible arte-
facts across triangle boundaries. Both methods bear a
number of similarities to DARM, primarily the dis-
tributed pipeline approach, the texture and geometry
streaming aspects, and the client device requirements,
that it be able to render unlit textured geometry. How-
ever, while SAS and TSS are fundamentally driven
by rasterisation back-ends, DARM uses a ray tracing-
based pipeline for high-fidelity content delivery. It
also employs megatextures with an object-space tex-
ture representation, allowing server-side computation
to be amortised across multiple clients. Furthermore,
DARM utilises coarse megatextures on the client,
making it truly robust to network quality fluctuations,
sharp camera turns and movements.
3 METHOD
Figure 2 illustrates the processes executing on the
server and client components and the data flow be-
tween them. The server loads the scene, parame-
terises it into a megatexture and launches a rendering
thread and a streaming thread. The rendering thread
is responsible for progressively updating the mega-
texture. The streaming thread retrieves data from
the megatexture and streams it to a connected client.
When a client connects, it receives meta information
about the texture atlas, such as the atlas dimensions in
tiles, the camera’s initial position and orientation, and
video decoder parameters. Scene information is re-
ceived as a set of triangle primitives (vertices and tex-
ture coordinates into the megatexture) together with
meta information associating objects with primitives
and identifying whether an object is static or dynamic.
The client also receives a list of the dynamic lights,
for the express purpose of user manipulation.
Atlas Shrugged: Device-agnostic Radiance Megatextures
257

Figure 3: Parameterisation process from object space to texture space.
3.1 Parameterisation
To project each scene object or shape onto the 2D tex-
ture atlas (the megatexture) without overlapping ver-
tices, each shape is broken down into one or more
patches (see Figure 3). A connectivity graph is first
constructed for each shape, with each graph node rep-
resenting a triangle. The connectivity graph identifies
the adjacent edges of the shape’s triangles. The trian-
gles are categorised into 6 bins according to the maxi-
mal component of the triangle’s normal along the pos-
itive and negative x-, y- and z-axes. Connected trian-
gles that are placed in different bins are disconnected.
Each bin now contains one or more patches which
are then parameterised using Least Squares Confor-
mal Maps (L
´
evy et al., 2002). The oriented bounding
box of the patch is calculated and the patch is rotated
so that it is aligned with the x- or y-axis; this results in
better packing within the texture atlas in a later step
(see Section 3.2). The parameterised coordinates of
the triangles making up the patch are translated so
that the minimal x and y coordinates of the patch’s
axis-aligned bounding box become zero. Finally, the
patch is scaled so that the area of the triangles making
up the patch is equal to the total area of the original
(unprojected) triangles in order to retain relative scale
between patches.
3.2 Packing
Prior to actually packing the patches in the megatex-
ture, the dimensions of the atlas in world units are
calculated. The width of the atlas is set to the square
root of the total area of all the patches generated in
the parameterisation stage. The collection of patches
is sorted by decreasing bounding box height, and the
patches are placed, in order, into the atlas along the x-
axis. As soon as a patch is encountered that is too
wide to fit in the current “row”, a new row is cre-
ated above the current row, the “x” coordinate is reset
to zero and the “y” coordinate is incremented by the
maximal bounding box height in the current row (the
height of the bounding box of the first patch in the
row). When all patches are processed, the “y” coor-
dinate is incremented one final time. The resulting
value is the height of the atlas.
The resolution of the megatexture impacts the
quality of the scenes rendered. The actual resolution
in pixels per world unit of the megatexture is deter-
mined by a configuration parameter, q. The atlas di-
mensions in world coordinates are multiplied by q in
order to calculate the atlas dimensions in pixels. The
atlas is partitioned into 32 × 32 pixel tiles and the at-
las dimensions (in pixels) are rounded up to the near-
est tile. The minimal atlas dimension is set equal to
the maximal dimension so that the atlas is a square,
matching the shape of texture space, a one-by-one
square; this ensures that the content of the atlas does
not appear distorted. The atlas dimensions (in pixels)
are rounded up to the nearest power of two; this is
needed for correct sampling from the atlas. Finally,
storage for the atlas is allocated as a memory-mapped
file.
The patches are next packed into the atlas and tex-
ture coordinates computed. For each triangle in a
patch, an affine transform between the original trian-
gle’s barycentric coordinates and the texture coordi-
nates within the atlas is computed. After a rendering
pass (see Section 3.3) this mapping is used to populate
the atlas with shading information.
3.3 Atlas Shading
The rendering backend can use any rendering tech-
nique - rasterisation, Whitted-style ray tracing, path
tracing, etc. In our system we used ray-based tech-
niques. The scene is rendered at a configured frame-
buffer resolution using the current camera parameters.
The radiance at each pixel is computed and informa-
tion about the primary hits is recorded, specifically
the index of the triangle primitive, the barycentric co-
ordinates of the hit point and a flag indicating whether
the material at the hit point is specular or not. This in-
formation, together with the mapping mentioned in
Section 3.2, is used to locate the corresponding pixel
in the atlas. For non-specular materials, new radiance
GRAPP 2020 - 15th International Conference on Computer Graphics Theory and Applications
258
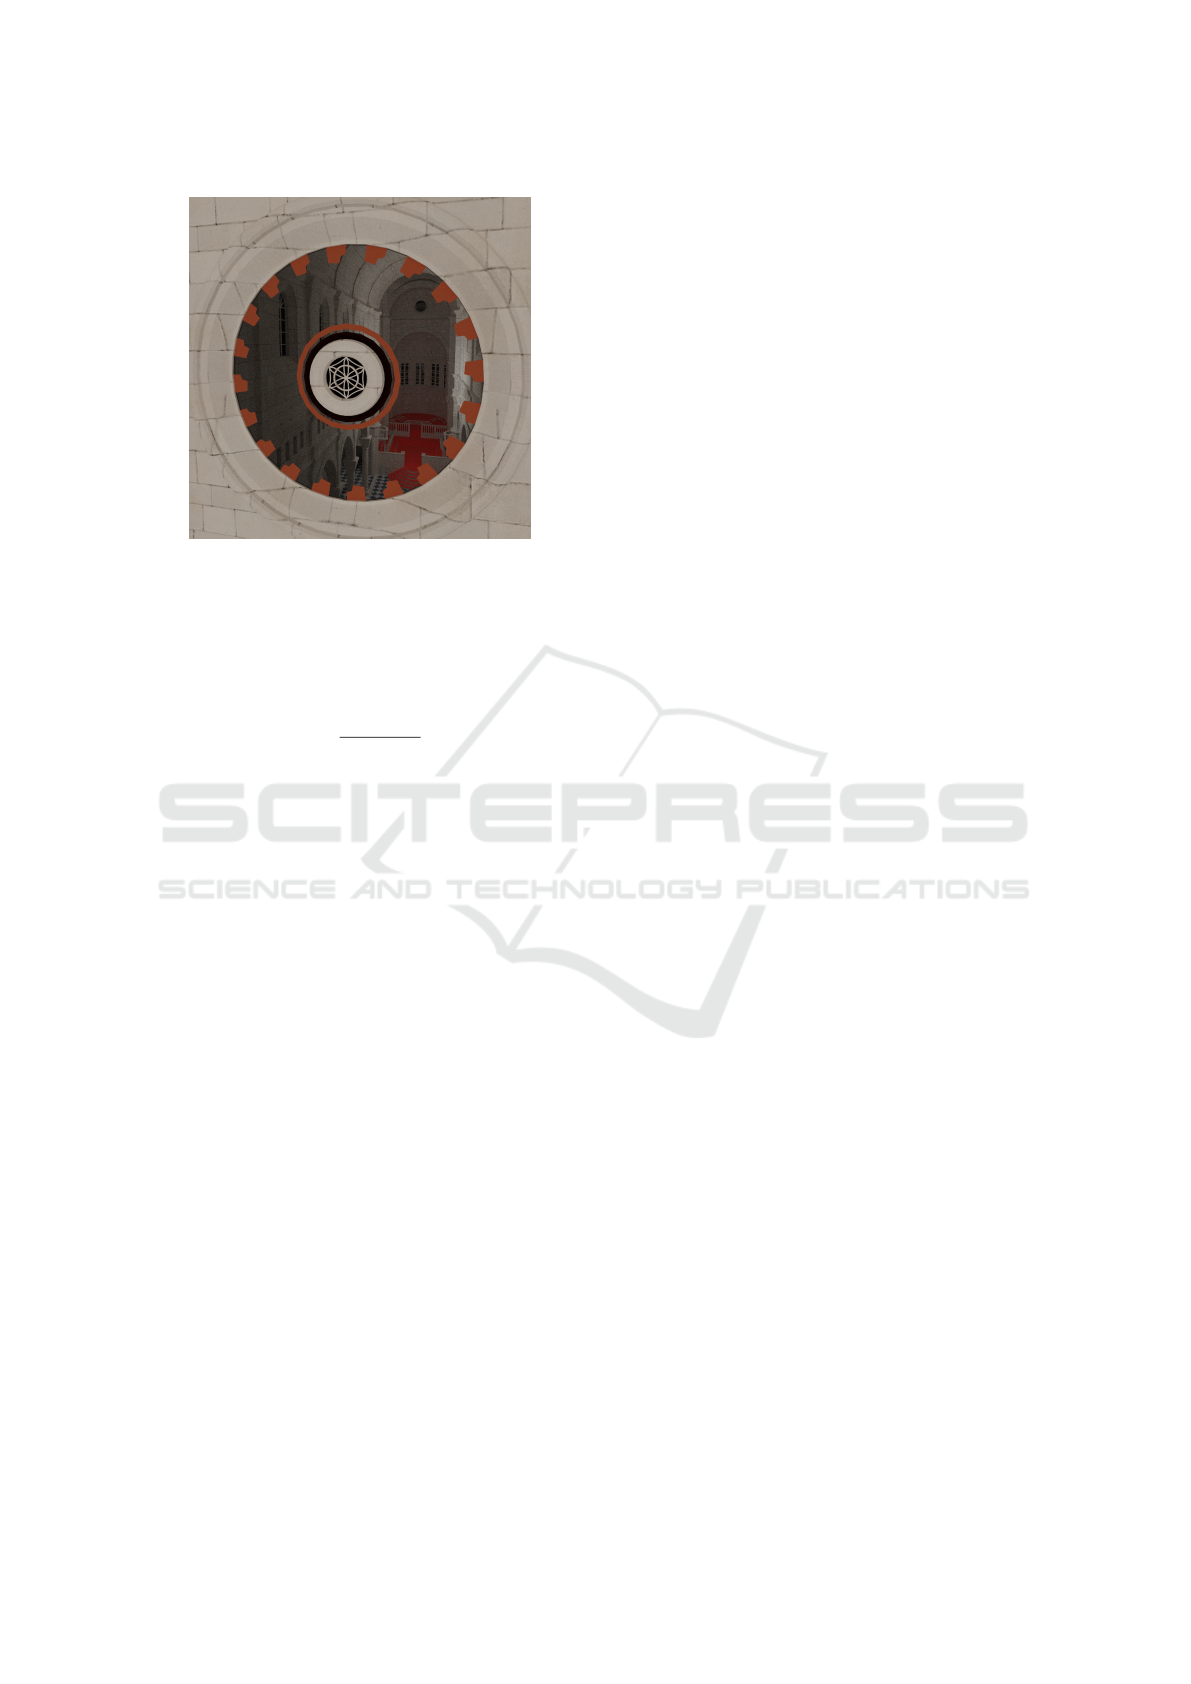
Figure 4: Reflection.
values do not overwrite the old values but are accu-
mulated using Welford’s method so that a running av-
erage is maintained:
M
1
= x
1
,
M
k
= M
k−1
+
x
k
− M
k−1
k
, ∀k > 1,
where M
k
is the new mean, M
k−1
is the old mean, x
k
is
the new sample and k is the total number of samples.
For specular materials, the radiance value is accumu-
lated only if the viewpoint has not changed; otherwise
the existing value is overwritten. If the scene changes
due to dynamic lights or objects, the entire atlas is in-
validated. Rigid body transforms on objects do not
invalidate the mappings between the original triangle
primitives and the associated parameterised triangles.
3.4 The Physical and Pagetable
Textures
The atlas pixel coordinates obtained in Section 3.3 de-
termine which tiles within the atlas are currently visi-
ble. These tiles are used to construct a texture that will
be streamed to the client. We follow the nomenclature
used in (Barrett, 2008) and (Obert et al., 2012) and
refer to this texture, PhysTex, as the physical texture.
A typical physical texture is illustrated in Figure 1.
A second texture, PageTex, the pagetable texture, is
used to map atlas texture coordinates to texture co-
ordinates in the physical texture; this texture is also
communicated to the client, in sync with the physical
texture.
When the physical texture is populated, care is
taken to preserve temporal coherence as much as pos-
sible; this enables better compression by the stream
encoder (see Section 3.6). Therefore, if a tile that was
already in the physical texture is still visible, its po-
sition is retained. Newly visible tiles are added until
the physical texture is full. When there is no avail-
able space to store new tiles, those that are no longer
visible (if any) are removed. Tiles are removed using
a least recently used eviction policy. If the number
of visible tiles exceeds the capacity of the physical
texture, some tiles do not make it into the physical
texture and hence are not streamed to the client. This
issue is mitigated by the use of a downsampled mega-
texture, CoarseTex (see Section 3.5). Tile availability
within the physical texture is also encoded into the
pagetable texture.
3.5 Client Rendering
The client renders the mesh using rasterisation tech-
niques. An extremely simple vertex shader is used
where vertices are multiplied by the model, view
and projection matrices, and the texture coordinates
are passed on to the fragment shader. The frag-
ment shader makes use of the PhysTex, PageTex and
CoarseTex textures. CoarseTex is a local cache of
the server’s megatexture (albeit at a much smaller res-
olution) that fits comfortably in the client’s VRAM.
When the client receives an update (a set of pagetable
texture modifications together with the physical tex-
ture), a coarse representation of each tile in the phys-
ical texture is stored in CoarseTex. The fragment
shader samples PageTex to obtain texture coordinates
into PhysTex. If the required PhysTex tile is miss-
ing, shading information is sampled from CoarseTex
instead.
3.6 Communication
PageTex and PhysTex are continuously communi-
cated to the client over TCP. In order to min-
imise bandwidth requirements, only modifications to
the PageTex mappings are transferred. Moreover,
PhysTex is transferred as an H.264 stream, encoded
in hardware using NVIDIA’s Video Codec SDK. The
rate at which updates are sent can be throttled to adjust
for network and client capabilities. Similarly, when
possible, clients use hardware-accelerated decoding.
The client controls camera movement and any dy-
namic entities in the scene (lights and objects). These
updates are communicated to the server over UDP.
4 RESULTS
Several experiments were carried out to determine the
effectiveness of DARM in delivering responsive high-
Atlas Shrugged: Device-agnostic Radiance Megatextures
259
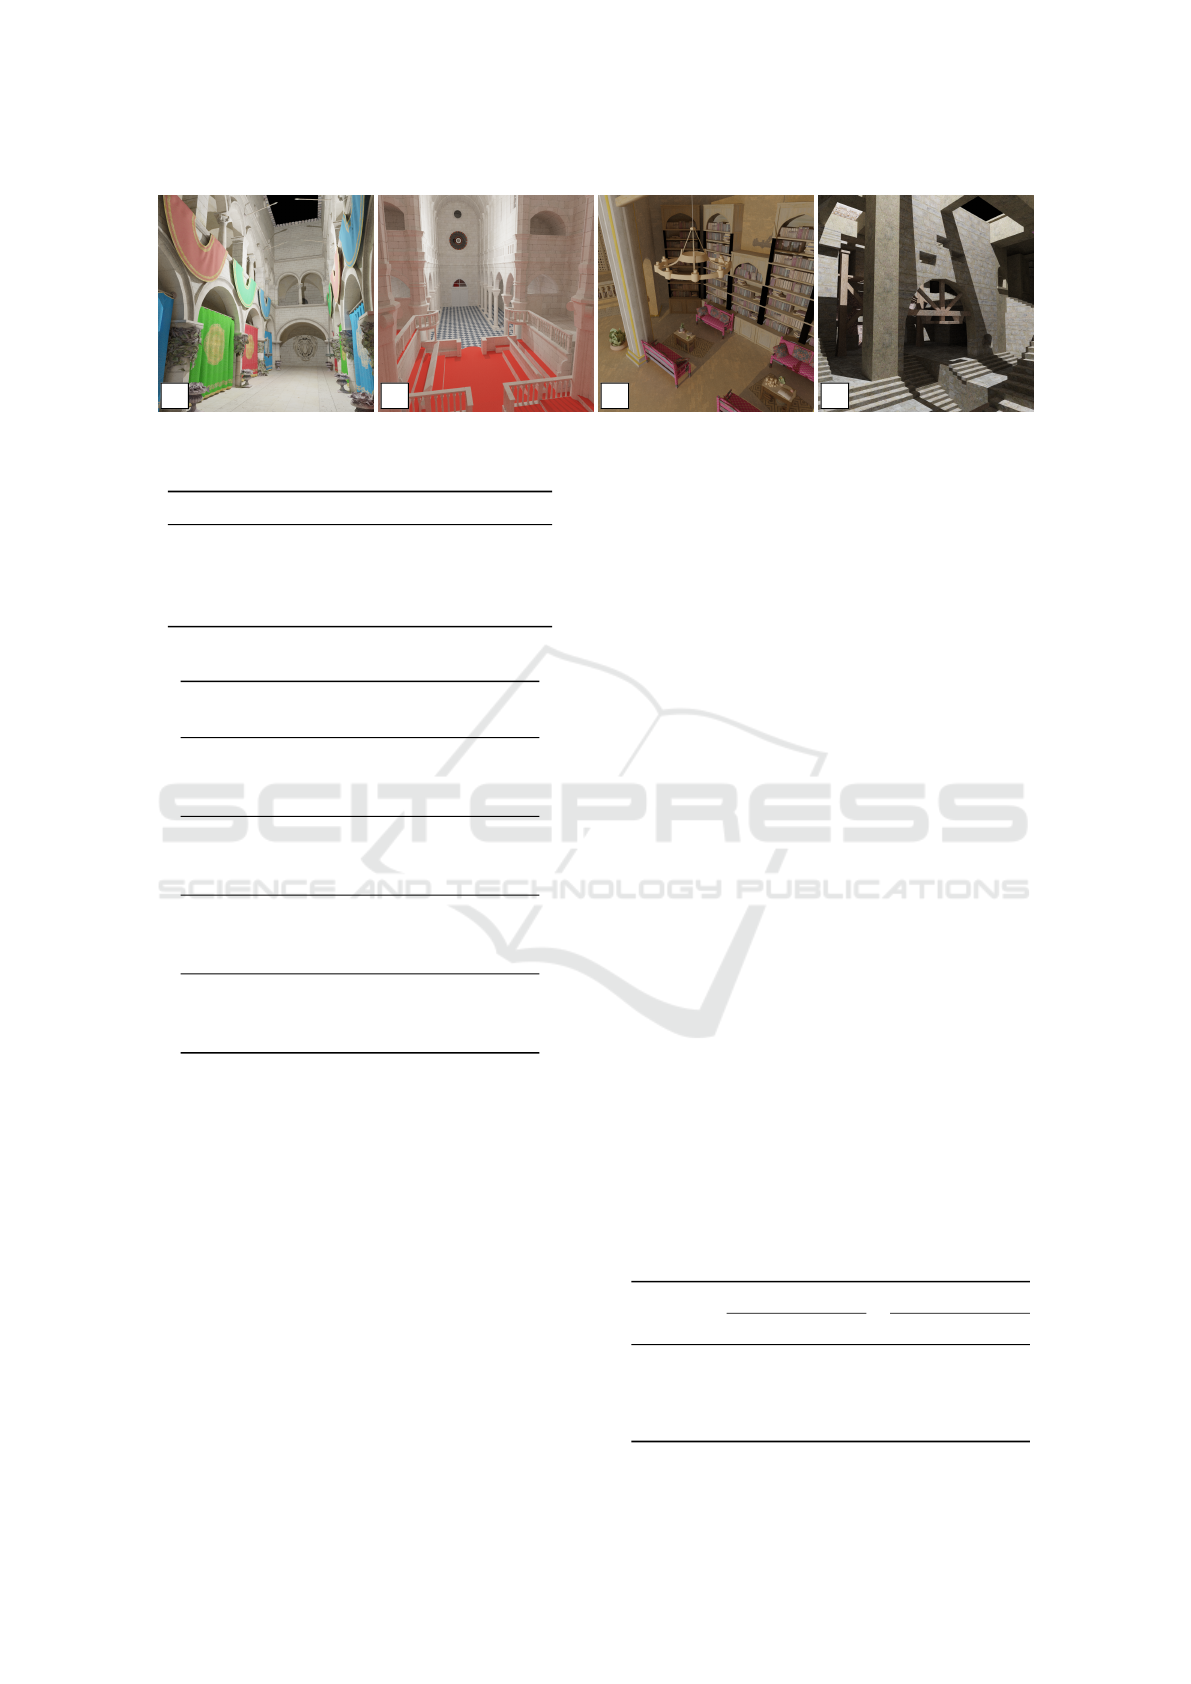
S
0
S
1
S
2
S
3
Figure 5: The scenes used for the evaluation.
Table 1: Scene properties.
Scene Name Triangles Patches
S
0
Crytek 262,265 14,116
S
1
Sibenik 75,268 9,046
S
2
Sun Temple 542,629 73,519
S
3
Quake 36,949 9,053
Table 2: Atlas configurations.
Scene Quality Occupancy Size
(%) (GB)
S
0
128 50.40 178.65
S
0
64 50.14 44.70
S
0
32 50.04 11.20
S
1
128 42.80 53.56
S
1
64 42.50 13.42
S
1
32 42.32 3.36
S
2
128 53.78 58.15
S
2
64 52.98 14.60
S
2
32 52.18 3.68
S
3
128 80.95 56.42
S
3
64 80.82 14.11
S
3
32 80.69 3.53
fidelity rendering to a variety of resource-constrained
client devices. The construction/updating of PhysTex
and the encoding of the video stream with respect to
megatexture quality settings were measured on the
server side whereas memory utilisation and render-
ing frame rates were measured on the client side. The
server consists of a high-end desktop equipped with a
Core i9-9900K CPU, an RTX 2080 Ti GPU and 32GB
DDR4 RAM. Four client devices are used (see Ta-
ble 6). The scenes illustrated in Figure 5 were used
for the experiments. The number of triangles and the
number of parameterisation patches for these scenes
is shown in Table 1.
4.1 Server Performance
As the pixels per world unit q increase, the size of
the megatextures generated by the server increases as
illustrated in Table 2 and goes beyond the available
32GB of RAM. Whereas increasing q has an impact
on the rendering quality (see Figure 6), this will also
increase the time taken for the renderer to write to
the megatexture and the streaming process to build
the PhysTex texture which is sent over the network.
Table 3 illustrates the mean and standard deviation
for physical texture build times (in ms) when q is set
to 32, 64 and 128 pixels per world unit. Whereas
for q values of 32 (megatexture fits in memory) and
64 (megatexture mostly fits) build times are reason-
able and in a number of cases very good, when q is
set to 128, paging sometimes resulted in very slow
build times. Encoding times depend on the resolu-
tion of PhysTex and are on average 9.89 ms and 3.72
ms across all scenes when the resolutions are set to
2048 × 2048 and 1024 × 1024 pixels respectively.
Build times are also influenced by the number of vis-
ible tiles in the current frame. The larger this number,
the more work needs to be done, thus not favouring
scenes which consist of large open areas.
Table 2 also shows the occupancy of the gener-
ated maps for the four scenes. These results show
that on average, 51% occupancy is achieved through
our parameterisation and packing method for scenes
S
0
and S
2
, whereas for S
1
, occupancy is 42% of the
megatexture surface. In the case of S
3
, occupancy is
much better (80%) since the scene is mostly made up
of rectangular surfaces.
Table 3: Physical texture build times (ms).
Scene
µ σ
32 64 128 32 64 128
S
0
30 61 150 18 12 30
S
1
32 57 136 16 11 52
S
2
46 41 123 4 17 29
S
3
24 46 94 13 13 9
GRAPP 2020 - 15th International Conference on Computer Graphics Theory and Applications
260
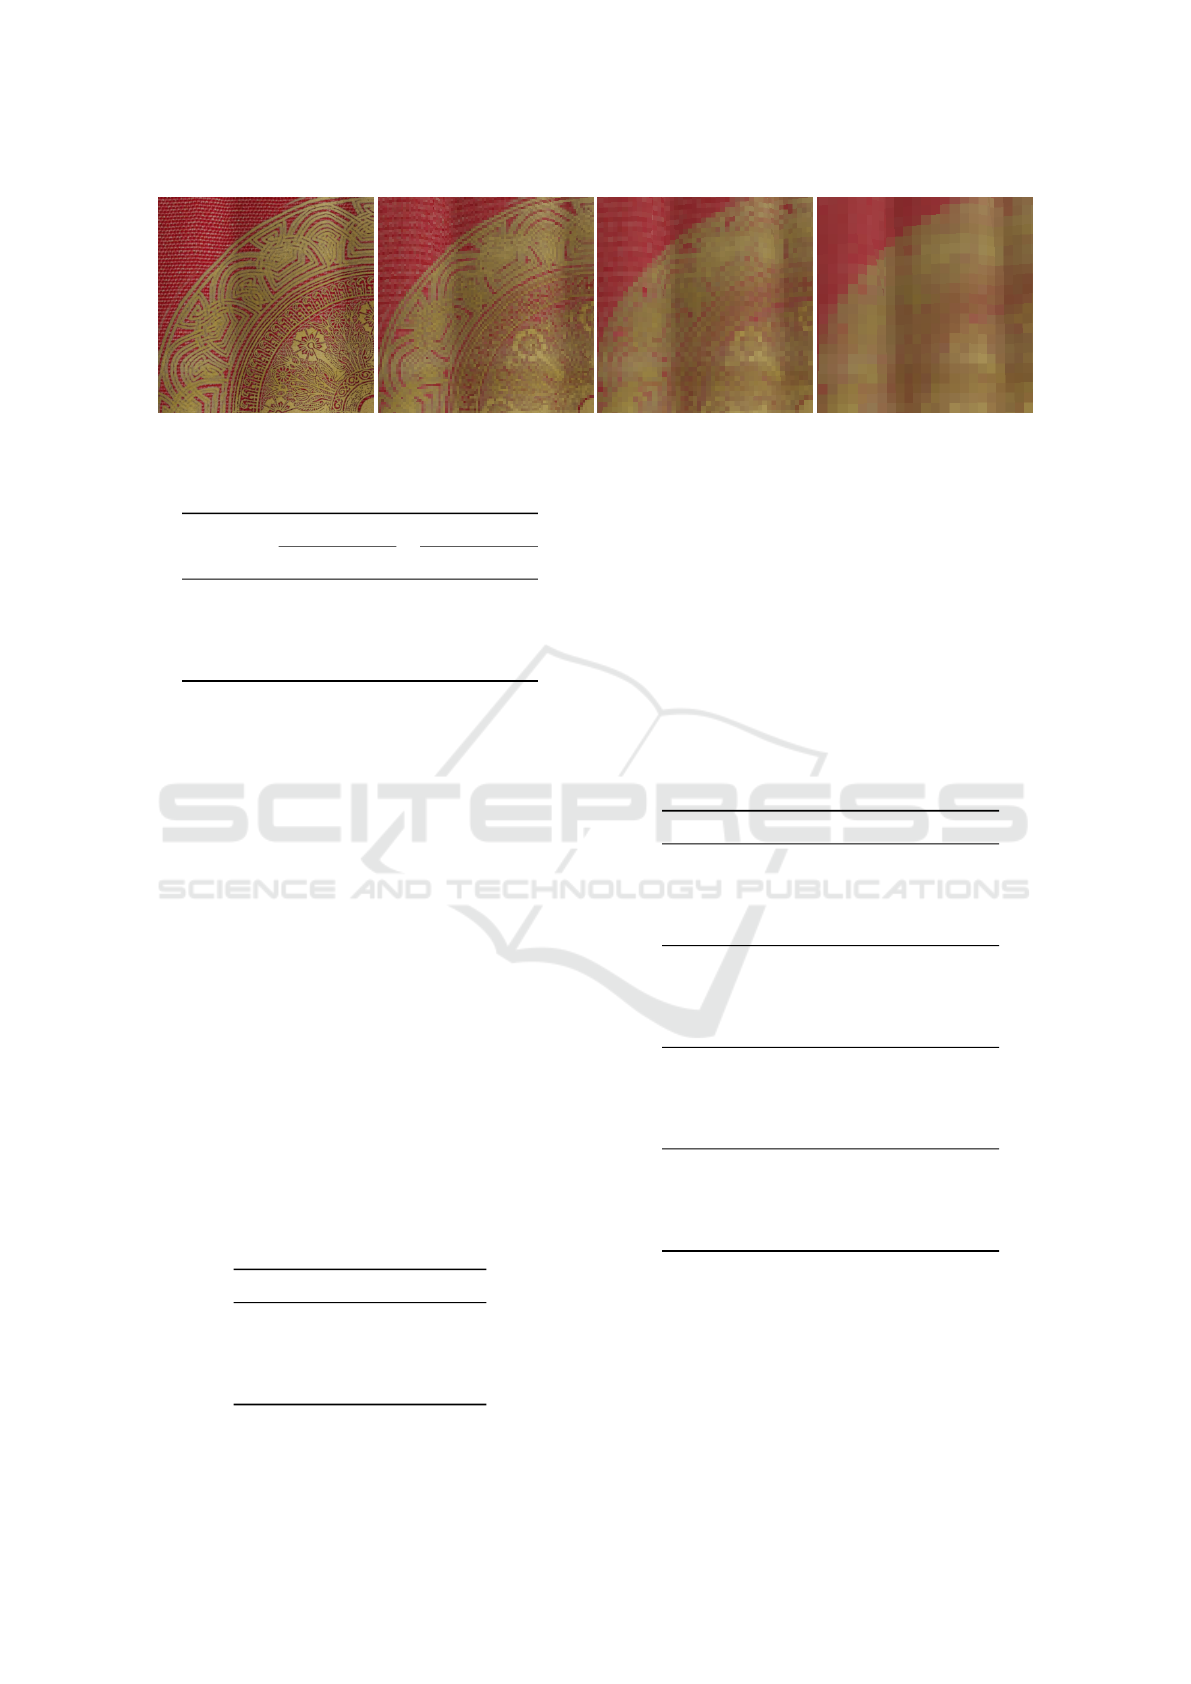
Figure 6: From left: Path traced image followed by DARM images with different quality settings (128, 64 and 32 pixels per
world unit).
Table 4: Bandwidth (Mbps).
Scene
µ σ
1K 2K 1K 2K
S
0
2.08 1.83 1.35 1.43
S
1
3.38 4.92 1.92 2.82
S
2
5.41 9.40 1.71 1.88
S
3
7.11 9.29 3.90 5.59
4.2 Network Results
Network bandwidth consumption for DARM was
measured by averaging and recording throughput over
20-second preset walkthroughs in all scenes. Table 4
illustrates the mean and standard deviation for the
bandwidth requirements for the test scenes. Band-
width correlates very closely to the changes incurred
between frames in the streamed PhysTex. When
PhysTex does not change substantially in terms of
tiles layout, the H.264 encoder is able to minimise the
amount of data communicated to the client. Changes
to PhysTex are also correlated to the number of visible
tiles, since tiles in PhysTex are evicted and re-inserted
more frequently.
4.3 Image Quality
The image quality at q = 32 for a specific camera
viewpoint in each of the test scenes was compared
against path traced ground truth using the PSNR and
MSSIM metrics (see Table 5.)
Table 5: Image quality.
Scene PSNR MSSIM
S
0
29.8574 0.9831
S
1
32.2339 0.9857
S
2
30.9392 0.9852
S
3
29.2495 0.9858
4.4 Client Performance
Client performance was measured by averaging
frames per second over a 20-second walkthrough in
each scene (see Table 6). In all cases, server updates
were fixed to 10 updates per second. The Raspberry
Pi 4 performed worst possibly due to software decod-
ing of the H.264 stream. In all other cases, video de-
coding was hardware-accelerated. PhysTex resolution
was 2048 ×2048. CoarseTex quality was set to 8 pix-
els per world unit; this equated to 16 MB for scenes
S
0
, S
1
and S
3
and 64 MB for scene S
2
.
Table 6: Client performance at 1080p.
Client Scene FPS
C
0
S
0
31
S
1
28
Ultrabook S
2
16
Intel Core i7-5500U S
3
28
C
1
S
0
7
S
1
8
Raspberry Pi 4 S
2
7
S
3
8
C
2
S
0
50
S
1
48
Smartphone (Android) S
2
36
Snapdragon 835 S
3
50
C
3
S
0
204
Laptop S
1
181
Intel Core i7-6700HQ S
2
182
GTX970M GPU S
3
190
5 CONCLUSION
Although DARM results are promising, there is still
room for improvement. Perhaps, the greatest bottle-
neck to image quality and performance is thrashing
in the physical texture. This mostly happens when
Atlas Shrugged: Device-agnostic Radiance Megatextures
261

scenes cover vast open spaces; since the system does
not discriminate texture tiles by view distance, a large
number of distant tiles that occupy a relatively small
area of the image plane may quickly fill the physi-
cal texture. If the physical texture size is limited (as
would be the case with memory-limited devices), a
single view may end up requiring a number of tiles
larger than the capacity of the physical texture, caus-
ing the system to start thrashing. A problem that is
also closely tied to an overburdened physical texture
is that of lack of fairness in tile selection; in some
cases, it may be possible for the system to consistently
fail to fully construct a view, essentially starving parts
of the megatexture. This is because there is no mech-
anism in place to guarantee that a tile that is in view
will eventually find its place in the physical texture
when the latter’s size is constrained. Thus, the next
evolution for DARM is that of providing a multi-level
physical texture, taking advantage of a tile’s distance
from the observer and thus reducing its area and trans-
fer footprint. This would also mitigate the problem
with tile selection fairness. We would also like to in-
vestigate a multi-level coarse megatexture and reduce
the seams that sometimes appear when the latter is
used.
In terms of system architecture and implementa-
tion, we would like to rewrite server updates, replac-
ing TCP by RTP over UDP, for a more streamlined
and performant approach. Furthermore, not all parts
of DARM are optimised to make full use of paral-
lelism where available; for instance, the population
of the physical texture is still executed as a sequen-
tial process and can easily benefit from parallelisa-
tion. Finally, even though the response lag experi-
enced through the system is minimal, we would like
to devise a test to accurately measure input and out-
put lag (how shading carried out by the remote server
appears to trail geometry updates carried out locally),
both objectively and perceptually.
REFERENCES
Barrett, S. (2008). Sparse Virtual Textures. In Talk at Game
Developers Conference.
Carr, N. A. and Hart, J. C. (2002). Meshed Atlases for Real-
Time Procedural Solid Texturing. ACM Transactions
on Graphics (TOG), 21(2):106–131.
Hladky, J., Seidel, H.-P., and Steinberger, M. (2019). Tes-
sellated Shading Streaming. Computer Graphics Fo-
rum.
Hollemeersch, C., Pieters, B., Lambert, P., and Van de
Walle, R. (2010). Accelerating Virtual Texturing us-
ing CUDA. GPU Pro: Advanced Rendering Tech-
niques, 1:623–641.
L
´
evy, B., Petitjean, S., Ray, N., and Maillot, J. (2002). Least
Squares Conformal Maps for Automatic Texture At-
las Generation. In ACM Transactions on Graphics
(TOG), volume 21, pages 362–371. ACM.
Mittring, M. et al. (2008). Advanced Virtual Texture Top-
ics. In ACM SIGGRAPH 2008 Games, pages 23–51.
ACM.
Mueller, J. H., Voglreiter, P., Dokter, M., Neff, T., Makar,
M., Steinberger, M., and Schmalstieg, D. (2018).
Shading Atlas Streaming. In SIGGRAPH Asia 2018
Technical Papers, page 199. ACM.
Obert, J., van Waveren, J., and Sellers, G. (2012). Virtual
Texturing in Software and Hardware. In ACM SIG-
GRAPH 2012 Courses, page 5. ACM.
Ray, N., Nivoliers, V., Lefebvre, S., and L
´
evy, B. (2010).
Invisible Seams. In Computer Graphics Forum, vol-
ume 29, pages 1489–1496. Wiley Online Library.
Tanner, C. C., Migdal, C. J., and Jones, M. T. (1998). The
Clipmap: A Virtual Mipmap. In Proceedings of the
25th Annual Conference on Computer Graphics and
Interactive Techniques, pages 151–158. ACM.
van Waveren, J. (2009). id Tech 5 Challenges - From Tex-
ture Virtualization to Massive Parallelization. Talk in
Beyond Programmable Shading course, SIGGRAPH,
9:5.
van Waveren, J. (2012). Software Virtual Textures.
GRAPP 2020 - 15th International Conference on Computer Graphics Theory and Applications
262
