
Learning Human Behaviour Patterns by Trajectory and Activity
Recognition
Let
´
ıcia Fernandes
1
, Mar
´
ılia Barandas
1
and Hugo Gamboa
1,2
1
Associac¸
˜
ao Fraunhofer Portugal Research, Rua Alfredo Allen 455/461, 4200-135 Porto, Portugal
2
Laborat
´
orio de Instrumentac¸
˜
ao, Engenharia Biom
´
edica e F
´
ısica da Radiac¸
˜
ao (LIBPhys-UNL), Departamento de F
´
ısica,
Faculdade de Ci
ˆ
encias e Tecnologia da Universidade Nova de Lisboa, Monte da Caparica, 2829-516 Caparica, Portugal
Keywords:
Human Behaviour, Pattern Recognition, Anomaly Detection, Ambient Assisted Living, Probability Density
Function, Clustering.
Abstract:
The world’s population is ageing, increasing the awareness of neurological and behavioural impairments that
may arise from the human ageing. These impairments can be manifested by cognitive conditions or mobility
reduction. These conditions are difficult to be detected on time, there is a lack of routine screening which
demands the development of solutions to better assist and monitor human behaviour. This study investigates
the question of what we can learn about human behaviour patterns from the rich and pervasive mobile sensing
data. Data was collected over 6 months, measuring two different human routines through human trajectory
analysis and activity recognition comprising indoor and outdoor environment. A framework for modelling hu-
man behaviour was developed using human motion features, extracted with and without previous knowledge
of the user’s behaviour. The human patterns were modelled through probability density functions and cluster-
ing approaches. Using the learned patterns, inferences about the current human behaviour were continuously
quantified by an anomaly detection algorithm where distance measurements were used to detect significant
changes in behaviour. Experimental results demonstrate the effectiveness of the proposed framework that
revealed an increased potential to learn behavioural patterns and detect anomalies.
1 INTRODUCTION
The increase in life expectancy leads to the ageing
population growing worldwide. According to United
Nations (United Nations, 2017), the global popula-
tion over 60 years is expected to double in 2050. As
a consequence, common health conditions associated
with ageing and that affects human behaviour, such as
physical declining, psychological and cognitive alter-
ation are increasing.
Physical declining of elderly people is observed
through the decrease of walking speed, mobility dis-
ability that is associated with falls and difficulty in
performing activities of daily living. Whereas, cog-
nitive alterations, that includes cognitive ageing, de-
mentia and depression are more difficult to be de-
tected in early stages of the disease (Jaul and Bar-
ron, 2017). For example, early symptoms of demen-
tia, may not be detected by doctors in periodical vis-
its, given that there is a lack of routine screening.
The role of the caregiver is very important for the
early diagnosis of these health conditions. However,
a significant portion of these people live alone (Evans
et al., 2016), and it may be difficult to either detect
and monitor the disease, leading to its progression.
Thus, a reliable tool for learning more about the per-
son’s daily living, helping the diagnosis and following
up these impairment, is needed. The assessment of
human behaviour is the basis for understanding peo-
ple’s needs and problems, helping them improve their
lives. With the widespread of technology, specifically
smartphones, it is possible to recognise human mo-
tions and to monitor human daily routines, since they
possess multiple accurate sensors to better assist hu-
mans in a cost-effective and unobtrusive way.
2 RELATED WORK
In the past years, studies are approaching the chal-
lenge of learning human motion patterns and anoma-
lies detection on those patterns.
Zheng et al. (Zheng et al., 2019) proposed a
heuristic method combining Dynamic Time Warping
220
Fernandes, L., Barandas, M. and Gamboa, H.
Learning Human Behaviour Patterns by Trajectory and Activity Recognition.
DOI: 10.5220/0008953902200227
In Proceedings of the 13th International Joint Conference on Biomedical Engineering Systems and Technologies (BIOSTEC 2020) - Volume 4: BIOSIGNALS, pages 220-227
ISBN: 978-989-758-398-8; ISSN: 2184-4305
Copyright
c
2022 by SCITEPRESS – Science and Technology Publications, Lda. All rights reserved

(DTW) and Earth Mover’s Distance (EMD) to un-
derstand tourist mobility through the measurement of
trajectory similarity. The resulting method proved to
be accurate and noise resistant. A study conducted
by Tomforde et al. (Tomforde et al., 2018) devel-
oped models to learn the user’s behaviour in a health
enabling living environment equipped with multiple
sensors. The user’s location and activity sequences
were detected and used to train two multinomial Hid-
den Markov Models (HMM) with the normal course
of the user’s days. The resulting log-likelihood of
the HMM were modelled into a Kernel Density Es-
timate (KDE) to signalise a deviation from the ex-
pected normal behaviour pattern. Rahim et al. (Rahim
et al., 2015) developed a context-aware change de-
tection model using machine learning and statistical
models. The authors created a HMM to detect anoma-
lies in sequences of daily activities in an ambient as-
sisted living. To detect behavioural changes related to
the time duration and frequency of activities, a statis-
tical model measuring gaussian distribution of activi-
ties was used. Suzuki et al. (Suzuki et al., 2007) pro-
posed an unsupervised learning method to learn mo-
tion patterns and detect anomalies by the analysis of
human trajectory recorded in a real store by cameras.
Although there are some studies in the literature
about modelling human behaviour, the people’s be-
haviour changes are often hard to quantify. Moreover,
the aggregation of both activity recognition and tra-
jectory analysis remains relatively unexplained. Fur-
thermore, most of the studies that found patterns by
activity recognition rely on the installation of sensors
around the home, which presents higher installation
and maintenance cost compared to the use of smart-
phone sensors that are going to be used in this study.
Finally, the possibility to detect and quantify anoma-
lies in humans routines by continuously learning daily
patterns will be evaluated.
3 PROPOSED METHOD
The developed framework for modelling human mo-
tion behaviour patterns exploits the human motion by
trajectory and activity recognition, effectively captur-
ing both indoor and outdoor environment. The fol-
lowing subsections are divided into the three frame-
work steps. The first step (Section 3.1) describes
the methods applied for the feature extraction along
each day, the second step (Section 3.2) uses the ex-
tracted features from a set of days to learn patterns,
and the last step (Section 3.3) describes the process
for anomaly detection using the previously detected
patterns and features from a specific day.
3.1 Feature Extraction
The extraction of relevant features of human motion
patterns comprises features extracted with and with-
out previous knowledge of the user’s behaviour, de-
pending on the available information.
3.1.1 Without Previous Knowledge
The extracted features from human behaviour without
previous knowledge refers to all features that may be
extracted without any previous annotation. Extracted
features can be grouped by the type of information
source used and are divided into the outdoor trajec-
tory, Dead Reckoning (DR) and locomotion activities.
The outdoor trajectory is extracted through Global
Positioning System (GPS). Since GPS accuracy is re-
duced near buildings, a threshold based algorithm was
developed to overcome GPS inaccuracies and remove
GPS outlier points with inconsistent velocities.
From the corrected GPS signal, the following fea-
tures were computed: mean and maximum veloc-
ity (m/s), mean and maximum altitude variation (m),
walking distance (m) and walking time (min).
To learn mobility patterns that can not be mea-
sured using GPS measurements, DR techniques were
used to extract metrics from the step detection and its
estimated length. The DR algorithm implemented in
this framework was developed by (Guimar
˜
aes et al.,
2016). The output features from this algorithm were:
number of steps and mean step length (m).
For the recognition of locomotion activities such
as walking, standing, walking up and walking down,
a machine learning classifier was used. For this
recognition a Decision Tree (DT) classifier was im-
plemented using only accelerometer and barometer
signals, re-sampled to 30 Hz and segmented into
equal-sized 5 second windows. The feature extraction
process was based on Time Series Feature Extrac-
tion Library (TSFEL) library
1
and the selected fea-
tures (Standard deviation of acceleration magnitude,
barometer linear regression, mean y-axis accelera-
tion, the total number of peaks of x-axis acceleration
and standard deviation of y-axis acceleration) arise
from the implementation of a Feed-Forward Fea-
ture Selection (FFFS) algorithm using 10-fold cross-
validation. The DT classifier ended up with an accu-
racy of 90.2%.
Regarding the extracted features using this loco-
motion classifier, its predictions are used to calculate
the percentage of time each activity is being per-
formed. This percentage is calculated by equation 1.
1
Available in https://github.com/fraunhoferportugal/tsfel
(visited on 03/09/2019)
Learning Human Behaviour Patterns by Trajectory and Activity Recognition
221

t
activity
(%) =
∆t
activity
∆t
route
× 100 (1)
Where ∆t
activity
represents the activity duration
along all route and ∆t
route
correspond to the route du-
ration. Thus, the output features are the percentage
time of each locomotion activity: walking (%), stand-
ing (%), walking up (%) and walking down (%).
3.1.2 With Previous Knowledge
Feature extraction with previous knowledge occurs
when there is previous knowledge about the user, such
as, the location and complex activities.
Location, in indoor environments, is used to un-
derstand the user’s room preferences that may be as-
sociated with routine activities. In this study, a room-
level indoor location solution with a fast deployment,
that relies on Wi-Fi Received Signal Strength Indica-
tor (RSSI) measurements to recognise in which room
the user is located, was implemented. The training
process starts with recording data in each room sepa-
rately. Using the unique IDs from Access Point (AP)
and the corresponding signal strength, a statistical
classifier is trained and the prediction step is based on
the highest probability. The algorithm output includes
the labels of the predicted rooms over time. Thus, it
is possible to extract some relevant metrics for find-
ing patterns in human behaviour, namely: Times of
Interest (TOI) (min), corresponding to the time spent
in each location, and number of times the user goes
into each room.
The recognition of complex activities involves a
deeper knowledge about the user being studied. For
this reason, depending on the user and also on the
characteristics of the routine being analysed, a per-
sonalised training process is required. For this train-
ing process, a set of activities is selected, and the user
must perform each activity several times beforehand.
Alternatively, during his/her routine the annotation of
activities can be done and used for training after a few
days. The output features from classifier are the dura-
tion, in minutes, of each performed activity.
HMM is an effective method for finding pat-
terns (Rabiner, 1989). In this study, HMM are used
to evaluate the probability of a given sequence of lo-
cations and/or activities. A multinomial HMM was
implemented using a number of hidden states that
lead to the highest Bayesian Inference Criterion (BIC)
value (Jeebun et al., 2015). Recurring to HMM the
following features were extracted: activity sequence
log-likelihood and location sequence log-likelihood.
3.2 Pattern Discovery
The pattern discovery step consists in modelling pat-
terns in human behaviour using the extracted features
with and without previous knowledge through proba-
bility density functions and clustering approaches.
Kernel Density Estimate was used to model each
extracted feature, as the probability density function
of the extracted features is unknown. KDE was
firstly defined by Rosenblatt (Rosenblatt, 1956) and
Parzen (Parzen, 1962), the kernel estimate is given by
the sum of the kernel function K placed at each point
of the dataset, as it is defined in equation 2.
ˆ
f (x) =
1
nh
n
∑
i=1
K
x − X
i
h
(2)
Where n is the number of points in the dataset, h is
the bandwidth and K is the kernel function centred on
X
i
with width h. The K used in this study was a Gaus-
sian function. The method defined by Silverman (Sil-
verman, 1982) was used for calculating the optimal
bandwidth (h).
This method was designed to be independent of
the features being used, and all features from the
Feature Extraction step were equally modelled with
KDE. Thus, the process of adding more features to
model a specific routine can be easily introduced in
this framework without changing the pattern discov-
ery method. Depending on the intrinsic characteris-
tics of each feature for a specific user, the modelling
process may need more or less days to learn the pat-
tern of the feature.
Although the majority of features can be modelled
using KDE, other patterns can be learned using spatial
information. For this purpose, clustering methods are
used to find patterns in an unsupervised way, relying
on trajectory similarity and Points of Interest (POI).
Trajectory similarity is measured using
DTW (Zheng et al., 2019). Once trajectory dis-
tance is measured, a distance matrix is computed to
feed as input to a Hierarchical Density-based spatial
clustering of applications with noise (HDBSCAN)
for grouping trajectories into clusters (Zhang, 2018),
with a minimum cluster size of 3. This method is
suitable for this pattern discovery since the final
number of clusters is unknown and it is capable of
dealing with clusters of different densities.
Points of Interest are locations of interest. In
this study, a POI is defined as the location where the
user stands for the minimum time of 1 minute and
occurs in at least 3 different days, within a radius of
50 meters. For the assessment of these locations, the
standing predictions of the locomotion classifier com-
bined with time and spatial information were used.
BIOSIGNALS 2020 - 13th International Conference on Bio-inspired Systems and Signal Processing
222

Figure 1: Learning patterns continuously and anomaly de-
tection fluxogram.
Density-based spatial clustering of applications with
noise (DBSCAN) clustering method (Kumar et al.,
2006) was implemented for POI detection.
3.3 Anomaly Detection
Once motion patterns were defined, the next step of
this framework aimed to detect anomalies on those
patterns. Figure 1 represents the process of anomaly
detection. Firstly, features are extracted from each
day and the behavioural pattern is only defined after a
predefined number of days (day
learn
). When day
learn
is reached, the pattern is learned and the threshold to
detect an anomaly defined. The following days are
evaluated by measuring the distance of each day to
the pattern. To detect an anomaly, the anomalous de-
cision is computed through the evaluation of a prede-
fined number of consecutive days (day
anom
). There-
fore, only if the mean distance along the day
anom
days
are above the threshold an anomaly was detected.
The threshold is initially defined considering the
learned behaviour until day
learn
, and continuously up-
dated along the days. However, if an anomaly is de-
tected, the anomalous distances are not considered to
the model pattern, neither for threshold definition.
Assuming that a specific feature is well modelled
through KDE, we can use the density values from
KDE to assess the feature probability given a prede-
fined feature value. To transform density values to
distance values, we normalised each distribution by
its maximum density value. Therefore, the KDE dis-
tance (KDE
distance
) is a scale from 0 to 1 and we can
assess the level of deviation from pattern through a
quantitative measure given by d
f i
= 1 − KDE
distance
i
.
To combine several features and return an overall
level of anomaly a global distance (Dpattern) is com-
puted by a weighted arithmetic mean. Dpattern is
computed by Equation 3, where d
f i
is the distance to
the pattern of each feature i in a total of n features and
w
f i
are the corresponding weights. Thus, we can de-
fine a weight for each feature to measure the anoma-
lous behaviour.
D
pattern
=
∑
n
i=0
d
f i
× w
f i
∑
n
i=0
w
f i
(3)
The anomalous threshold was defined by equation
4, where all behaviours (b) correspond only to normal
behaviours.
T H = 1.1 × max(b
0
, b
1
, ..., b
m
) (4)
Thus, only the distances to behaviour that are
higher than 10% of the maximum behaviour distance
of the trained model would account as anomalies.
4 EXPERIMENTS
Two different human routines were acquired over a
period of 6 months to analyse human behaviour pat-
terns addressing different challenges ranging from un-
supervised human motion features to the recognition
of complex activities and their sequence in indoor
and outdoor environment, using the developed frame-
work. Data was recorded using a smartphone po-
sitioned on the user’s wrist, including accelerome-
ter, gyroscope, magnetometer, barometer, sound, GPS
and Wi-Fi sensors. The placement of the device was
carefully chosen to be sensitive enough to perceive
human motions in order to recognise predefined com-
plex activities that need to be monitored. In real life
application, the smartphone should be replaced by a
bracelet or smartwatch comprising the needed sensors
to perceive human motion behaviour.
4.1 Human Mobility on Daily Walks
Dataset
This dataset was recorded by User 1 to extract mobil-
ity patterns during the outdoor daily walks of the user,
including more than 30 hours of acquisition time with
normal user behaviour. Aside from the normal rou-
tine days acquired in this dataset, it also comprises
days with planned anomalies reflecting a human that
starts to express reduced mobility, corresponding to 3
hours of anomalous behaviour.
4.1.1 Motion Patterns
The motion patterns were obtained through KDE, tra-
jectory clusters and POI.
Kernel Density Estimate: Using this dataset,
the feature extraction without previous knowledge in-
cludes features from outdoor trajectory, DR and lo-
comotion activities. These extracted features were all
modelled through KDE.
Learning Human Behaviour Patterns by Trajectory and Activity Recognition
223
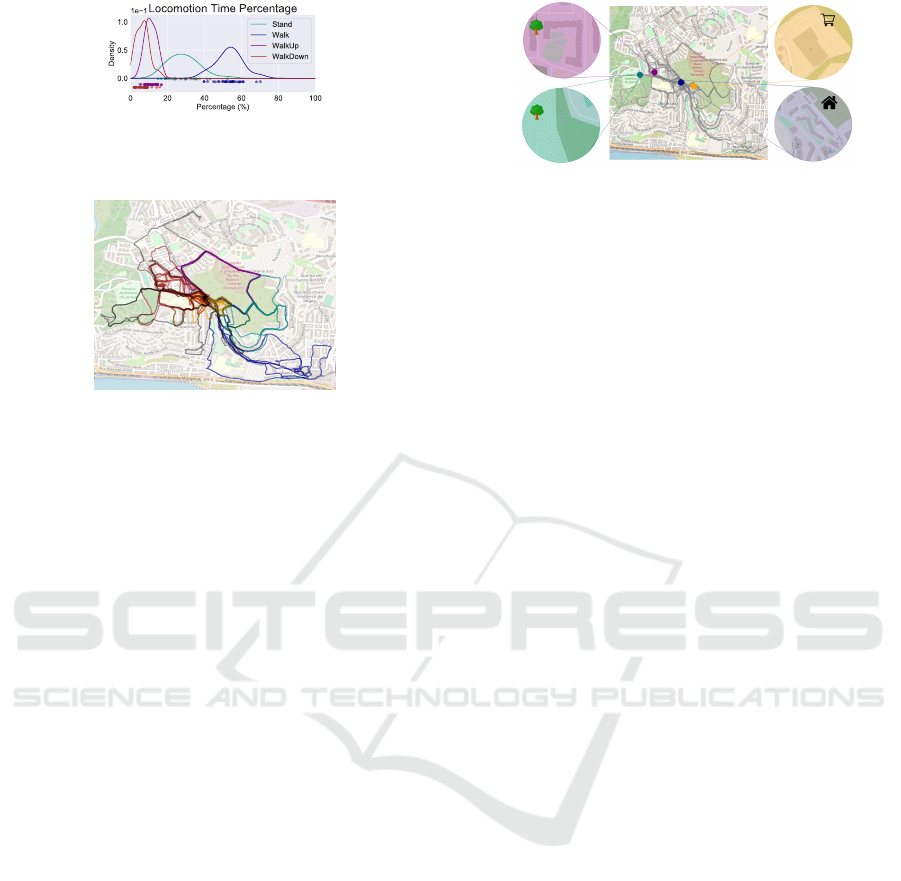
Figure 2: Percentage time distribution while standing, walk-
ing, walking up and walking down coloured in green, blue,
purple and brown respectively.
Figure 3: Representation of the trajectory clusters by spatial
similarity.
The modelled locomotion percentage time distri-
bution is presented in Figure 2. Through the analy-
sis of these distributions, it is obvious that the user’s
most common locomotion mode is walking, although
the user also stops during the daily walk. Although
less commonly, walking up and down also make part
of routine of this user, filling under 20% of the daily
walking.
Regarding walking time and distance from GPS
data, and number of steps and mean step length from
DR, it was possible to validate the estimated distance
values between GPS measurements and step detection
algorithm, since the number of steps follows the same
behaviour of the distance walked by the user.
Trajectory Clusters: A total of 5 clusters were
found in this dataset (see Figure 3) coloured in blue,
brown, orange, purple and green. The black trajecto-
ries correspond to the ones that are not similar to any
of the found trajectory clusters.
Points of Interest: A total of four POI were dis-
covered in User 1 routine, and their locations can be
visualised in Figure 4. Since these POI were not an-
notated, it was asked to the user to validate the ob-
tained POI. All POI represent meaningful locations
to the user, being the blue POI the user’s home, the
orange POI the supermarket and the purple and green
POI two gardens where the user usually stops.
4.1.2 Anomaly Detection
The previous subsection describes how patterns are
discovered considering all normal days of a user’s
daily routine. However, for anomaly detection, the
rules described in Figure 1 are applied. The num-
ber of 14 days was set to the minimum learning pe-
Figure 4: Illustration of the locations that correspond to the
user POI.
riod to learn each feature pattern (day
learn
= 14) and
5 consecutive days were used to predict an anomaly
(day
anom
= 5). For Dpattern all feature weights were
assigned to one, but weight optimisation should be
considered in future work. Depending on the user and
on the selected features, the minimum number of days
used to learn the human pattern can not completely
describe the real user behaviour, but since the pattern
model is updated daily, the patterns will become more
robust along the days. Thus, anomalies will be de-
tected considering the previous normal days.
The case study for anomalies detection, based on
human mobility on daily walks dataset, concerns a
user that starts to face reduced mobility. The planned
anomalies were directly related to mobility, thus, User
1 during the anomalous days started to walk slowly
and to perform shorter trajectories in less challeng-
ing paths. The extracted patterns that are more ad-
equate for the detection of reduced mobility are the
ones that are directly related to the user’s mobility,
namely the locomotion percentage time, the number
of steps, mean step length, walking time, walking dis-
tance, mean and maximum velocity and mean and
maximum altitude variation distributions.
In Figure 5, a representation of the distance of
each day to the pattern, as well as the anomalous
threshold value along days is shown. As the be-
haviour is defined within a range of 5 days, each dis-
tance represented correspond to the mean distance to
the pattern regarding 5 days. The anomalous thresh-
old is only defined after the pattern is learnt, which
occurs after 14 days. On day 19 the behaviour starts
to be evaluated, considering the behaviour of the last
5 days, according to the previous pattern and the de-
fined threshold. The pattern and the threshold are
continuously updated unless an anomaly is detected.
Comparing the detected anomalies and the ground
truth (red region), day 19 and 23 were incorrectly
assigned as a planned anomaly. The anomalous be-
haviour of both days occurred due to a distinct user’s
locomotion behaviour that lead to a large anomalous
distance. Specifically, day 19 was a raining day, so
the performed walk was shorter than usual, leading to
a large anomalous distance. Day 32 was not correctly
BIOSIGNALS 2020 - 13th International Conference on Bio-inspired Systems and Signal Processing
224
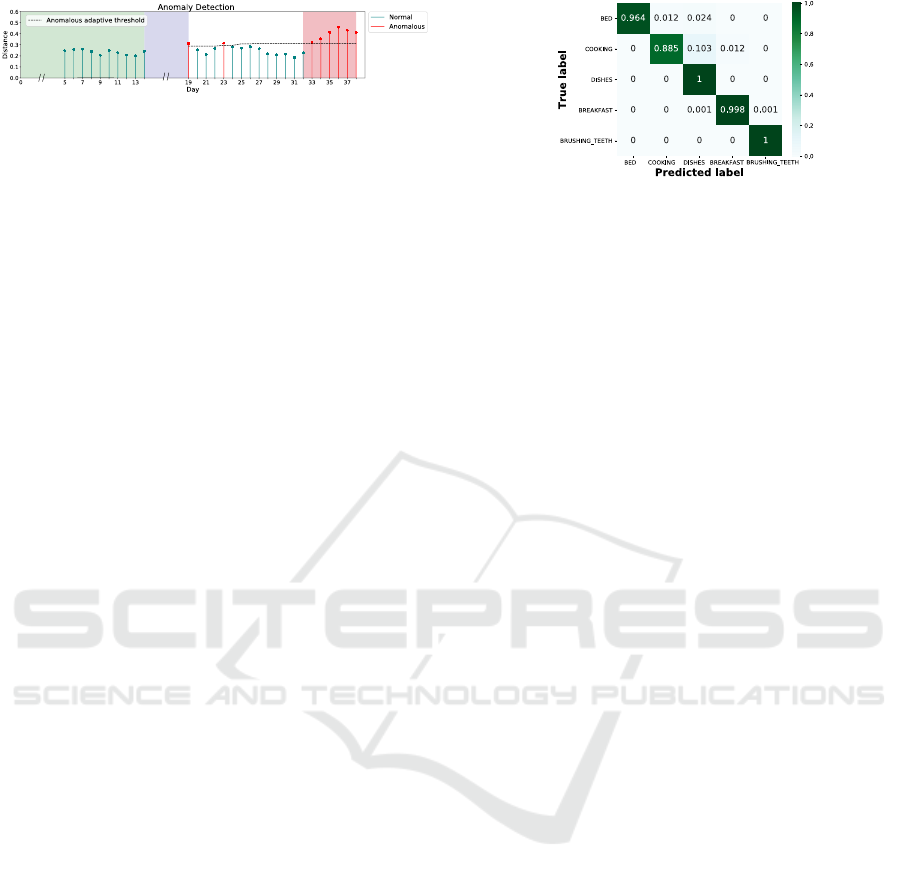
Figure 5: Representation of the anomaly detection results.
The x-axis correspond to the days of the user’s behaviour
and the y-axis to the distance to the pattern. The green
and red stem correspond to normal and anomalous days, re-
spectively. The streak line defines the anomalous adaptive
threshold. The green region correspond to the distances for
first defining the pattern and the threshold, the blue region
correspond to the day
anom
and the red region is the ground
truth of the anomalous days.
detected as an anomaly, which is acceptable since it
considers the behaviour of the last 5 days that were
normal, so the mean distance tends to be reduced.
4.2 Morning Daily Living Routine
Dataset
This dataset aims to evaluate the behaviour motion
patterns of the User 2, focusing on the indoor envi-
ronment. Thus, we are interested in knowing the ac-
tivities performed by the user comprising complex ac-
tivities of his/her daily living and the user’s location
in a room-level.
The indoor location relying on room level recog-
nition used data records from each room of the user’s
house. The implementation of a statistical classifier
regarding the Wi-Fi RSSI of the unique IDs from sev-
eral AP lead to an accuracy of 93.6%.
For the recognition of complex activities, namely
making the bed, washing the dishes, cooking, eating
and brushing teeth, separated activities from routines
were acquired for training the classifier and the ac-
curacies of various machine learning classifiers were
evaluated. For the training process, the user was asked
to record data while performing each of the morning
activities. The train set was composed of 15 rep-
etitions of each activity, and the test set was com-
posed by the annotated activities during 54 days of the
morning routine. For this recognition, data from the
accelerometer, gyroscope, magnetometer, barometer
and microphone smartphone sensors was acquired.
Data was resampled to 30 Hz and the magnitude of
tri-axial sensors was calculated. A resample excep-
tion was applied to microphone since a sampling fre-
quency of 8000 Hz is needed to detect small sound
variations. For this recognition problem, a window
size of 20 seconds was chosen, together with a 30%
overlap to enhance relevant features of the activity
that may be overshadowed by partitioning the signal
into fixed size windows. The features were extracted
using TSFEL library and a FFFS using 10-fold cross-
Figure 6: Normalised confusion matrix for morning activi-
ties classification, using RF classifier, after post-processing.
validation was applied. The K-Nearest Neighbor
(KNN) classifier was the one that achieved the highest
accuracy (92.5%) comparing to DT (89.7%), Random
Forest (RF) (90.6%), Naive Bayes (NB) (62.9%) and
AdaBoost (ADA) (88.5%).
In order to improve these results, a post-
processing was applied to the prediction labels com-
prising two stages. Firstly, the indoor location classi-
fier was combined with the complex activity recogni-
tion to ensure that an activity is being performed in the
expected room. Secondly, using a window size of 60
seconds the classifier predictions are replaced by ma-
jority voting. After the post-processing, the RF clas-
sifier obtained the highest accuracy (98.1%) using the
following features: mean y-axis acceleration, mean z-
axis magnetometer value, and mean gyroscope mag-
nitude. The normalised confusion matrix using RF
after post-processing is presented in Figure 6.
HMM were implemented in this dataset to eval-
uate the probability of a given sequence of activities
and locations performed by the user. The sequence of
activities is important for the evaluation of the cogni-
tive behaviour of the user, as a sequence that is too
different from the usual sequences performed by the
user may be an alarm situation. All 5 activities from
morning activities classifier were used to learn ac-
tivities sequence. The number of hidden states was
estimated through BIC, resulting in 2 hidden states.
Thus, the model was trained using 2 hidden states and
the activities sequences performed by the user during
34 days. Regarding location sequence, the number of
hidden states was also 2 and the HMM was imple-
mented from both true labels and predictions.
4.2.1 Motion Patterns
The morning daily living dataset is evaluated only in
indoor environment. The extracted features include
the duration of activities (Figure 7) and the time spent
in each location. These features were all modelled
into a distribution using KDE, allowing to learn the
user’s behaviour in terms of indoor environment.
Focusing on the activity duration distribution (Fig-
ure 7 ), the predicted distributions present lower du-
Learning Human Behaviour Patterns by Trajectory and Activity Recognition
225
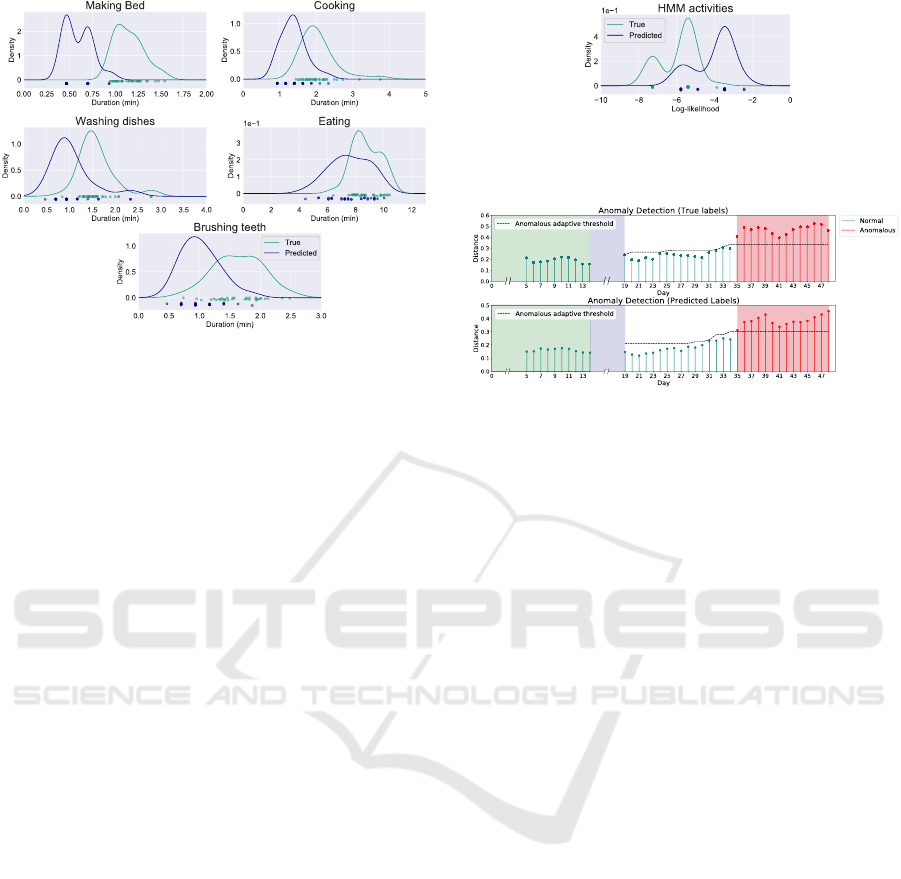
Figure 7: Representation of five features modelled into a
distribution using KDE. The green and blue distributions
are generated using the true and predicted activities labels,
respectively.
ration compared to the true ones, which can be ex-
plained by the following reasons: firstly, the post-
processing performed to the classifier prediction re-
sults discard some predictions by a majority voting
window, if the discarded predictions belong to the be-
ginning or end of the activity, correct predictions may
be discarded reducing the activity duration; secondly,
the annotated duration of the user’s activity tends to
be longer than the actual execution of the activity
since the user first annotates the start of the activity,
then performs it, and finally annotates the end of the
activity. The gap between true and predicted activi-
ties duration will not affect the learned behaviour and
consequently the planned anomalies detection, since
the classifier behaviour is consistent between activi-
ties and for further predictions, its behaviour will be
similar.
The HMM activities (Figure 8) illustrates the re-
sulting log-likelihood of a trained HMM using ac-
tivity sequences of true and predicted activity se-
quences, modelled using a KDE. Although the KDE
distributions using the true and predicted labels are
not exactly the same, both distributions include two
peaks corresponding to the two most likely activity
sequences. The shift between both distributions is
due to the random processes of the HMM, and will
not affect the anomaly detection since the resulting
log-likelihood is dependent of the trained model.
4.2.2 Anomaly Detection
The current dataset was designed to detect anoma-
lies on someone starting to experience dementia be-
haviour. For this purpose, the anomalies planned
on the user’s routine are related to dementia be-
haviour (Jaul and Barron, 2017), regarding absence
Figure 8: Representation of the log-likelihood distributions
for true and predicted activities sequences, in green and
blue, respectively.
Figure 9: From the top to the bottom is represented the
anomaly detection using the true and the predicted labels.
of activities that reflect the user’s difficulty or disin-
terest in performing the activity, activity sequences
that are not common on the user’s normal behaviour
and increased stay in certain home divisions that may
be indicative that the user is feeling depressive. For
anomaly detection, only the features that may charac-
terise this behaviour were accounted for, namely the
activity sequence probability, duration of each activ-
ity, TOI, number of entries per location and inactivity
percentage time.
Using the fluxogram from Figure 1, day
learn
was
set to 14 and a range of 5 days (day
anom
) for anomaly
detection was used. The Dpattern weights were set
to one. Figure 9 illustrates the results for anomaly
detection along 48 days of the user’s routine. Com-
paring the results of the anomaly detection using the
true and the predicted labels, despite the overall dis-
tances being different, the developed algorithm cor-
rectly predicts the planned anomalous days of the user
behaviour that starts in day 35.
5 CONCLUSIONS
The lack of routine screening of the ageing popula-
tion is a serious concern, since routine alterations and
difficulty on performing certain daily activities are
some of the common symptoms of cognitive impair-
ments. Thus, the main contribution of this study was
the development of a framework for learning human
behaviour patterns.
The developed framework includes three main
steps. The first step consists in the human behaviour
feature extraction. This study has a wider perspective
BIOSIGNALS 2020 - 13th International Conference on Bio-inspired Systems and Signal Processing
226

about human behaviour feature extraction than the re-
viewed literature. For instance, (Zheng et al., 2019)
and (Suzuki et al., 2007) only focuses in human tra-
jectory, (Tomforde et al., 2018) considers both loca-
tion and activities sequences but no time information
is extracted to model behaviour. This study extracts
an extensive list of features from human behaviour,
comprising time and frequency information from the
trajectories and activities of the user. The second part
investigates the usage of the extracted features for un-
derstanding and discovery of human patterns. Simi-
larly to the study conducted by Rahim (Rahim et al.,
2015), this study uses statistical models for the es-
timation of human behaviour patterns and anomaly
detection. However, instead of a gaussian distribu-
tion, this study uses a KDE to define the probabil-
ity density function since behaviour features may not
follow a gaussian distribution as it was verified on
the behaviour features acquired during this study. Fi-
nally, an anomaly detection algorithm was introduced
to detect abnormal behaviour. Experimental results
demonstrate the effectiveness of the proposed frame-
work that revealed an increase potential to learn be-
havioural patterns and detect anomalies considering
different case studies. This study may be a key insight
for monitoring elderly daily routines as well as mar-
keting analysis, security and tourism management.
Although the developed study revealed promising
results there is still room for improvement that can be
addressed in the future. Firstly, the framework should
be tested in more users, including different anomalous
behaviours. Then, the distance to the pattern can be
improved by a weight optimisation and parameteriza-
tion process based on the intrinsic characteristics of
each feature. This way, strongly correlated features
will have lower influence on the anomaly detection.
The weights should be learned according to real case
scenarios. For instance, it can be studied which fea-
tures are more affected considering different anoma-
lous behaviours, and the weights learned accordingly.
The framework can also be improved by an automatic
detection of the number of days needed to learn the
pattern. Finally, the smartphone used for data acqui-
sition should be replaced by a smartwatch or bracelet
containing the sensors embedded in a smartphone.
REFERENCES
Evans, D., Price, K., and Meyer, J. (2016). Home Alone
With Dementia. SAGE Open, 6(3):1–13.
Guimar
˜
aes, V., Castro, L., Carneiro, S., Monteiro, M.,
Rocha, T., Barandas, M., Machado, J., Vasconcelos,
M., Gamboa, H., and Elias, D. (2016). A motion
tracking solution for indoor localization using smart-
phones. In 2016 International Conference on Indoor
Positioning and Indoor Navigation, IPIN 2016, pages
1–8. IEEE.
Jaul, E. and Barron, J. (2017). Age-Related Diseases and
Clinical and Public Health implications for the 85
Years Old and Over Population. Frontiers in Public
Health, 5:1–7.
Jeebun, S., Ballgobin, R., and Al-ani, T. (2015). Optimal
Number of States in Hidden Markov Models and its
Application to the Detection of Human Movement.
University of Mauritius Research Journal, 21:438–
469.
Kumar, V., Tan, P.-T., and Steinbach, M. (2006). Cluster
analysis: basic concepts and algorithms. In Introduc-
tion to data mining, pages 488–568.
Parzen, E. (1962). On the Estimation of Probability Density
Functions and Mode. Ann. Math. Statist, 33:1065–
1076.
Rabiner, L. R. (1989). A Tuturial on Hidden Markov Mod-
els and Selected Applications in Speech Recognition.
Proceedings of the IEEE, 77(2):257–286.
Rahim, A., Forkan, M., Khalil, I., Tari, Z., Foufou, S.,
and Bouras, A. (2015). A context-aware approach
for long-term behavioural change detection and abnor-
mality prediction in ambient assisted living. Pattern
Recognition, 48(3):628–641.
Rosenblatt, M. (1956). A Central Limit Theorem and a
Strong Mixing Condition. Proceedings of the Na-
tional Academy of Sciences, 42(1):43–47.
Silverman, B. W. (1982). Kernel density estimation us-
ing the fast Fourier transform. Applied Statistics,
31(1):93–99.
Suzuki, N., Hirasawa, K., Tanaka, K., Kobayashi, Y., Sato,
Y., and Fujino, Y. (2007). Learning motion patterns
and anomaly detection by human trajectory analysis.
In Conference Proceedings - IEEE International Con-
ference on Systems, Man and Cybernetics, pages 498–
503.
Tomforde, S., Dehling, T., Haux, R., Huseljic, D., Kottke,
D., Scheerbaum, J., Sick, B., Sunyaev, A., and Wolf,
K. H. (2018). Towards Proactive Health-enabling Liv-
ing Environments: Simulation-based Study and Re-
search Challenges. In 31th International Conference
on Architecture of Computing Systems, pages 1–8.
United Nations (2017). World Population Ageing 2017 -
Highlights (ST/ESA(SER.A/397). Technical report,
Department of Economic and Social Affairs, Popula-
tion Division, New York.
Zhang, D. (2018). Periodic Pattern Mining from Spatio-
temporal Trajectory Data. PhD thesis, James Cook
University.
Zheng, W., Zhou, R., Zhang, Z., Zhong, Y., Wang, S., Wei,
Z., and Ji, H. (2019). Understanding the tourist mobil-
ity using GPS: How similar are the tourists? Tourism
Management, 71:54–66.
Learning Human Behaviour Patterns by Trajectory and Activity Recognition
227
