
An Attention-based Architecture for EEG Classification
Italo Zoppis
1 a
, Alessio Zanga
1 b
, Sara Manzoni
1 c
, Giulia Cisotto
2,3 d
,
Angela Morreale
4 e
, Fabio Stella
1 f
and Giancarlo Mauri
1 g
1
Department of Computer Science, University of Milano-Bicocca, Milano, Italy
2
Department of Information Engineering, University of Padova, Italy
3
Integrative Brain Imaging Center, National Center of Neurology and Psychiatry, Tokyo, Japan
4
Behavioral Neurology, Montecatone Rehabilitation Institute, Imola, Italy
Keywords:
Attentional Mechanism, Graph Attention Network, Brain Network, EEG.
Abstract:
Emerging studies in the deep learning community focus on techniques aimed to identify which part of a graph
can be suitable for making better decisions and best contributes to an accurate inference. These researches
(i.e., “attentional mechanisms” for graphs) can be applied effectively in all those situations in which it is not
trivial to capture dependency between the involved entities while discharging useless information. This is the
case, e.g., of functional connectivity in human brain, where rapid physiological changes, artifacts and high
inter-subject variability usually require highly trained clinical expertise. In order to evaluate the effectiveness
of the attentional mechanism in such critical situation, we consider the task of normal vs abnormal EEG
classification using brain network representation of the corresponding EEG recorded signals.
1 INTRODUCTION
Current networks not only involve social and techno-
logical aspects of our life but are considered as fun-
damental tools for studying many natural phenomena
and conceptual problems. In particular, we have re-
cently witnessed a significant growth of neuroscience
studies that use networks as a new paradigm to bet-
ter understand cognition (Varela et al., 2001), brain
cell organization (Rubinov and Sporns, 2010), and
functional connectivity (Towlson et al., 2013; Shih
et al., 2015; van den Heuvel et al., 2012). More-
over, recent advances in deep learning approaches
have provided the opportunity to dig into the under-
standing of brain diseases and to develop effective
neuro-markers for diagnosis and prognosis (Durste-
witz et al., 2019; Corchs et al., 2019). Similarly, there
have been several attempts in literature to extend deep
learning techniques to deal with network data. Some
initial work in this context used recursive networks to
process structured data such as direct acyclic graphs
(Frasconi et al., 1998; Sperduti and Starita, 1997).
a
https://orcid.org/0000-0001-7312-7123
b
https://orcid.org/0000-0003-4423-2121
c
https://orcid.org/0000-0002-6406-536X
d
https://orcid.org/0000-0002-9554-9367
e
https://orcid.org/0000-0001-9864-2295
f
https://orcid.org/0000-0002-1394-0507
g
https://orcid.org/0000-0003-3520-4022
More recently, Graph Neural Networks (GNNs) have
been introduced (Gori et al., 2005; Scarselli et al.,
2008) as a generalization of recursive networks ca-
pable of handling more general classes of graphs.
Despite the excellent performances and robustness
of deep learning for network data, current induction
has to deal with large multivariate and noisy data sets,
thus posing critical issues for an effective mining and
inference. This is the case of EEG signals, in which
rapid physiological changes, artifacts and high inter-
subject variability require a highly trained (human)
clinical expertise. In this regard, emerging researches
on deep architectures focus on how to bring out rel-
evant parts of a network to provide better decisions
(Veli
ˇ
ckovi
´
c et al., 2017), and knowledge representa-
tion. Technically, this approach is known as “atten-
tional mechanism”. Introduced for the first time in
the deep learning community in order to access im-
portant parts of the data (Bahdanau et al., 2014), the
attention mechanism has recently been successful for
the resolution of a series of tasks (Lee et al., 2018).
The key ideas of our study are that: 1) interactions
between brain regions can be used to extract useful
features in order to classify anomalies and 2) features
of pairs of brain region are related with each others.
Using a correlation matrix, we are able to express
the strength of the interaction between pairs of elec-
trodes, which can be directly mapped to a graph rep-
resentation: each node is an electrode and each edge
214
Zoppis, I., Zanga, A., Manzoni, S., Cisotto, G., Morreale, A., Stella, F. and Mauri, G.
An Attention-based Architecture for EEG Classification.
DOI: 10.5220/0008953502140219
In Proceedings of the 13th International Joint Conference on Biomedical Engineering Systems and Technologies (BIOSTEC 2020) - Volume 4: BIOSIGNALS, pages 214-219
ISBN: 978-989-758-398-8; ISSN: 2184-4305
Copyright
c
2022 by SCITEPRESS – Science and Technology Publications, Lda. All rights reserved

is added if the correlation is strong enough. This is
motivated by the spatial positioning of the electrodes
and the biological mechanisms, that actually include
more than one brain region together during everyday
tasks. Furthermore, by construction, an edge is added
to the graph if and only if it is a valid representa-
tion of the interaction between a pair of nodes (alias
a pair of brain regions), so for each node the attention
is performed on a well-structured and physiological-
motivated neighborhood.
In this paper, by focusing on these researches,
we investigate the performance of the graph atten-
tional mechanism for providing case/control, i.e., ab-
normal/normal EEG, classification of functional brain
networks obtained from EEG recorded signals.
In Sec. 2, we highlight some critical issues that
could affect the inference when blindly applying brain
networks as a tool for the analysis of functional con-
nectivity. In Sec. 3, we give the main definitions and
concepts. In Sec. 4, we describe the Graph Attention
Network (GAT) mechanism on which we apply our
inference problem. In Sec. 4.1, we conveniently adapt
and extend such mechanism for EEG signal classifica-
tion. In Sec. 5, we describe the experimental setting.
We conclude the paper reporting and discussing the
results in Sec. 6 and Sec. 7.
2 EEG SIGNALS: CRITICAL
ASPECTS FOR NETWORK
BASED INFERENCE
Although the network representation of brain signals
has had an evident impact on the scientific commu-
nity, it cannot be uncritically applied to inference and
data mining. In fact, to perform a pertinent analysis
and properly extract brain functional network proper-
ties it is important to know the neural phenomenon
under study.
Different pathologies, such as stroke, are usually
associated to lesions in different brain regions. This
can cause problems in obtaining accurate inference,
as the location and the shapes of these lesions can
largely differ from individual to individual. Clearly,
this has an impact on the definition of the network, on
its nodes and even on the correspondences that these
elements find in different subjects.
Moreover, because of rapid physiological
changes, artifacts, and high inter-subject variabil-
ity, EEG data are non-stationary multivariate time
series that are difficult to summarize with broadly
network statistics, and the corresponding inductive
tasks could generalize poorly, or even be unable to
capture specific extreme situations. This is the case,
for example, of epileptic seizures where abnormal
neuronal activities lead to convulsions and / or mild
loss of awareness. In such case, most seizures (e.g.,
temporal lobe epilepsy) begin as focal and rapidly
generalize for several seconds. If we were interested
in identifying epileptic foci during a generalized
attack, the use of “graph-based” inference should
be carefully applied, in order to provide a proper
identification.
In order to fill, at least in part, some of the is-
sues described for brain network based inference in
the following paragraphs we evaluate an attentional
(graph-based) architecture for selecting relevant net-
work topology, discharging useless information, and
at the same time acquiring the temporal functional de-
pendence of EEG recorded traces.
3 MAIN CONCEPTS AND
DEFINITIONS
From a theoretical perspective, networks can be mod-
eled through graphs, i.e., abstract objects representing
collection of “entities”, V (vertices or nodes), and re-
lationships between them, i.e., edges, E. In this pa-
per, we use attributed graphs, G = (V,E), where each
vertex v ∈ V is labeled with a vector of attribute val-
ues. Moreover, given a vertex v ∈ V , we indicate with
N (v) = {u : {v,u} ∈ E} the neighborhood of the ver-
tex v.
In order to summarize relationships between ver-
tices and capture relevant information in a graph, em-
bedding (i.e., objects transformation to lower dimen-
sional spaces) is typically applied (Goyal and Ferrara,
2018). This approach allows to use a rich set of an-
alytical methods, offering to deep models the capa-
bility of providing different levels of representation.
Embedding can be performed at the node level, at the
graph level, or through different mathematical strate-
gies, and it is typically realized by fitting (deep) net-
work’s parameters using standard gradient-based op-
timization. In particular, the following definitions can
be useful (Lee et al., 2018).
Definition 3.1. Given a graph G = (V,E) with V
as the set of vertices and E the set of edges, the
objective of node embedding is to learn a function
f : V → R
k
such that each vertex i ∈ V is mapped
to a k-dimensional vector,
~
h.
Definition 3.2. Given a set of graphs, G, the objective
of graph embedding is to learn a function f : G → R
k
that maps an input graph G ∈ G to a low dimensional
embedding vector,
~
h.
An Attention-based Architecture for EEG Classification
215
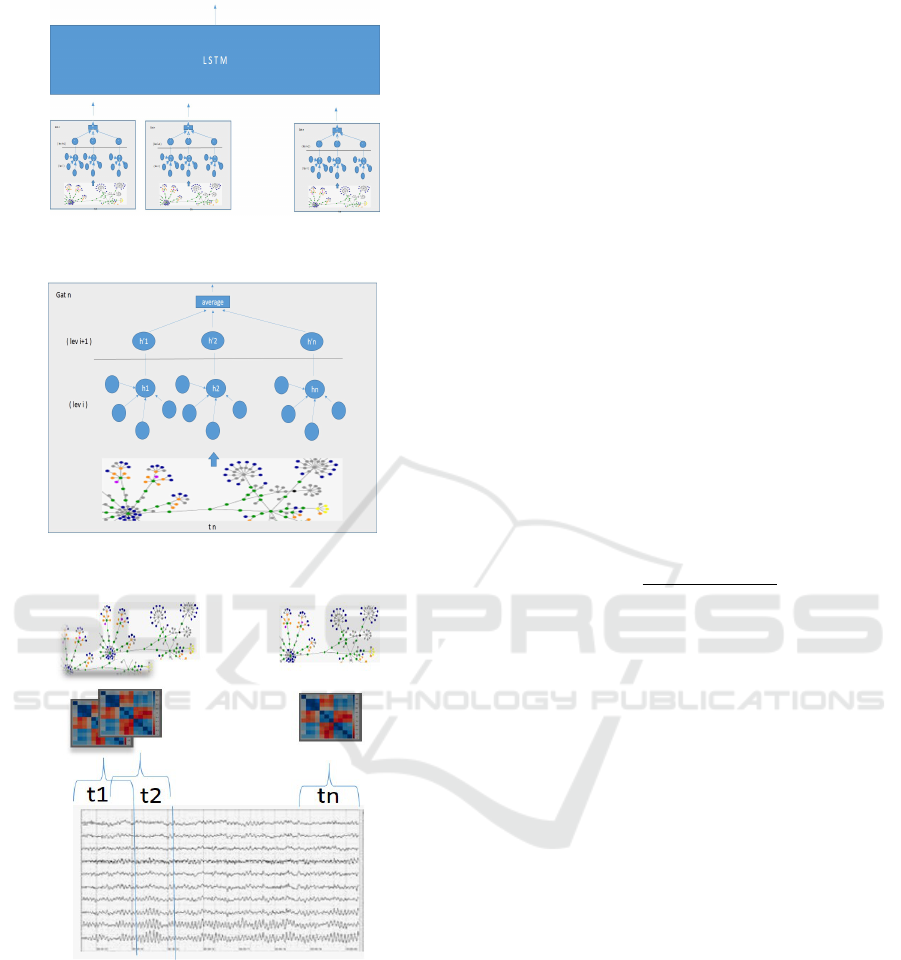
(a)
(b)
(c)
Figure 1: System Architecture. (c) The adjacency matrix
is computed for each window; (b) From adjacency to GAT
(for each window); (a) LSTM processes the sequence of
GAT embedded vectors.
4 GAT MODELS
In this paper, we apply the attentional-based node em-
bedding as recently proposed in (Veli
ˇ
ckovi
´
c et al.,
2017) by introducing a stacked architecture for
case/control classification of recorded EEG traces.
For a general, yet formal, definition of the notion of
“attention” here we conveniently adapt the one re-
ported in (Lee et al., 2018).
Definition 4.1. An attentional mechanism is a func-
tion a : R
n
× R
n
→ R which computes coefficients
e
i, j
= a
~
h
(l)
i
,
~
h
(l)
j
across pairs of vertices, i, j, based
on their feature representation
~
h
(l)
i
,
~
h
(l)
j
at level l.
The coefficients e
i, j
can be interpreted as the rele-
vance of vertex j’s features to i. Accordingly to
(Veli
ˇ
ckovi
´
c et al., 2017), let a be a single-layer feed-
forward neural network parametrized by a weight
vector~a with nonlinear LeakyReLU activation. In this
case we have,
e
(l)
i, j
= LeakyReLU
~a
(l)
T
h
W
(l)
~
h
(l)
i
||W
(l)
~
h
(l)
j
i
.
where W is a learnable parameter matrix and
W
(l)
~
h
(l)
i
||W
(l)
~
h
(l)
j
is the concatenation of the embed-
ded representation for the vertices i, j. The coeffi-
cients e
i, j
are generally normalized using, e.g., a soft-
max function,
α
(l)
i, j
=
exp(e
(l)
i, j
)
∑
k∈N (i)
exp(e
(l)
i,k
)
.
Notice that the mechanism’s parameters, ~a, are
trained jointly with the others network’s parameters
with standard optimization. Finally, the normalized
(attention) coefficients α
i, j
are then applied to com-
pute a linear combination of the features “around” i
(i.e., features of the vertices in N (i)). In this way, the
next level feature vector for i is obtained, i.e.,
~
h
(l+1)
i
= σ
∑
j∈N (i)
α
(l)
i, j
W
(l)
~
h
(l)
j
where σ is non linear vector-valued function (in our
case, sigmoid). In this way, embedding from neigh-
bors is aggregated together and scaled by the attention
scores.
4.1 A Stacked GAT-LSTM for EEG
Traces
Long-Short Term Memory networks have success-
fully contributed to model temporal sequences with
long lag time dependency. Furthermore because of
their forget gates, LSTM are able to filter out irrel-
evant data from “memory” (Gers et al., 1999). On
the basis of these arguments, here we apply a stacked
LSTM layer built on top of the level reported above.
In this way, we try to capture both the relevant topol-
ogy of the corresponding network and the temporal
BIOSIGNALS 2020 - 13th International Conference on Bio-inspired Systems and Signal Processing
216

dependency responses, while discharging ineffective
data from LSTM’s “memory”. The LSTM layer is
composed by 32 units. The resulting architecture is
reported in Fig. 1a.
5 EXPERIMENTAL SETTING
In order to capture temporal information from the
recorded EEG traces, we apply a sliding window ap-
proach. Specifically:
• The whole multivariate data are framed into dif-
ferent overlapping windows on the temporal do-
main, and each corresponding sub-sampled cross-
section series is used to obtain a cross-correlation
matrix built with Spearman correlation values be-
tween every pairs of recorded channels (Fig. 1c).
In this way each window is associated with a
graph adjacency matrix using a threshold-based
approach.
• For each graph, a GAT network is obtained as re-
ported in Sec. 1b (Fig. 1b).
• The GAT embedding from the j-th GAT network
(which characterizes the j-th graph embedded
representation) is aligned with the other (GATs)
output to obtain a sequence of GAT embedded
vectors. This sequence is processed as input by
the stacked LSTM layer (Fig. 1a).
• The input set of node features
~
h = {
~
h
1
,
~
h
2
,. . . ,
~
h
N
}
is composed by features vectors
~
h
i
∈ R
F
, with F
the number of features for each node. In this pa-
per, a single feature vector is made by five fea-
tures and is calculated by extracting the average
power for five well-established frequency bands,
such as delta (0.5-4Hz), theta (4-8Hz), alpha (8-
12Hz), beta (12-30Hz) and gamma (30-100Hz),
in the corresponding window.
5.1 Dataset
The dataset used in this paper is the “TUH Abnormal
EEG Corpus”, a large corpus of data derived from the
EEG Data Corpus of Temple University Hospital of
Philadelphia, Pennsylvania (Obeid and Picone, 2016).
This dataset was previously used in other publications
(Lopez et al., 2015; Schirrmeister et al., 2017;
¨
Ozal
Yıldırım et al., 2017). It contains up to 2993 EDF
files, divided in 1472 abnormal EEGs and 1521 nor-
mal EEGs, a total of approximately 1142 hours of
recording. For each record there is a plain text report
of the session describing the patient: clinical history,
medications, first impression of the EEG record and
clinical correlations. Each EEG record contains 22
channels with a 10/20 configuration.
6 RESULTS
The objective of our experiments were to evaluate the
accuracy of the attentional-based architecture to clas-
sify normal and abnormal signals of the data reported
in Sec.5.1.
As a reference for our comparisons, we used Con-
volutional Neural Networks (CNNs). In order to de-
sign homogeneous comparisons, CNNs are equipped
with dense (feed-forward) layers, that (similarly to
the architecture based on “attention”) allows to ob-
tain, for each window, an embedded vector, which in
turn represents the corresponding graph. The embed-
ding sequence can then be processed as input from the
stacked LSTM.
It is worth to note that in our experiments we have also
evaluated a “CCN + Dense” architecture. In this case,
a CNN supplies the graph embedding for every win-
dow. The sequence of all embedding is then passed as
input to the dense layer.
For each neural architecture, the number of epochs
is fixed to 100 and the loss function is a cross entropy
function. The selected optimizer is an Adam Opti-
mizer with a learning rate of 10
−5
. To obtain more
robust error estimation, we applied for each classifier,
a standard 10-fold cross-validation. The resulting per-
formances are averaged on the number of folds.
The results are reported in Tab. 1 and Tab. 2. Re-
sults reported in Tab. 2 shares the same experimental
settings as those in Tab. 1, with the only difference
that, here, we previously band-pass filtered signals
(from 0.1 to 47 Hz). In both cases, GAT-based ar-
chitectures outperform CNN-based architectures.
The architecture described in this paper was im-
plemented in Python using Keras library (Chol-
let et al., 2015) and Spektral library (Grattarola,
2019). The dataset preprocessing library is Py-
EEGLab (Zanga, 2019). Numerical evaluations were
executed on Ubuntu 18.04.2 LTS; Processor: AMD
R
,
Threadripper
TM
1900X CPU @ 3.89GHz, 4.20 Ghz,
8 Core(s), 16 Logical Processors; GPU: NVIDIA
R
,
GeForce RTX
TM
2070 8GB GDDR6; Installed Physi-
cal Memory (RAM) 32.00 GB ECC.
7 CONCLUSIONS
EEG-based brain networks are rather complex, yet
promising, tools, which typically need for a highly-
trained knowledge of the underlying neurophysiolog-
An Attention-based Architecture for EEG Classification
217
Table 1: Classification Performances [%].
Architecture Accuracy Sensitivity Specificity Precision F1 Score
CNNs + Dense 67.89% 68.67% 67.11% 67.76% 68.21%
CNNs + LSTM 68.56% 67.26% 70.23% 74.34% 70.63%
GATs + LSTM 81.27% 77.27% 86.99% 89.47% 82.93%
Table 2: Classification Performances [%] with band-pass filtered signals.
Architecture Accuracy Sensitivity Specificity Precision F1 Score
CNNs + Dense 69.90% 71.23% 68.63% 68.42% 69.80%
CNNs + LSTM 69.97% 72.59% 67.86% 64.47% 68.29%
GATs + LSTM 76.92% 77.85% 76.00% 76.32% 77.08%
ical processes, to provide accurate inference and mod-
eling. It turns out that the development of methods to
properly measure the brain functional connectivity at
different time steps is fundamental for classification
and, more generally, for induction.
The work presented here has focused on the for-
mulation of the recent “attentional mechanism” for
graphs (Veli
ˇ
ckovi
´
c et al., 2017). In particular, we in-
troduced a stacked GAT-LSTM architecture aimed to
classify abnormal vs normal EEG signals. The pro-
posed architecture intends to benefit on the one side,
from the potential LSTM capability to model long lag
time dependency while discharging information, and
one the other, from being able to exploit the “atten-
tional mechanism” for capturing most task-relevant
information from brain network’s complex dynamic.
Although the reported results are encouraging for
this purpose – outperforming a typical CNN applica-
tion, a larger dataset has to be investigated to further
support the impact of the newly proposed GAT-based
approach for physiological signals. This in turn re-
flects the needs to focus on specific pathologies, as
highlighted in this paper. Our research will follow
this target by specializing the analysis to clinical ori-
ented studies for a more complete modeling and in-
terpretation. Others experiments will be performed to
describe more extensively the effects of the applica-
tion of a band-pass filtering.
REFERENCES
Bahdanau, D., Cho, K., and Bengio, Y. (2014). Neural ma-
chine translation by jointly learning to align and trans-
late. arXiv preprint arXiv:1409.0473.
Chollet, F. et al. (2015). Keras. https://keras.io.
Corchs, S., Chioma, G., Dondi, R., Gasparini, F., Man-
zoni, S., Markowska-Kacznar, U., Mauri, G., Zoppis,
I., and Morreale, A. (2019). Computational methods
for resting-state eeg of patients with disorders of con-
sciousness. Frontiers in neuroscience, 13.
Durstewitz, D., Koppe, G., and Meyer-Lindenberg, A.
(2019). Deep neural networks in psychiatry. Molecu-
lar psychiatry, page 1.
Frasconi, P., Gori, M., and Sperduti, A. (1998). A general
framework for adaptive processing of data structures.
IEEE transactions on Neural Networks, 9(5):768–
786.
Gers, F. A., Schmidhuber, J., and Cummins, F. (1999).
Learning to forget: Continual prediction with lstm.
Gori, M., Monfardini, G., and Scarselli, F. (2005). A new
model for learning in graph domains. In Proceedings.
2005 IEEE International Joint Conference on Neural
Networks, 2005., volume 2, pages 729–734. IEEE.
Goyal, P. and Ferrara, E. (2018). Graph embedding tech-
niques, applications, and performance: A survey.
Knowledge-Based Systems, 151:78–94.
Grattarola, D. (2019). danielegrattarola/spektral.
Lee, J. B., Rossi, R. A., Kim, S., Ahmed, N. K., and Koh, E.
(2018). Attention models in graphs: A survey. arXiv
preprint arXiv:1807.07984.
Lopez, S., Suarez, G., Jungreis, D., Obeid, I., and Picone,
J. (2015). Automated identification of abnormal adult
eegs.
Obeid, I. and Picone, J. (2016). The temple university
hospital eeg data corpus. Frontiers in neuroscience,
10:196.
Rubinov, M. and Sporns, O. (2010). Complex network mea-
sures of brain connectivity: uses and interpretations.
Neuroimage, 52(3):1059–1069.
Scarselli, F., Gori, M., Tsoi, A. C., Hagenbuchner, M.,
and Monfardini, G. (2008). The graph neural net-
work model. IEEE Transactions on Neural Networks,
20(1):61–80.
Schirrmeister, R. T., Gemein, L., Eggensperger, K., Hutter,
F., and Ball, T. (2017). Deep learning with convolu-
tional neural networks for decoding and visualization
of eeg pathology.
Shih, C.-T., Sporns, O., Yuan, S.-L., Su, T.-S., Lin, Y.-J.,
Chuang, C.-C., Wang, T.-Y., Lo, C.-C., Greenspan,
R. J., and Chiang, A.-S. (2015). Connectomics-based
analysis of information flow in the drosophila brain.
Current Biology, 25(10):1249–1258.
Sperduti, A. and Starita, A. (1997). Supervised neural net-
works for the classification of structures. IEEE Trans-
actions on Neural Networks, 8(3):714–735.
BIOSIGNALS 2020 - 13th International Conference on Bio-inspired Systems and Signal Processing
218

Towlson, E. K., V
´
ertes, P. E., Ahnert, S. E., Schafer, W. R.,
and Bullmore, E. T. (2013). The rich club of the c. el-
egans neuronal connectome. Journal of Neuroscience,
33(15):6380–6387.
van den Heuvel, M. P., Kahn, R. S., Go
˜
ni, J., and Sporns, O.
(2012). High-cost, high-capacity backbone for global
brain communication. Proceedings of the National
Academy of Sciences, 109(28):11372–11377.
Varela, F., Lachaux, J.-P., Rodriguez, E., and Martinerie,
J. (2001). The brainweb: phase synchronization and
large-scale integration. Nature reviews neuroscience,
2(4):229.
Veli
ˇ
ckovi
´
c, P., Cucurull, G., Casanova, A., Romero, A., Lio,
P., and Bengio, Y. (2017). Graph attention networks.
arXiv preprint arXiv:1710.10903.
¨
Ozal Yıldırım, Baloglu, U. B., and Acharya, U. R. (2017).
A deep convolutional neural network model for auto-
mated identification of abnormal eeg signals.
Zanga, A. (2019). Pyeeglab: a simple tool for eeg manipu-
lation. https://github.com/AlessioZanga/PyEEGLab.
An Attention-based Architecture for EEG Classification
219
