Dynamic Visualization System for Gaze and Dialogue Data
Jonathan Kvist
1
, Philip Ekholm
1
, Preethi Vaidyanathan
2
, Reynold Bailey
3
and Cecilia Ovesdotter Alm
3
1
Department of Computer Science and Media Technology, Malm
¨
o University, Nordenski
¨
oldsgatan 1, Malm
¨
o, Sweden
2
Eyegaze Inc., 10363 Democracy Lane, Fairfax, VA 22030, U.S.A.
3
Rochester Institute of Technology, 1 Lomb Memorial Drive, Rochester, NY 14623, U.S.A.
Keywords:
Eye-tracking, Dialogue, Multimodal Visualization.
Abstract:
We report and review a visualization system capable of displaying gaze and speech data elicited from pairs of
subjects interacting in a discussion. We elicit such conversation data in our first experiment, where two par-
ticipants are given the task of reaching a consensus about questions involving images. We validate the system
in a second experiment where the purpose is to see if a person could determine which question had elicited
a certain visualization. The visualization system allows users to explore reasoning behavior and participation
during multimodal dialogue interactions.
1 INTRODUCTION
AI systems collaborating with humans should under-
stand their users. Having access to more than just
one modality improves this interaction and can be less
error-prone (Tsai et al., 2015; Kontogiorgos et al.,
2018). However, since human signals are ambiguous,
their interpretation is challenging (Carter and Bailey,
2012). By visualizing gaze and speech behaviors of
people discussing the visual world we can better un-
derstand human reasoning. We present a visualization
system incorporating gaze and speech from two inter-
locutors engaging in dialogue about images.
Visualizing data is helpful in many scenarios, e.g.
eye movement data reveals how the user spread their
attention (Blascheck et al., 2017). Popular visualiza-
tions such as heat maps and word clouds only cover
one modality and are often presented as static im-
ages. In contrast, we present a multimodal dialogue
visualization system that incorporates both gaze and
speech data, enhancing the amount of information re-
garding how interlocutors reasoned. Multimodal dia-
logues are complex since they have temporal progres-
sion. Therefore, our system utilizes dynamic render-
ing to capture the evolution of gaze and dialogue.
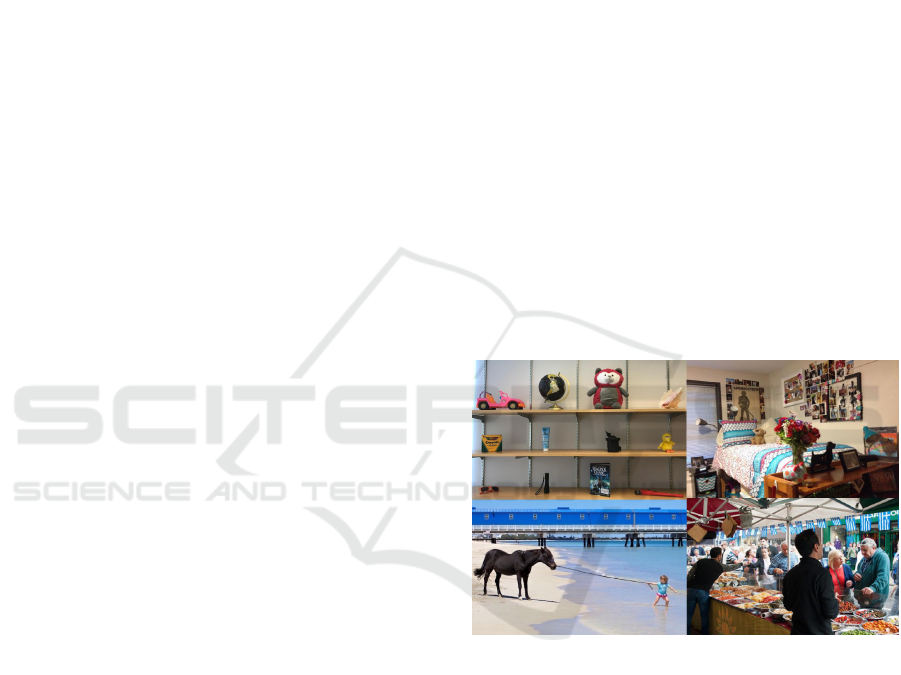
To elicit multimodal data we conducted Experi-
ment I where participants were paired and given the
task to discuss and reach a verbal consensus on ques-
tions about images which were chosen based on com-
plexity and animacy (see Figure 1). The participants’
Figure 1: Images used in Experiment I (Top-left: simple
inanimate; top-right: complex inanimate; bottom-left: sim-
ple animate; bottom-right: complex animate).
eye-movement and dialogue were recorded. This was
followed by building a prototype visualization system
and then evaluating and validating it in Experiment
II by having participants view multimodal visualiza-
tions generated from Experiment I and attempting to
identify the underlying questions that generated the
visualization. The research questions studied were:
• RQ1: Does access to more modalities improve
identifying the underlying question that elicited
the dialogue shown (i.e. question recognition)?
• RQ2: Do the properties of stimuli, namely com-
plexity, animacy, and question-type impact ques-
tion recognition?
138
Kvist, J., Ekholm, P., Vaidyanathan, P., Bailey, R. and Alm, C.
Dynamic Visualization System for Gaze and Dialogue Data.
DOI: 10.5220/0008953201380145
In Proceedings of the 15th International Joint Conference on Computer Vision, Imaging and Computer Graphics Theory and Applications (VISIGRAPP 2020) - Volume 2: HUCAPP, pages
138-145
ISBN: 978-989-758-402-2; ISSN: 2184-4321
Copyright
c
2022 by SCITEPRESS – Science and Technology Publications, Lda. All rights reserved
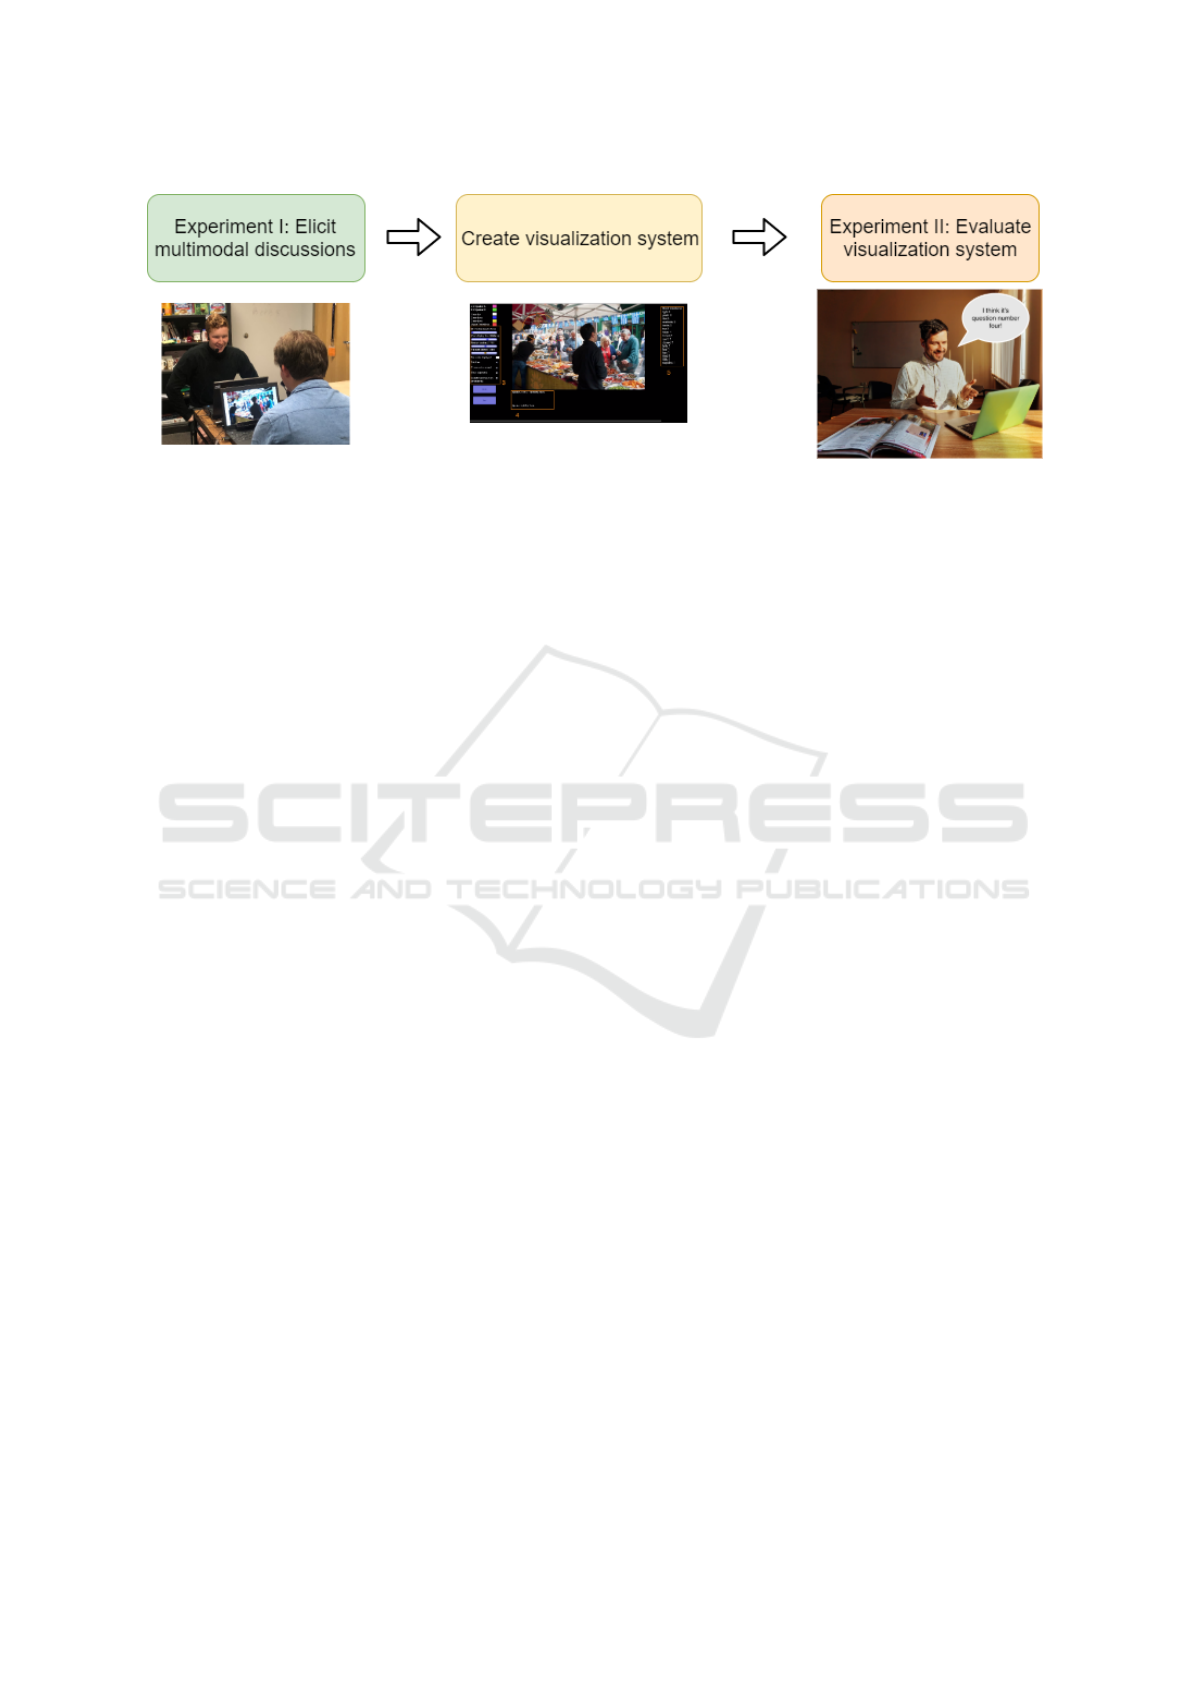
Figure 2: First Experiment I collected speech and gaze data. Pairs sat across each other and in front of eye trackers, wearing
microphones to record their speech. Next, we developed a prototype of a multimodal visualization system using the data.
Then, Experiment II evaluated the prototype by letting users interact with it and respond to questions.
We use question recognition as an objective mea-
surement of visualization success.
2 PRIOR WORK
Eye-tracking is getting better, cheaper, more accessi-
ble, and could therefore let us understand more about
user behavior and human reasoning. Eye tracking
produces large amounts of data, making data anal-
ysis a challenge. Its analysis tend to involve quan-
titative statistical analysis or qualitative visualiza-
tions (Blascheck et al., 2014). The statistical tech-
niques can give us information such as fixation count
and average number of saccades, while visualizations
can promote more holistic meaningful information by
highlighting how user attention is distributed over the
stimuli. Blascheck et al. (2017) explored how ex-
perts in the field analyzed eye tracking data, and they
agreed that statistical analysis and exploratory visual-
izations both are important. Almost all experts used
visualizations in their work, especially heat maps and
scan paths. The authors suggested that more ad-
vanced techniques would be adopted if they were
more widespread and straightforward to use.
Eye-tracking visualizations are categorized as ei-
ther point-based or area-of-interest based (Blascheck
et al., 2014). Regardless of the approach used, effec-
tive visualization frameworks should ideally allow for
easy and customizable user interaction, provide meth-
ods to incorporate additional data modalities and be
able to handle dynamic content, not just static 2D im-
ages (Blascheck et al., 2014; Blascheck et al., 2017;
Stellmach et al., 2010; Blascheck et al., 2016; Ram-
loll et al., 2004). Interestingly, one of the experts in
the Blascheck et.al. (2017) study mentioned that a vi-
sualization should be analyzed “not just as a means
for the researcher to understand the data, but as a
specific independent variable in which participants
are shown the eye movement patterns of either them-
selves, or from other observers, and how they can (or
cannot) understand and exploit this information.” We
leverage this idea as a way to assess the effectiveness
of our visualization system.
Online collaborative learning tools have the po-
tential to change the way people learn. Visualization
of the information exchange can aid in the learning
process (Bull and Kay, 2016). To improve such sys-
tems, it is important to analyze how users collaborate
in them. Traditionally this might be done with a static
2D image after the session, but Kon
´
e et al. (2018)
emphasize that it will be too late by then. They also
point out that the temporal information from the col-
laboration is lost in such a visualization (Kon
´
e et al.,
2018). The authors therefore argue for the need of
a dynamic, real time visualization that includes the
temporal context, e.g. by using animations. Another
study reports on an approach that makes scan paths
more easily comparable by mapping them as a func-
tion of time (R
¨
aih
¨
a et al., 2005). This is considered
advantageous when the exact locations of fixations are
less important than certain areas of interest.
Visualizations can be used to find relationships be-
tween modalities. A strong relationship has been ob-
served between the dialogue and gaze patterns of two
interlocutors (Sharma and Jermann, 2018). Wang et
al. (2019) also found that the gaze from two inter-
locutors are linked in conversation; relationships that
our system can highlight. They presented the users
with both a 3D and 2D scene, where the results did
not differ much (Wang et al., 2019). Our data collec-
tion is based on their work’s 2D scene setup. Dur-
ing their study, they asked the participants questions
which influenced conversation and gaze patterns.
Dynamic Visualization System for Gaze and Dialogue Data
139
3 METHOD
This study included three steps as seen in Figure 2:
1. Experiment I - elicit multi-modal discussions
2. Prototype the multi-modal visualization system
3. Experiment II - evaluate the prototype
3.1 Experiment I - Eliciting
Multi-modal Discussions
We conducted an IRB-approved data collection ex-
periment with 20 participants, recruited at a univer-
sity in the USA. The participants were paired up,
and their remuneration for participation was 10 USD
each. Half of the participants were female and the
other half male, and in 8 of the 10 pairs a female par-
ticipant was teamed with a male participant. Eigh-
teen were 19-23 years old. The other two were 26-
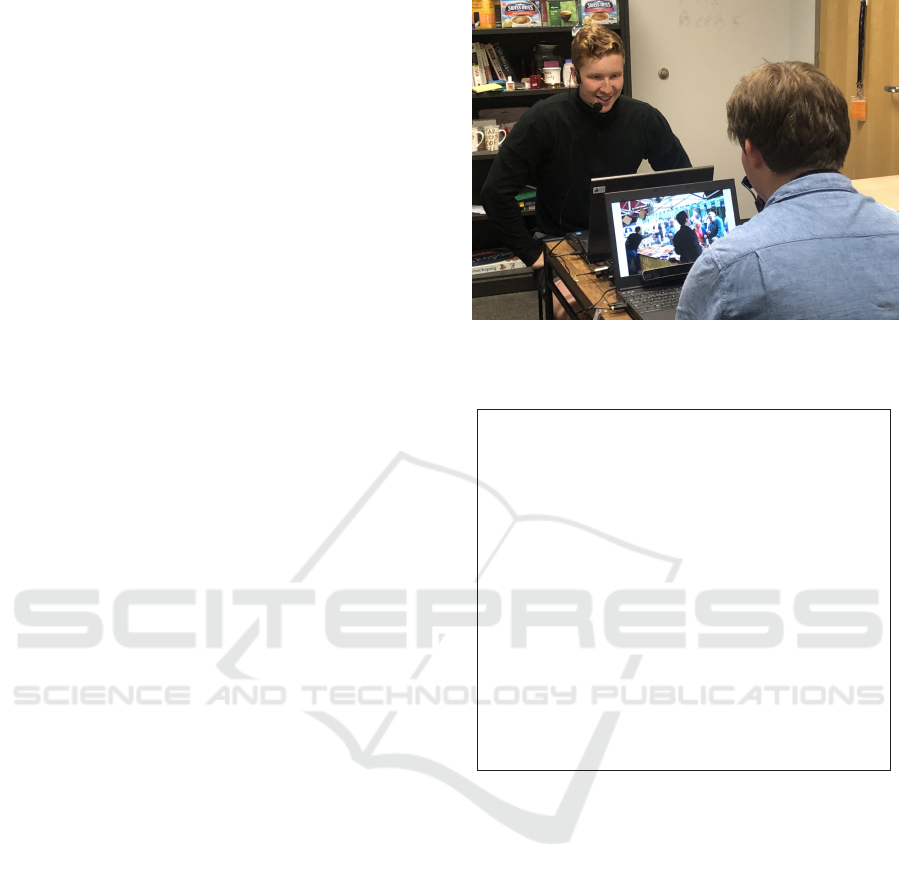
30. They first filled out a pre-survey, and were then
seated in front of each other at a small table as shown
in Figure 3. Each person was equipped with a head-
worn microphone to record their speech, and we used
a SensoMotoric Instruments RED 250Hz eye-tracker
mounted on a laptop to track their gaze. To elicit dif-
ferent conversations and gaze patterns, their task was
to discuss aloud and reach verbal consensus on a se-
ries of questions (shown in Figure 4) about four im-
ages (shown in Figure 1). Questions 1-3 were affec-
tive questions regarding the mood, feelings and sub-
jective attitudes, while questions 4-6 were material
questions about the subjective characteristics of the
objects in the images. We included different types of
questions to understand how visualization recognition
may be impacted by more or less emotional answers.
Experiment I was performed 10 times with a to-
tal of 20 participants, and each experiment lasted for
about 60 minutes. Data from two pairs had to be ex-
cluded due to misinterpretation of the task. Each pair
elicited 24 conversations (4 images * 6 questions),
meaning that we in total we got 192 conversations (8
pairs * 24 conversations).
3.2 Visualization System
The visualization prototype was built using Process-
ing, a Java-based sketchbook for drawing graphics,
text, images, and more (Fry and Reas, 2014).
3.2.1 Constraints
To enable our system to be fully autonomous, we use
Microsoft Azure Automatic Speech to Text (ASR) to
transcribe the conversations (Microsoft, 2019). We
Figure 3: Experiment set-up: Two interlocutors seated
across each other with their respective microphones, eye
trackers and laptops.
Experiment I questions
Q1. What activities does the owner of these objects or
the main person in the picture enjoy?
Q2. How would you change the environment to make
it more welcoming?
Q3. Describe an artwork that this image inspires you
to create.
Q4. Pick an object or person in the picture explain why
it does not belong there.
Q5. Which two items belong together in the picture?
Q6. Which non-living object is the oldest and which is
the newest?
Figure 4: Experiment I asked three affective questions (Q1-
Q3) and three material questions (Q4-Q6) to elicit discus-
sions.
computed the Word Error Rate (WER) for four con-
versations. The values ranged between 18-29%. We
believe that the WER is high due to two reasons. First,
both speakers had wearable microphones to record
their speech, but they were seated at the same table
which introduced some crosstalk. Second, we cannot
verify whether the training data included dialogues as
opposed to speech from a single person. The model’s
predictions may not be as accurate for dialogue data.
To counteract this, we included the confidence level
that the ASR system assigned to a particular utterance
when presenting the transcription to the user. This
gives the user information to decide for themselves
whether to trust the transcription or not.
HUCAPP 2020 - 4th International Conference on Human Computer Interaction Theory and Applications
140
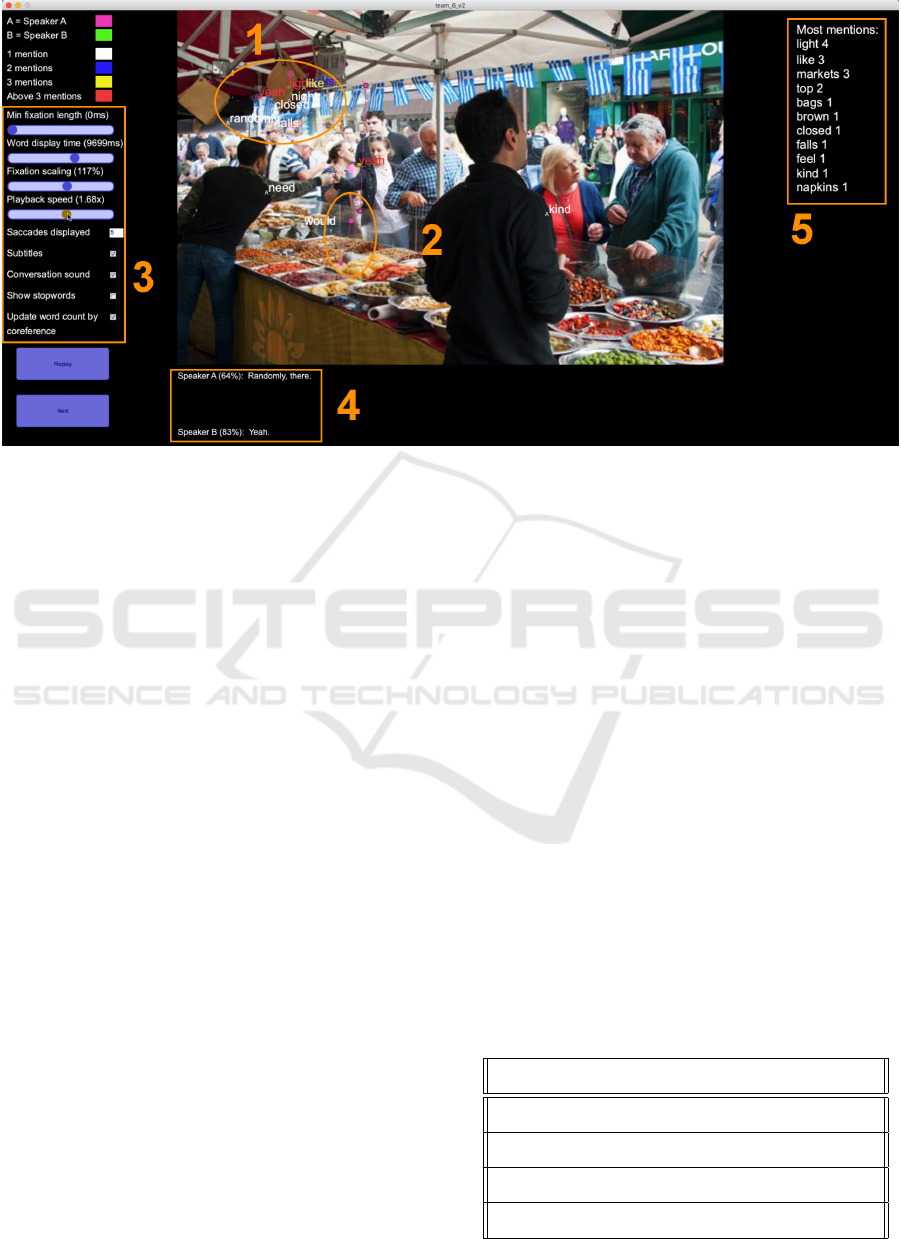
Figure 5: Overview of the prototype. 1: Fixations and words spoken by a participant while looking in the surrounding area.
2: Fixations and saccades in different colors corresponding to a speaker. 3: Various settings. 4: Machine-transcribed subtitles
of the dialogue. 5: Words that are mentioned frequently displayed along with their frequency count.
3.2.2 Co-reference Resolution
To extract more meaning from the utterances in the
discussion, we applied co-reference resolution. Co-
reference resolution is the task of determining if some
expressions in the discussion refer back to the same
entity, e.g. if he and Daniel refer to the same per-
son (Soon et al., 2001). We use a pre-trained model,
included in the AllenNLP processing platform (Gard-
ner et al., 2018), which performs end-to-end neural
co-reference resolution (Lee et al., 2017). This is ap-
plied to the text transcribed by Microsoft ASR and the
resulting information is used by the most frequently
mentioned words table in our system, so that an entity
is updated with the correct number of mentions.
3.2.3 Creation of the Visualization
The prototype system is made up of four major com-
ponents, which correspond to the different levels of
dialogue modalities in the visualization system seen
in Table 1: gaze + word tokens (M1), gaze + word to-
kens + subtitles (M2), gaze + word tokens + subtitles
+ conversation playback (M3), gaze + word tokens +
subtitles + conversation playback + access to all set-
tings (M4). Previous research identified the impor-
tance of handling the temporal progression of conver-
sations, meaning that our system had to be dynamic.
Different users would potentially also use the system
for different tasks. Therefore, we wanted to give the
user access to as many settings as possible from the
interface. Figure 5 shows a screenshot of the dynamic
visualization prototype. The key parts of the system
are numbered and explained below:
1. Fixations - represented by either a green or pink
circle, depending on which interlocutor generated
it. The size of the circle is proportional to the fix-
ation duration.
2. Saccades - represented by a line between two fix-
ations. As new saccades are displayed, the oldest
one present on the screen is removed to make the
visualization less cluttered.
3. Settings - the user can access the settings of the
visualization in the panel on the left side of the
system. A legend in the upper-left corner shows
the different color codes used. Additionally, the
Table 1: Modalities active for each iteration during Exper-
iment II. The evaluators had access to overlaid gaze and
words at all times but subtitles, audio, and the settings were
introduced as the experiment progressed. Stopwords were
not shown per default.
Modalities Gaze Words Subtitles Audio Settings
M1 Yes Yes
M2 Yes Yes Yes
M3 Yes Yes Yes Yes
M4 Yes Yes Yes Yes Yes
Dynamic Visualization System for Gaze and Dialogue Data
141

Figure 6: Number of times the different questions appeared
in Experiment II.
following settings can be accessed:
• Minimum fixation length (sliding bar)
• Word display time (sliding bar)
• Fixation scaling (sliding bar)
• Playback speed (sliding bar)
• Saccades displayed (number input)
• Subtitles (toggle)
• Conversation sound (toggle)
• Show stopwords (toggle) - display and count
words that are recognized as stopwords. The
Natural Language Toolkit (Bird et al., 2009)
was used for filtering them out.
• Update word count by co-reference (toggle) -
update word count for entities discovered dur-
ing co-reference resolution.
4. Subtitles - subtitles from the conversation in real
time as generated by the Microsoft ASR.
5. Most mentions - the words that have been men-
tioned the most in the conversation.
3.3 Experiment II - Evaluation of the
Multimodal Visualization System
In order to evaluate the effectiveness of our visual-
ization system, we conducted a second experiment
which utilized the data elicited from Experiment I.
For this experiment, we included ten participants re-
ferred to as evaluators to distinguish them from the
participants of Experiment I. All evaluators were re-
cruited from the same university as in Experiment I.
Six were female and four were male, and their remu-
neration was 10 USD. Nine evaluators were between
19 and 29 years old and one was above 40.
Each evaluator first answered the same demo-
graphic pre-survey as in Experiment I. They were then
seated in front of a screen that displayed the visualiza-
tion prototype. They were presented with eight visu-
alizations in total, all with data elicited in Experiment
Figure 7: The conversation length decreased as the experi-
ment progressed indicating growing scene familiarity.
I. We chose the eight visualizations based on three
factors: (1) underlying question, (2) image, and (3)
pair from Experiment I. Each evaluator was presented
with each question once and two additional questions
selected at random. Each image appeared twice, and
the conversations were chosen from at least seven dif-
ferent pairs from Experiment I. A total of 80 multi-
modal visualizations were presented to evaluators (10
participants * 8 visualized conversations). Every se-
lected visualization was presented to an evaluator four
times. Each time, the access to modalities or function-
alities in the interface increased, as can be seen in Ta-
ble 1. First, the evaluator only had access to the word
tokens and the gaze points in the system (M1). Then
the subtitles were added (M2), as transcribed by Mi-
crosoft ASR. In the third run the evaluator wore ear-
phones and the actual conversation was played back
along with the visualization (M3). Lastly, the evalu-
ator got full access to all the settings in the interface
(M4). After each introduction of modality or func-
tionality, the evaluator were asked three questions:
1. Which question generated the visualized gaze and
spoken language? (Menu with questions)
2. How confident are you about this answer? (Menu
with 1-10, where 0 means not confident and 10
means extremely confident)
3. Why did you choose that question? (Long answer
text)
For the drop down menu in question 1, the evalua-
tor could choose from the questions in Figure 4. After
M1 to M4 had been covered for one visualization, the
evaluator was also asked to give a free text answer to
the question: what is your perception about this visu-
alization?
HUCAPP 2020 - 4th International Conference on Human Computer Interaction Theory and Applications
142
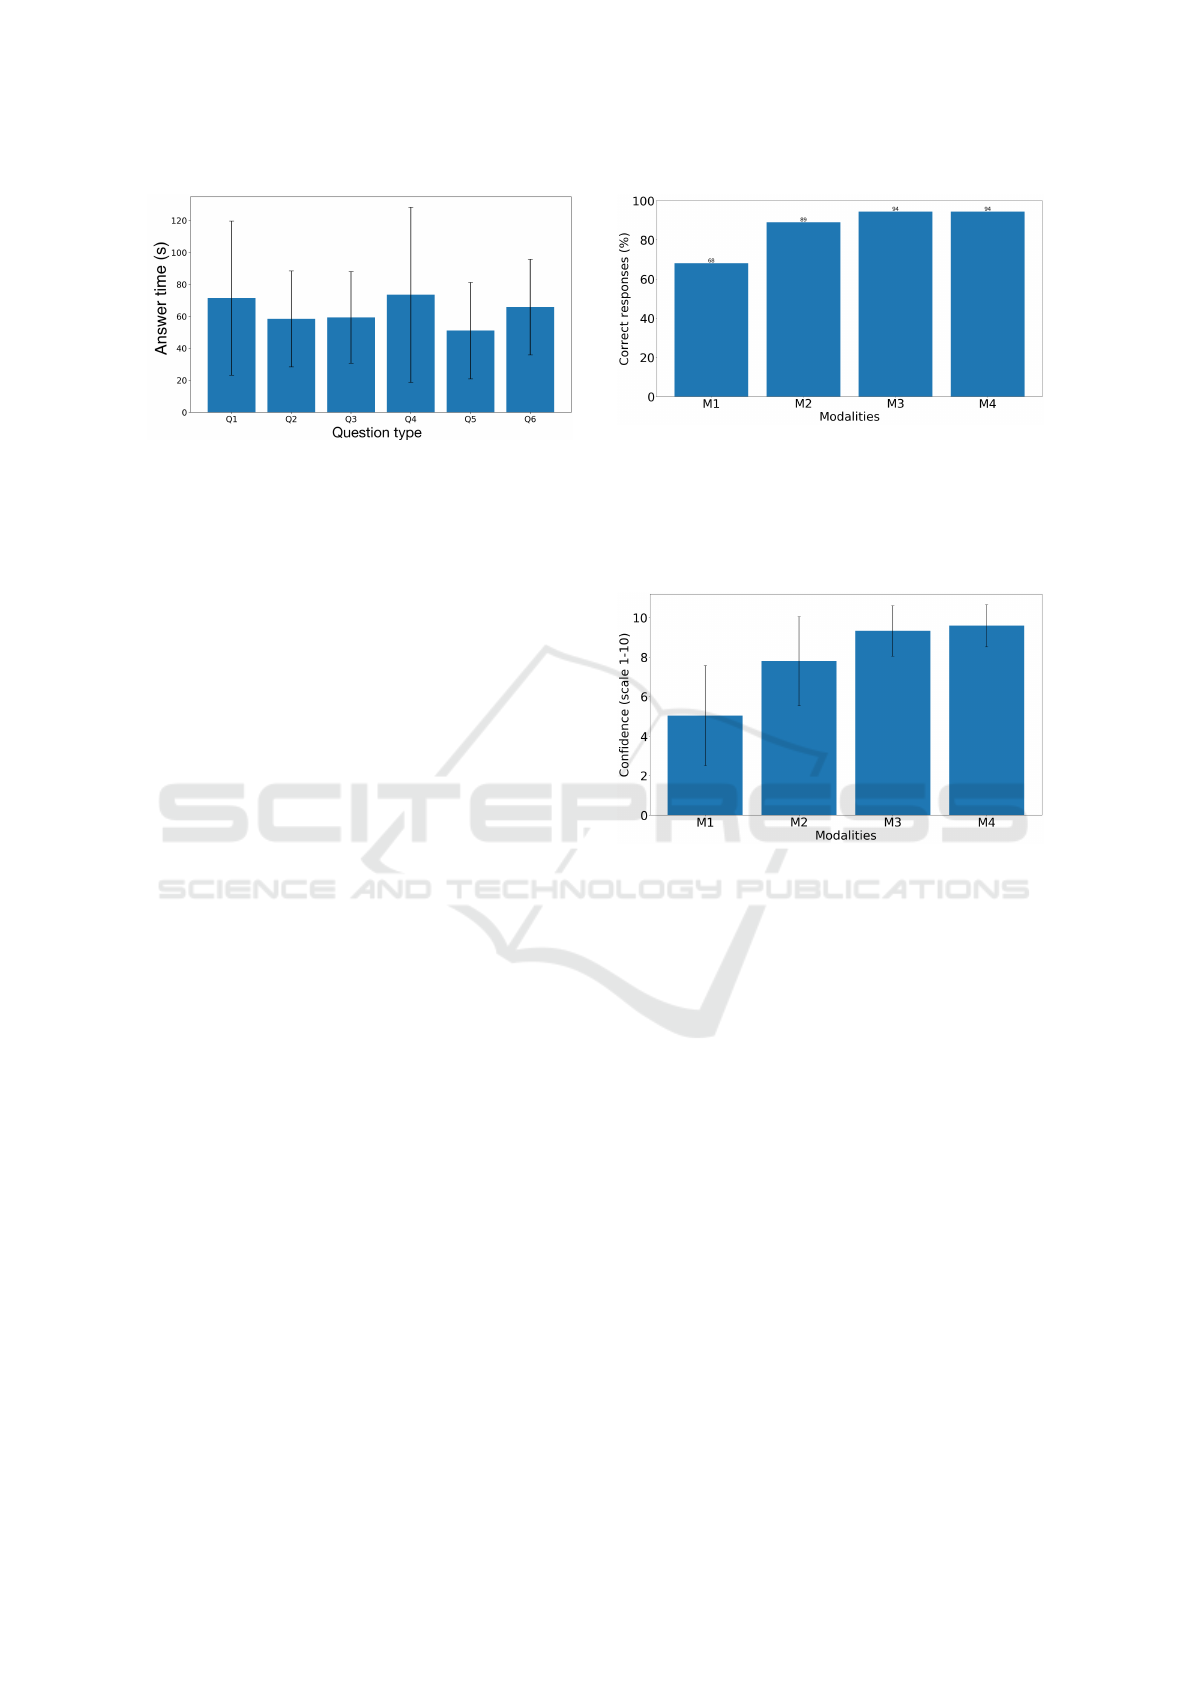
Figure 8: The question type (affective (Q1-Q3) or material
(Q4-Q6) all had similar conversation length.
4 RESULTS AND DISCUSSION
Conversation Duration: We analyzed the duration
of conversations in Experiment I. Figure 7 shows that
average conversation length decreased as the experi-
ment progressed. This could be due to growing scene
familiarity. Also, since images and questions were
repeated multiple times, fatigue and boredom could
also have played a part. Interestingly, the duration of
a conversation did not affect the ability of the evalua-
tor in accurately identifying the underlying question,
i.e. question recognition. Figure 8 shows that the con-
versation duration is not affected substantially by the
type of question asked.
Effectiveness of the Visualization: We received
mixed responses from evaluators in Experiment II.
One evaluator described the visualization as very con-
fusing, whereas another evaluator said think its clear
where circles with lines showing which objects take
out. Many participants mentioned that the extra
modalities (subtitles, sound) made it easier to figure
out the underlying question. However, they high-
lighted that one of the more helpful tools was the list
of most frequently mentioned words (Figure 5). This
list was available throughout M1 to M4. Certain ques-
tions have a tendency to generate certain keywords,
which likely aided the evaluators in correctly identi-
fying the underlying question. We further note that a
majority of the evaluators did not change any settings
in M4 even though they could, indicating that the de-
fault settings were well calibrated.
Modalities and Question Recognition (RQ1): Our
results show that as we increase the modality level
i.e. provide more information to the evaluator in Ex-
periment II, their ability to recognize the underlying
questions increased. This is evident from Figure 9.
With only word tokens and gaze data (M1), 68% of
the time evaluators were able to correctly recognize
the underlying question, which is far above random
Figure 9: Accuracy, measured as how often the evaluators
in Experiment II managed to correctly identify which ques-
tion elicited the multimodal visualization, increased when
providing more forms of data. M1 = Gaze data + word to-
kens, M2 = M1 + machine-transcribed subtitles, M3 = M2
+ dialogue sound, M4 = M3 + ability to customize settings.
A one-way ANOVA resulted in a p-value < 0.001.
Figure 10: Average self-reported confidence increases as
more modalities/functionalities are introduced over M1
through M4. This follows the same pattern as the response
accuracy, as can be seen in Figure 9. A one-way ANOVA
was used as hypothesis-test with a p-value of 0.04.
guess between the six options. When provided with
added Microsoft ASR subtitles (M2), a significantly
higher share (89%) of the evaluators successfully rec-
ognized the question. This could be due to that the
subtitles encapsulate syntactic structure and context,
which helps the evaluator identify what the conver-
sation was about. Instead of only having access to
word tokens and no syntactic structure, the evalua-
tor can now follow the unfolding of the conversa-
tion. With added access to the audio of the conver-
sation (M3), 94% of the evaluators successfully rec-
ognized the question. Listening to the conversation
gave access to prosody and voice inflection, provid-
ing the evaluator more information about the conver-
sation that subtitles cannot straightforwardly capture,
for instance sarcasm. Also, the conversation audio
playback is not reliant on the ASR system to provide
the correct output, which is likely important due to
its higher WER. The last modality (M4) i.e. access to
the various settings did not impact the share of evalua-
tors that correctly recognized the underlying question.
Dynamic Visualization System for Gaze and Dialogue Data
143
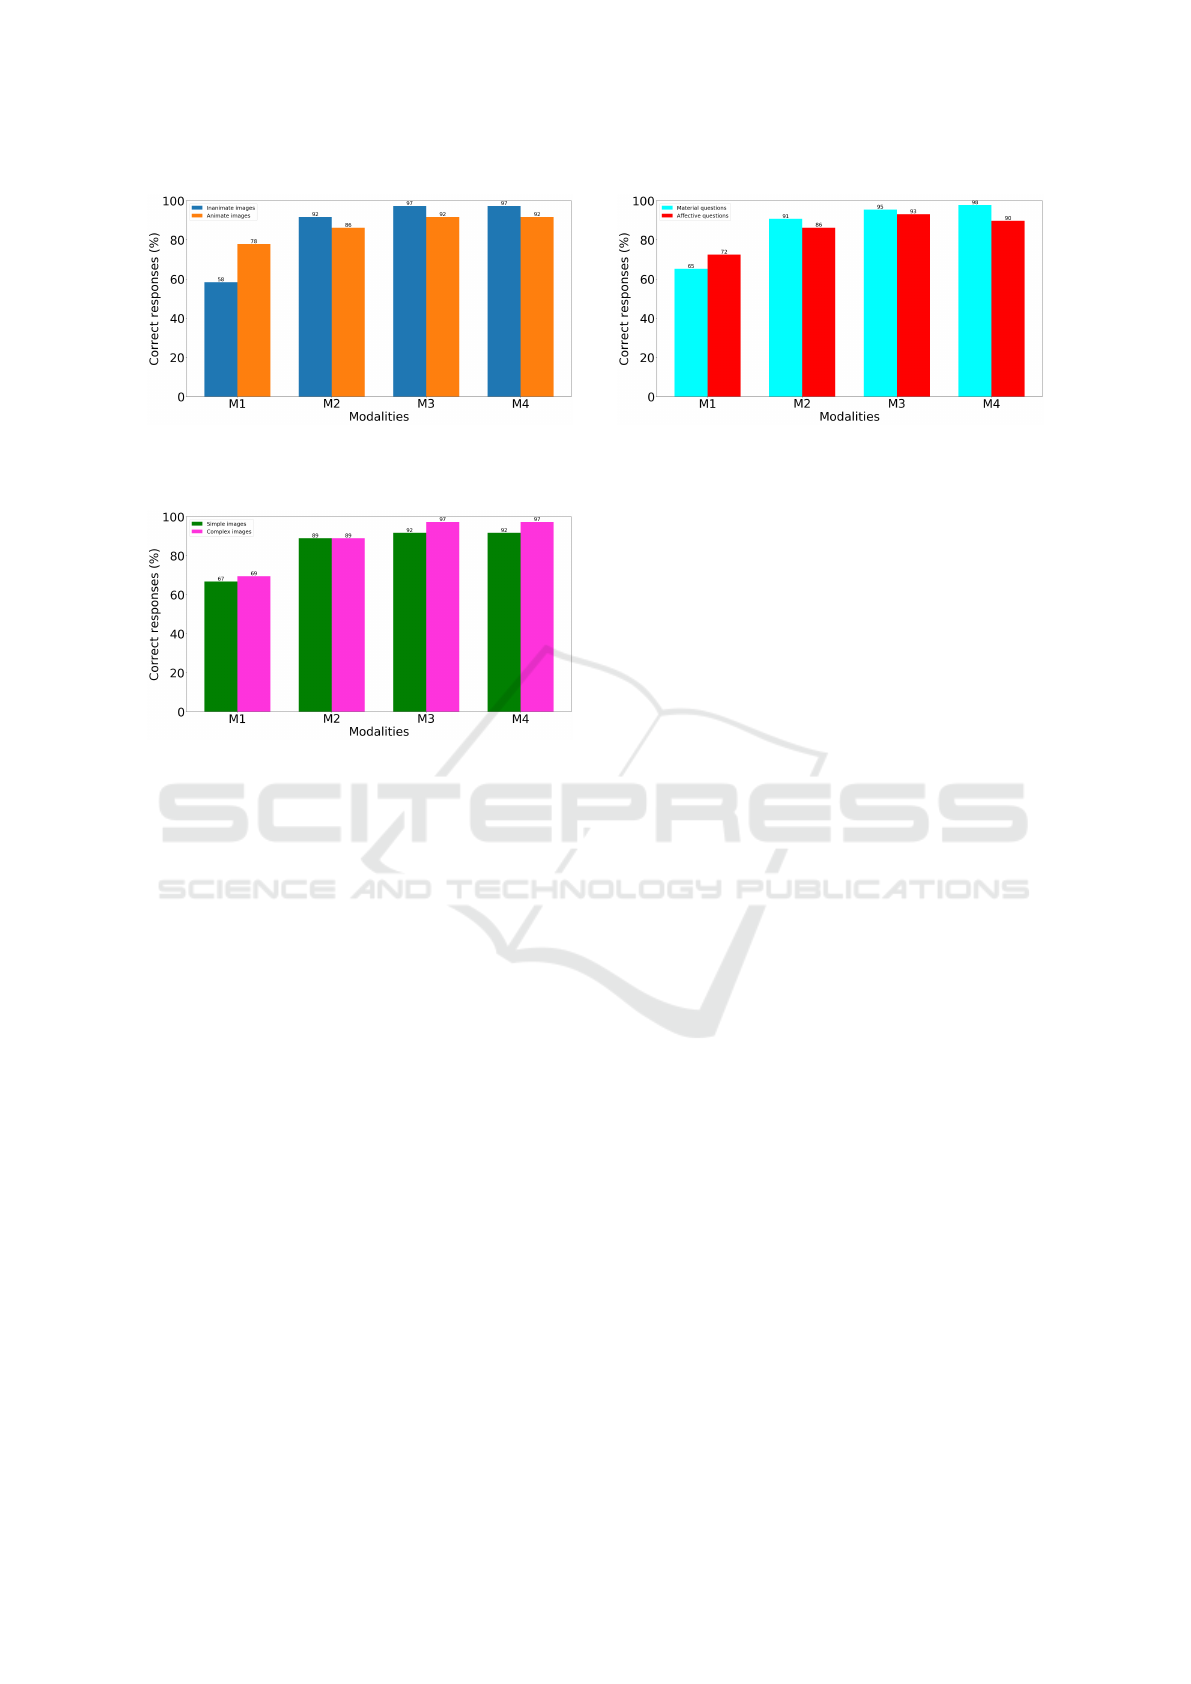
Figure 11: No significant difference in question recognition
depending on the animacy of the visual content. A one-way
ANOVA resulted in a p-value of 0.88.
Figure 12: No significant difference in question recognition
depending on the visual complexity of the image. A one-
way ANOVA resulted in a p-value of 0.46.
This can also be seen in Figure 10, which shows that
the overall self-reported confidence level corresponds
well with the actual overall question recognition accu-
racy. We can see that during M3 (gaze, word tokens,
and audio), evaluators were almost certain they had
the correct answers. This gave them little to no incen-
tive to change any of the settings and improve upon
the prior answers. We observed that many evaluators
did not change any settings at all.
In summary, our results show that gaze and word
tokens were displayed in a manner that was helpful
for recognizing the underlying question. However,
context around the word tokens, whether provided via
subtitles or audio, appear to be a key piece of informa-
tion in understanding the focal point of a given con-
versation. This means that a useful visualization ben-
efits from multimodality, but also from structurally
sound content. The user is helped by more than just
extracted word tokens. It would help to investigate the
usefulness of phrases as compared to word tokens and
to measure how much of the context around a word is
required to understand the conversation.
Stimulus, Questions, and Question Recognition
(RQ2): We observe that animacy of the visual con-
tent might impact the ability to accurately recognize
the questions to some degree (Figure 11), however,
this is not statistically significant. Similarly, the com-
Figure 13: No significant difference in question recognition
depending on the type of question. A one-way ANOVA
resulted in a p-value of 0.73.
plexity of the image (Figure 12) or type of question as
affective or material (Figure 13) did not seem to affect
the ability of the evaluator to correctly recognize the
underlying question. This is advantageous as a sin-
gle framework of the visualization can be used across
images or question types.
5 CONCLUSIONS
This work provides insight into how data from mul-
tiple modalities can be jointly displayed in a visual-
ization system for qualitative analysis and research
purposes. Our visualization system is dynamic and
allows a user to visualize both gaze and speech data
over time. We go one step further by providing multi-
party gaze and dialogue data visualization which will
be highly useful in studies aimed at understanding
human-human interaction and behavior. Such a visu-
alization system can also be used for remote mentor-
ing by an instructor. In this work we exemplify this
feature by showing the data from a pair of subjects
but this can be extended to more than two speakers
e.g. a group of people looking at a visual environment
and discussing it. We used 2D eye trackers but based
on Wang et al’s (2019) findings of few differences in
multimodal 2D and 3D scene understanding, we do
not necessarily anticipate major changes if moving to
3D actual visual environments.
Our results show that access only to gaze and word
tokens is helpful in understanding the focal point of a
conversation (via question recognition) to some de-
gree. However, access to the context of the language
structure significantly increases the users ability to
identify the focal point. This means that a multimodal
visualization system that simply displays words is not
perfect and that transcriptions in the form of subti-
tles or spoken conversation are useful. The fact that
the evaluators found our visualization system (with all
modalities) useful, based on their response accuracy,
HUCAPP 2020 - 4th International Conference on Human Computer Interaction Theory and Applications
144

despite the type of image or question and even image
complexity indicates that the visualization system can
be used more broadly for understanding dialogues.
This is important for face-to-face collaborative appli-
cations such as a group of students collaborating on
a task in a classroom. In the future we would like to
analyze the benefits of providing only gaze informa-
tion without the most frequent words and compare it
to other modalities, isolated and combined.
Our visualization system is flexible and can be ex-
panded to include more features. For example, quan-
titative metrics such as mean and standard deviation
for fixation duration and type-token-ratio can also be
added in the future. In addition, if more human gener-
ated data is elicited, it could be added into the system
as new user features. Currently, the system displays
the static image that was used in Experiment I but it
can be extended to display a dynamic stimulus or 3D
real-world scenes. This is challenging and will be par-
ticularly helpful for researchers who want to analyze
data from wearable eye trackers.
Finally, we have shown that our discussion-based
multimodal data elicitation method can capture multi-
party reasoning behavior in visual environments. Our
framework is an important step toward meaningfully
visualizing and interpreting such multiparty multi-
modal data.
ACKNOWLEDGEMENTS
This material is based upon work supported by the
National Science Foundation under Award No. IIS-
1851591. Any opinions, findings, and conclusions
or recommendations expressed in this material are
those of the author(s) and do not necessarily reflect
the views of the National Science Foundation.
REFERENCES
Bird, S., Klein, E., and Loper, E. (2009). Natural Language
Processing with Python. O’Reilly Media, Inc., 1st edi-
tion.
Blascheck, T., John, M., Kurzhals, K., Koch, S., and Ertl, T.
(2016). Va2: A visual analytics approach for evaluat-
ing visual analytics applications. IEEE Transactions
on Visualization and Computer Graphics, 22(1):61–
70.
Blascheck, T., Kurzhals, K., Raschke, M., Burch, M.,
Weiskopf, D., and Ertl, T. (2014). State-of-the-art of
visualization for eye tracking data. In EuroVis.
Blascheck, T., Kurzhals, K., Raschke, M., Burch, M.,
Weiskopf, D., and Ertl, T. (2017). Visualization of
eye tracking data: A taxonomy and survey. Computer
Graphics Forum, 36(8):260–284.
Bull, S. and Kay, J. (2016). Smili: a framework for inter-
faces to learning data in open learner models, learning
analytics and related fields. International Journal of
Artificial Intelligence in Education, 26(1):293–331.
Carter, S. and Bailey, V. (2012). Facial Expressions :
Dynamic Patterns, Impairments and Social Percep-
tions. Hauppauge, N.Y. : Nova Science Publishers,
Inc. 2012.
Fry, B. and Reas, C. (2014). Processing: A Programming
Handbook for Visual Designers and Artists. The MIT
Press.
Gardner, M., Grus, J., Neumann, M., Tafjord, O., Dasigi, P.,
Liu, N. F., Peters, M., Schmitz, M., and Zettlemoyer,
L. (2018). AllenNLP: A deep semantic natural lan-
guage processing platform. pages 1–6.
Kon
´
e, M., May, M., and Iksal, S. (2018). Towards a
dynamic visualization of online collaborative learn-
ing. In Proceedings of the 10th International Con-
ference on Computer Supported Education - Volume
1: CSEDU,, pages 205–212. INSTICC, SciTePress.
Kontogiorgos, D., Avramova, V., Alexanderson, S., Jonell,
P., Oertel, C., Beskow, J., Skantze, G., and Gustafson,
J. (2018). A multimodal corpus for mutual gaze
and joint attention in multiparty situated interaction.
In Proceedings of the Eleventh International Confer-
ence on Language Resources and Evaluation (LREC-
2018), Miyazaki, Japan. European Languages Re-
sources Association (ELRA).
Lee, K., He, L., Lewis, M., and Zettlemoyer, L. (2017).
End-to-end neural coreference resolution. pages 188–
197.
Microsoft (2019). Microsoft Azure Speech to Text. Ac-
cessed: 2019-12-17.
R
¨
aih
¨
a, K.-J., Aula, A., Majaranta, P., Rantala, H., and
Koivunen, K. (2005). Static visualization of tempo-
ral eye-tracking data. In IFIP Conference on Human-
Computer Interaction, pages 946–949. Springer.
Ramloll, R., Trepagnier, C., Sebrechts, M., and Beedasy, J.
(2004). Gaze data visualization tools: Opportunities
and challenges. 2010 14th International Conference
Information Visualisation, 0:173–180.
Sharma, K. and Jermann, P. (2018). Gaze as a proxy for
cognition and communication. 2018 IEEE 18th In-
ternational Conference on Advanced Learning Tech-
nologies (ICALT), Advanced Learning Technologies
(ICALT), 2018 IEEE 18th International Conference
on, ICALT.
Soon, W. M., Ng, H. T., and Lim, D. C. Y. (2001). A ma-
chine learning approach to coreference resolution of
noun phrases. Comput. Linguist., 27(4):521–544.
Stellmach, S., Nacke, L. E., Dachselt, R., and Lindley, C. A.
(2010). Trends and techniques in visual gaze analysis.
CoRR, abs/1004.0258.
Tsai, T. J., Stolcke, A., and Slaney, M. (2015). Multimodal
addressee detection in multiparty dialogue systems. In
Proc. IEEE ICASSP, pages 2314–2318. IEEE - Insti-
tute of Electrical and Electronics Engineers.
Wang, R., Olson, B., Vaidyanathan, P., Bailey, R., and Alm,
C. (2019). Fusing dialogue and gaze from discussions
2d and 3d scenes. In Adjunct of the 2019 International
Conference on Multimodal Interaction (ICMI ’19 Ad-
junct), October 14–18, 2019, Suzhou, China. ACM,
New York, NY, USA 6 Pages.
Dynamic Visualization System for Gaze and Dialogue Data
145
