
Anomaly Event Detection based on People Trajectories for Surveillance
Videos
Rensso Mora Colque
1
, Edward Cayllahua
1
, Victor C. de Melo
3
, Guillermo Camara Chavez
2
and
William Robson Schwartz
3
1
Universidad Cat
´
olica San Pablo, DCC, Arequipa, Per
´
u
2
Universidade Federal de Ouro Preto, ICEB, Ouro Preto, Brazil
3
Universidade Federal de Minas Gerais, DCC, Belo Horizonte, Brazil
Keywords:
Anomaly Recognition, Trajectory Analysis, Recurrent Autoencoder.
Abstract:
In this work, we propose a novel approach to detect anomalous events in videos based on people movements,
which are represented through time as trajectories. Given a video scenario, we collect trajectories of normal
behavior using people pose estimation techniques and employ a multi-tracking data association heuristic to
smooth trajectories. We propose two distinct approaches to describe the trajectories, one based on a Convolu-
tional Neural Network and second based on a Recurrent Neural Network. We use these models to describe all
trajectories where anomalies are those that differ much from normal trajectories. Experimental results show
that our model is comparable with state-of-art methods and also validates the idea of using trajectories as a
resource to compute one type of useful information to understand people behavior; in this case, the existence
of rare trajectories.
1 INTRODUCTION
Abnormal event detection for video surveillance
refers to the problem of finding patterns in sequences
that do not conform to expected events (Du et al.,
2013). It is a challenging problem because the defi-
nition of anomaly is subjective to the particular scene
context, giving origin to a large number of interpre-
tations. For instance, someone running at a marathon
can be considered a normal event, while someone run-
ning during a regular working day due to an emer-
gency, can be considered an anomalous event. There-
fore, the difficulty of anomaly recognition is related
to the semantics that is observed in the scene.
Due to the wide number of interpretations, defin-
ing algorithms that suit in any anomaly event is a
very difficult problem. Consequently, most models
focus in extracting features based on movement and
appearance from spatiotemporal regions (Popoola and
Wang, 2012). Nevertheless, this type of informa-
tion might be affected by noise due to complex back-
grounds, illumination changes and poor lighting con-
ditions. Following new trends in computer vision, this
issue can be minimized by using high level semantic
information, such as object detection and pose estima-
tion, allowing to also model anomaly from contextual
information directly.
In this work, we exploit high level information
to create a robust representation for anomaly recog-
nition. Our approach models people movements by
leveraging from body skeletons obtained through a
state-of-the-art pose estimator. The reference points
are extracted from body skeleton and aggregated
through time, thus building a trajectory. Each trajec-
tory is then represented using deep neural networks to
better encode its morphology. Our hypothesis is that
trajectories are able to encode the necessary informa-
tion from movement to recognize certain anomalous
events. Since our proposed approach is based on tra-
jectories, it is more robust to the aforementioned is-
sues that affect classical approaches based on move-
ment and appearance; furthermore, an advantage of
using trajectories is that the localization of the par-
ticular individual performing an anomalous event is
easily retrieved. In addition, trajectories allow other
applications, such as people behavior analysis. We
illustrate this application by using clustering models,
such that it is possible to characterize the rarity of tra-
jectories (Zhou et al., 2012). It is important to high-
light that the proposed model is oriented to scenes
where people detector techniques and tracking algo-
rithms can offer a good representation, thus, crowded
Colque, R., Cayllahua, E., C. de Melo, V., Chavez, G. and Schwartz, W.
Anomaly Event Detection based on People Trajectories for Surveillance Videos.
DOI: 10.5220/0008952401070116
In Proceedings of the 15th International Joint Conference on Computer Vision, Imaging and Computer Graphics Theory and Applications (VISIGRAPP 2020) - Volume 5: VISAPP, pages
107-116
ISBN: 978-989-758-402-2; ISSN: 2184-4321
Copyright
c
2022 by SCITEPRESS – Science and Technology Publications, Lda. All rights reserved
107

scenes are not considered in the scope of this research.
The novelty and contributions of this work are
summarized as follows. (i) A spatial and temporal tra-
jectory descriptor for anomaly event detection based
on deep neural networks, aiming at describing trajec-
tories by their morphology. (ii) A novel approach for
anomaly recognition extracted from higher level in-
formation. (iii) An heuristic for multi-object tracking
for data association based on Kalman filter. (iv) An
experimental evaluation regarding trajectories and the
relation between anomalies and rarity.
This paper presents a literature review in Sec-
tion 1. Section 2 exposes our approach for anomaly
recognition and rare event analysis. Section 3 con-
tains our experiment results, which show that our
model is competitive with other state of art methods,
and also enforces the idea of using trajectories for
other type of analysis. Section 4 concludes this study
presenting a discussion about advantages and limita-
tions of the complete study.
Related Works
Due to the success of Deep Neural Networks (DNN),
researchers started to employ them to solve the
anomaly recognition problem (Kiran et al., 2018). For
instance, CNN-based approaches describe anoma-
lies by creating models that combine optical flow
and texture information from spatiotemporal re-
gions (Sabokrou et al., 2018). Models that use AE or
Convolutional AE (CAE) (Ribeiro et al., 2017) aim
at describing events in non-supervised fashion. Thus,
anomalies are representations that differ from normal
(i.e., an anomaly occurs when the AE is not able to
perform a satisfactory reconstruction). Similar to AE,
GAN-based approaches learn the normal behavior us-
ing a generative model (Ravanbakhsh et al., 2017),
in which anomalies are recognized by the discrimina-
tor since the generator built an anomaly representa-
tion based in normal situations. Furthermore, RNN
models usually appear accompanied with DNN, spe-
cially for movement data (Chong and Tay, 2017). The
idea is to combine the recurrent information of what
is considered normal and create a representation of
it. Nevertheless, most of these models depend on the
camera position. Thus, these models learn specific
patterns of the camera view which cannot be trans-
ferred to other views without retraining. Similarly
to handcrafted features (De Almeida et al., 2017),
these techniques also extract texture (appearance) and
movement (flow) information. On the other hand, in
our model, the source of information for anomaly rep-
resentation is different. Specifically, our model ex-
tracts information from trajectories. An important dif-
ference with these models is the fact that our model is
not affected by large color intensity changes.
Anomaly recognition models based on trajecto-
ries (Wang et al., 2008) are among first approaches
in visual anomaly recognition. The main drawback of
this model was the problem of people detection and
trajectory building. However, with novel approaches
and technologies, this issue has been progressively re-
duced. The model proposed by Cosar et al. (Cosar
et al., 2017) considers trajectories to build regions
which are examined in a time lapse to find texture
and movement information. The process is divided
into two phases: description and filtering. Li et al.(Li
et al., 2013) proposed a technique that describes the
scene using a sparse representation of overlapping tra-
jectories, these trajectories are grouped and abnormal
events are recognized when they differs much from
any cluster. While Saini et al. (Saini et al., 2018) used
trajectories to train a Hidden Markov Model (HMM)
combined with genetic algorithm to detect anoma-
lies by their low probability,the model proposed by
Zhou et al. (Zhou et al., 2015) developed a method
based on HMM and feature clustering. An impor-
tant difference between these approaches and ours
is that our model does not segment the trajectories
in parts or blocks, it focuses in complete trajectory.
Furthermore, for surveillance purposes, region based
models analyze motion characteristics, which are not
meaningful without accurate localization of the tar-
gets. Thus, trajectories present the complete event
that contains the anomaly.
2 PROPOSED APPROACH
In this section, we present the proposed approach for
anomaly detection comprising four main steps: (i)
reference point estimation, (ii) tracking building, (iii)
feature extraction, and (iv) anomaly and rare trajec-
tory detection. Figure 1 presents an overview of our
approach.
2.1 Reference Point Estimation
The first stage of our model computes the reference
points in a frame, they represent a determinate per-
son. In the literature, we can find accurate object
and person detectors (Redmon and Farhadi, 2017).
These detectors provide the bounding box of the de-
tected person/object. Although, the person is inside
the bounding box, the four points defining the bound-
ing box do not represent a reliable reference to lo-
cate the person inside this bounding box, due to the
bounding box varying size. For instance, a person
VISAPP 2020 - 15th International Conference on Computer Vision Theory and Applications
108

with stretched arms will have a larger bounding box
than a person with closed arms. Another case where
the bounding box coordinates are not reliable as ref-
erence points is when the detector detects a group of
persons and their bounding box changes in size in ev-
ery frame. To overcome this, our approach defines the
reference point of a person as the joint point between
body and head. This is a very robust reference point,
as it rarely changes and it more stable compared to the
movements of other parts in the body (Morais et al.,
2019). In order to compute this reference point, we
use a multi-person pose estimator (Cao et al., 2017).
This model extracts the person skeleton including the
point between head and body parts.
2.2 Trajectory Building
The next step of our approach is to create the trajec-
tories for each person. The goal is to connect ref-
erence points, relating them frame by frame and la-
beling the set with a person identifier. Multi-object
tracking is a np-hard problem (Betke and Wu, 2016).
Therefore, inspired on (Girdhar et al., 2018), we in-
troduce an algorithm (see Alg. 1) that aims to offer a
straightforward alternative to complex multi-tracking
Figure 1: Overview of our approach. Given a body skeleton,
we select reference points that are used to build trajectories.
A sequence of such reference points consists of a trajectory.
Then, we describe the normalized trajectories using two dif-
ferent techniques, a convolutional descriptor based on CNN
or a recurrent descriptor modeled using a RNN. During the
testing phase, we recognize anomalies and rare trajectories
by comparing the descriptors extracted from each test sam-
ple regarding the trained model.
models. Given a tracklet set T and a set of reference
points R
j
observed at a frame j, our algorithm asso-
ciates the reference points with their respective track-
lets; the algorithm also creates a new tracklet if a new
person observation appears. Initially, T is an empty
set (T =
/
0); after the first iteration, any new reference
point is associated to a tracklet.
Algorithm 1: Trajectory Builder algorithm.
1: procedure TRAJECTORY(T , R
j
)
2: for each r ∈ R
j
do
3: for each t ∈ T do
4: S[r,t] ← Scr(r, t),
5: M ← Munkres(S),
6: T ← Update(R
j
, T , M)
7: return T
The algorithm computes the relationship between
one reference point and its corresponding tracklet.
For a frame j + 1, we compute a set of reference
points R
j+1
, in order to associate every element in
R
j+1
to a tracklet in T , which contains a Kalman fil-
ter K. This model allow us to predict from R
j
the
new positions of such reference points in the frame
j + 1. Our algorithm computes the best fitting track-
let t for a r ∈ R
j+1
, we build a matrix M
|R
j
|×|T |
that
contains the scores between a tracklet and each refer-
ence point. From this matrix, we can look for the best
match between a reference point and a tracklet.
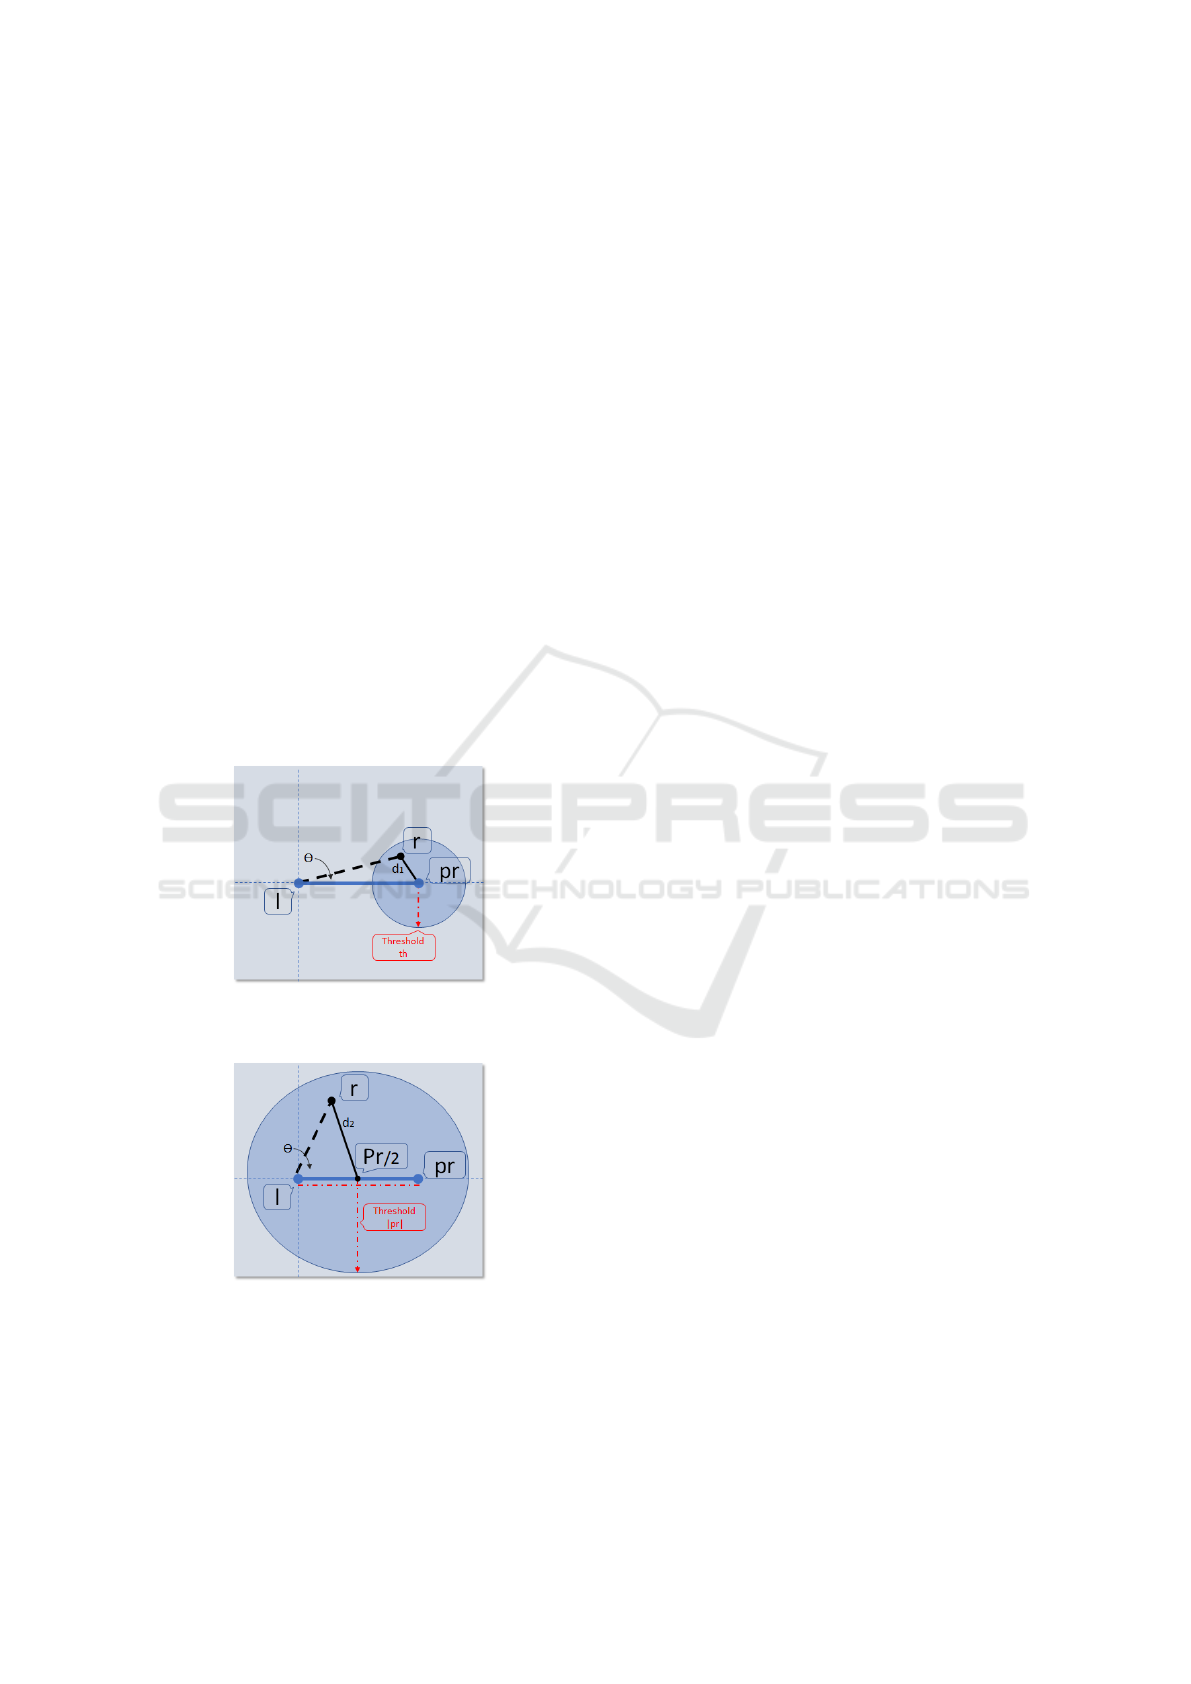
To compute the score point between a tracklet t =
(l, pr,K,P) and reference point r, l is subtracted from
r and pr in such a way that l is considered as coordi-
nate origin. Let be the result of a = (¯r. ¯pr)/k¯rk.k ¯prk,
this value is truncated between [−1,1]. Thus, the an-
gle between r and pr is θ
k, j
= arccos(a) is in the range
[0,π]. The final score is given by
Scr(r,t) =
θ
k, j
if δ
1
< th + b f ,
θ
k, j
× τ if δ
2
< k ¯prk,
π × τ otherwise,
(1)
where δ
1
= kp− prk is the distance between reference
point r and the predicted point pr, b f = th/(2 × |P|)
is a value that is inversely proportional to the num-
ber of elements in the set P, δ
2
= kr − pr/2k is the
distance from point r and the middle point of l and
pr, as l is the origin of coordinates then, this point is
half pr, the variable th is a threshold value that is set
before the process and depends on the size of people
in the video, and τ ≥ 2 is a penalty value. The idea
of the score function is to assign a low value to the
compared point that is closer to the predicted point,
as we can see in Figure 2. Using the variable b f ,
we extend the initial threshold and balance the initial
prediction of the Kalman model, specifically for the
Anomaly Event Detection based on People Trajectories for Surveillance Videos
109
initial points, where the Kalman model is not stable.
Initially, the variable b f allow us to be more robust in
the first iterations of the algorithm, where there is not
enough information about trajectories and the Kalman
filter produce predictions with noise. Variable b f de-
creases as there are more detected points in the trajec-
tory. The second case of the score function is when
the point is not sufficiently near to the predicted point
but it is close to the trajectory flow, as shown in Fig-
ure 3. The idea in this case is to cover a greater region
where candidate point could move, including a little
region behind the last trajectory point. In last case, the
candidate point is outside of the possible regions of
movement. The set M contains all the scores between
reference points in R and tracklets in T . In the next
state, our approach computes the best distribution us-
ing Munkres’ algorithm (Zhu et al., 2016) to solve
the assignment problem. After that, the points are as-
signed to a specific trajectory. Unassigned points cre-
ate new tracklets. Finally, all trajectories update their
information (Kalman model and predicted point), and
trajectories that do not present changes within time
lapse are closed and saved to avoid confusing with
new trajectories.
Figure 2: Example of situation when a predicted point of
Kalman is near to a candidate point.
Figure 3: Example of situation when a predicted point of
Kalman is far from a candidate point.
2.3 Trajectory Point Reduction and
Augmentation
Once every trajectory is collected, the trajectories
must have the same number of points to use this infor-
mation as input for the models. Therefore, we reduce
or increase the number of points up to a certain value
by employing a point reduction or point augmentation
process. The problem in the first process lies in the
choice of significant points. To solve this, our model
selects the points that better represent the shape of
the trajectory, giving preference to the points where
there is more variation, such as curves. To select these
points, the model applies the second derivative to the
set of points. The highest values represent the curves
in the shape of trajectory. Thus, our model chooses
the interest points by sorting from largest to the small-
est the values obtained by the second derivative. Fig-
ure 4 illustrates the idea of this process, where the first
row depicts the images with the first derivatives of the
trajectories, the highest values are the key points, and
the second row shows the chosen points. Hence, with
this heuristic, we reduce the number of points in a tra-
jectory. For the point augmentation, our model per-
forms a straightforward strategy. Depending on the
number of required points, they are introduced in the
middle of two consecutive points. This process is per-
formed initially in the original set of points, if more
points are needed, the process is repeated until the
number of necessary points is reached. Finally, all
the trajectories have the same number of points n.
2.4 Feature Extraction
Unsupervised representation learning has become an
important tool for anomaly detection. An autoencoder
is a neural network trained through backpropagation
that provides a dimensionality reduction by minimiz-
ing the reconstruction error on the training set (Kiran
et al., 2018). Our approach presents two feature ex-
traction models based on unsupervised learning: first
descriptor TAoT-M, based on an image representation
extracted from a convolutional autoencoder, and sec-
ond descriptor TAoT-T, which directly utilizes the tra-
jectory information in a recurrent autoencoder. In-
spired by (Zhang and Lu, 2004), the idea of the first
descriptor (based on convolution) is to find a repre-
sentation that depicts the trajectory as a complete en-
tity (i.e., without segmenting or dividing it). There-
fore, the goal is to describe the morphology of the
trajectory. To accomplish this goal, our approach
computes the variation between each pair of points
belonging to a given trajectory into two matrices:
angular (referred to as AG) and radial (RD), which
VISAPP 2020 - 15th International Conference on Computer Vision Theory and Applications
110
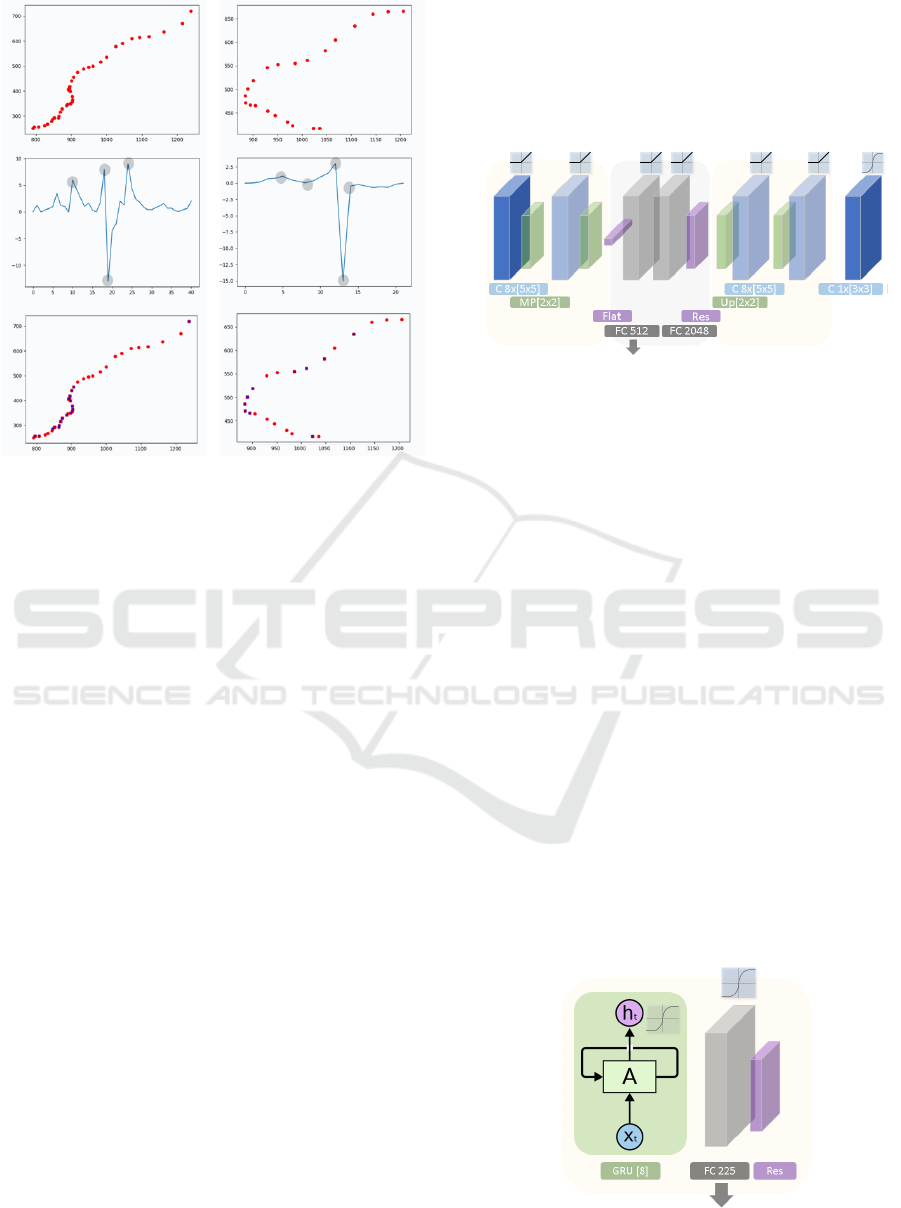
Figure 4: Examples for point selection when the number
or points have to be reduced. The first row corresponds
to trajectory examples. the second row is the set of first
derivative, circles show some interest points. The third row
presents the selected points marked in blue.
are square matrices of dimension n × n. The posi-
tion AG
a,b
is filled with the angle formed by points
p
a
, p
b
∈ T
j
. Similarly, the position RD
a,b
is filled
with the magnitude of the vector formed by points
p
a
, p
b
∈ T
j
. Thus, local information is saved in places
that are near to the diagonal of the matrix, while the
global information appears closer to the edges of the
matrix. Radial matrix RD is symmetric, while in the
angular matrix, the values are complements between
superior and inferior triangular sections of the matrix.
These images are n × n matrices, where n is the tra-
jectory’s number of points.
Afterwards, these images are described by a con-
volutional autoencoder. Similar to Kasparavi
˘
ciut
˙
e ap-
proach (Kasparavi
ˇ
ci
¯
ut
˙
e et al., 2019), our first descrip-
tor is a Encoder and decoder model, which is com-
posed by two convolutional layers, each layer with
eight filters, whose convolutional mask size is 5 × 5,
followed by max pooling and up sampling layers of
size 2 × 2. In the middle of this representation, the
convolutional autoencoder architecture presents two
fully connected layers, with 512 and 2048 neurons,
respectively, at the end of the decoder part flatten and
reshape layer are used to synthesize the information.
The idea of this architecture is to find a semantic rep-
resentation from angular and radial matrices. This
network is trained with only normal trajectory images
normalized between [0, 1]. After the model computes
the weights, trajectory features are extracted from the
first fully connected layer (512). The feature vector
is the concatenation of outputs of angular and radial
convolutional autoencoder. Hence, the final represen-
tation is a vector of 1024 dimensions. Figure 5 depicts
the autoencoder architecture.
Figure 5: Architecture for convolutional autoencoder.
The second descriptor builds the feature vectors
using a recurrent autoencoder. Similar to the previ-
ous model, the idea in this approach is to find an en-
tire representation for the trajectory by correlating the
morphology and the temporal information. Thus, the
proposed network learns the temporal trajectory pat-
terns. Composed by only three layers, it begins with
a recurrent cell, which in our approach is a Gated Re-
current Unit (GRU) (Chung et al., 2014). We opted to
use GRU instead of other recurrent architectures, such
as LSTM, because they are better suited for small
training sets (Chung et al., 2014). The input for this
cell is the set of overlapping segments that compose
the trajectory. The next element is a fully connected
layer with 225 neurons. Both layers, recurrent cell
and fully connected utilize sigmoid as activation func-
tion. At the end of the pipeline, the model reshapes
the output to the same input size, thus the recurrent
autoencoder can learn the trajectory patterns. This
network is also trained with only normal trajectories.
The final descriptor for a trajectory is the output of the
fully connected layer, a vector comprising 225 dimen-
sions. Figure 6 presents the architecture for recurrent
autoencoder.
Figure 6: Architecture for recurrent autoencoder.
Anomaly Event Detection based on People Trajectories for Surveillance Videos
111

2.5 Anomaly Recognition and Rare
Trajectory Identification
In the last step, our model is divided in two ap-
proaches: anomaly trajectory detection and rare tra-
jectory identification. While the first addresses the
problem of identifying anomalies, the second il-
lustrates an application of people behavior analy-
sis by characterizing uncommon trajectories. The
strategy for anomaly detection is simple, our model
computes nearest neighbor for each point in test-
ing (Mora Colque et al., 2017). Thus, if the distance
of this point is smaller than a threshold ∆, at least
for one point in training, then this test point is nor-
mal. Otherwise, if the distance to any training point
is larger than the threshold ∆, then it is considered an
anomalous point or trajectory. Each descriptor were
tested separately. In rare trajectory identification, we
suppose that points that represent common trajecto-
ries make clusters in the space, and anomalies are iso-
lated points or they are in groups with few elements.
Thus, our model groups the trajectories using a clus-
tering Affinity Propagation (AP) model. An advan-
tage of using an AP model is that it does not need to
set the number of clusters. Thus, given a trained and
testing features, these representations can be seen as
points in the space, where anomalies can be consid-
ered as outliers (Aggarwal, 2013). The second aims
to find rare patterns, in fact, rare trajectories are whose
that are not common, and possibly they are found in
small clusters far from common.
3 EXPERIMENTAL RESULTS
In this section, we present our experimental evalua-
tion. First, we describe the results regarding anomaly
detection and then present the results achieved on the
rare trajectory recognition task. Experiments were
performed on the following datasets: Subway (Adam
et al., 2008), Avenue (Lu et al., 2013), and our pro-
posed video dataset, named Laboratory.
The setup for the tracking step depends on the
video scene. Each dataset has a different setup, ba-
sically due to the people that appear on the scene be-
ing near or far from the camera. We fixed the num-
ber of points per trajectory to n = 64. For the recur-
rent autoencoder, the GRU input is the trajectory di-
vided in segments, each segment composed of eight
points with an overlap of four points between them
for each segment. This autoencoder was trained af-
ter 200 epochs, using sigmoid function for the ac-
tivation and hard sigmoid the recurrent activation.
We employed mean square error as loss function and
AdaDelta algorithm for optimizer. For the convolu-
tional autoencoder, the training phase was limited to
300 epochs, using mean square error as loss func-
tion and the Adam optimizer algorithm. The aver-
age loss value during training were 0.0001 and 0.01
for recurrent and convolutional networks respectively.
These protocols were the same for all datasets. The
∆ ∈ [0,10] value for KNN distance algorithm is used
to build the Receiver Operating Characteristic (ROC)
curves.
3.1 Anomaly Recognition
The subway dataset (Adam et al., 2008) is composed
of two sequences. The first video sequence, known
as Entrance Gate, has a time length of one hour and
36 minutes and the second video, called Exit Gate
has length of 43 minutes. Entrance Gate is a se-
quence recorded from a subway entrance gate view.
The ground-truth in this clip presented both types
of anomalies: walking on wrong way and jumping
the ticket gate. For this sequence, we compare our
results with the state-of-the-art approaches proposed
by (Roshtkhari and Levine, 2013) (Sparce), (Cheng
et al., 2015) (GPR), (Li et al., 2014) (Bayes),
(Saligrama and Chen, 2012) (Agr) and (Mora Colque
et al., 2017). Figure 7 shows our experimental results
and the comparison with the state-of-the-art. Our re-
current descriptor achieved a promising result com-
pared with recent methods in the literature. However,
our convolutional descriptor missed some anomalies,
specifically the ticket jumping, because the convolu-
tional autoencoder aims to describe the morphology
of the trajectory and when the people jump the ticket
gate the morphology of the trajectory is similar with
other normal trajectories. The Exit Gate clip contains
data recorded from a subway exit. In this case, the
ground-truth considers only people walking in wrong
way. We compare our results with (Li et al., 2014)
(Bayes) and (Mora Colque et al., 2017) (HOFME)
methods. Figure 8 presents the results for this clip,
in this case, our recurrent descriptor outperforms the
other models. The convolutional descriptor reports
low AUC compared with the other methods in this set
as well.
Train Sequence. The train sequence is part of a set of
videos for anomaly detection proposed by (Zaharescu
and Wildes, 2010). This video clip has a view from
the interior of a train coach and is the only sequence
in the dataset that contains people in the scenes. It
has 19,218 frames which are very challenging due
to drastic variation in lighting conditions and cam-
era jitter. The anomalies in this sequence comprise
people coming out and moving on the train. For
VISAPP 2020 - 15th International Conference on Computer Vision Theory and Applications
112
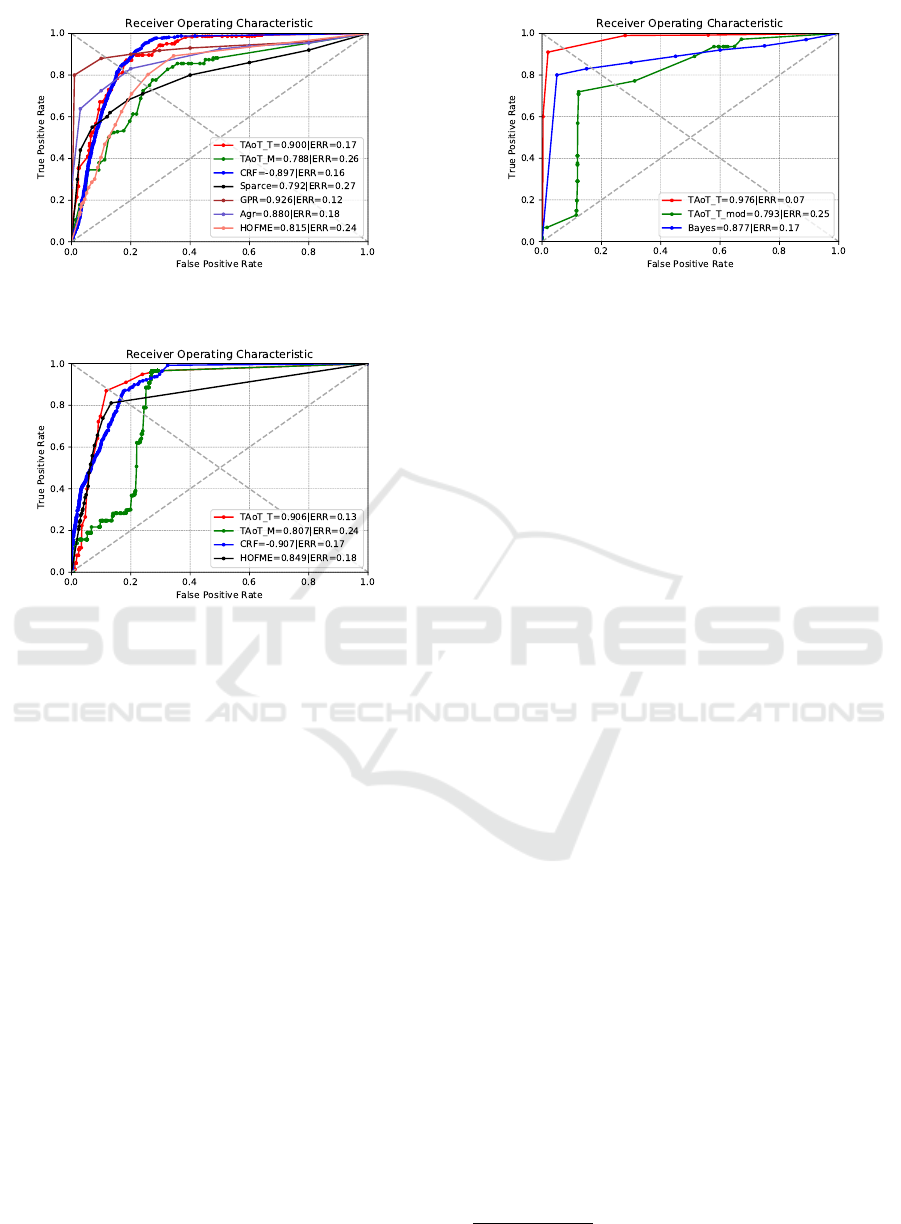
Figure 7: Experimental results and comparison with the
state-of-the-art on the Entrance.
Figure 8: Experimental results and comparison with the
state-of-the-art on the Exit.
this video sequence, we present two results, where
“TAoT-T-mod” (green colored curve) and “TAoT-T”
(red colored curve), both using recurrent descriptor.
The first experiment was performed training with 800
frames and testing with the rest of the video. The sec-
ond experiment “TAoT-T”, which follows the original
ground-truth validation protocol, the number of train-
ing frames are 800 and for testing only the last 5000.
These experiments have two goals, first we want to
evaluate our recurrent descriptor, which presents bet-
ter results for anomaly detection in a difficult light-
ing condition sequence. Figure 9 shows our results
and the results achieved by the Bayes method (Cheng
et al., 2016). The second experiment obtained better
results because the information for trajectories were
clear in contrast with the first aforementioned exper-
iment. Also, according to the results shown in Fig-
ure 9, our model outperforms the Cheng’s method
because, to build the trajectories, our model utilizes
a pose estimation/person detector, which is robust to
problems of illumination changes, camera movement,
shadows, etc.
Avenue Dataset. Introduced by (Lu et al., 2013), the
avenue dataset contains videos from entrance avenue
at the Chinese University of Hong Kong (CUHK) and
is composed of 16 training videos and 21 test clips.
Figure 9: ROC curves for Train sequence.
Testing videos include both normal and anomalous
events. It comprises three types of anomalies: run-
ning, wrong direction and abnormal object. Abnor-
mal object sequences contains a person that pulls up a
backpack. In this work, we did not test the sequences
that contain this type of anomalies. Thus, our exper-
iments were performed without sequences 5, 10, 12,
13, 14, 16, 17 and 20. All videos for training were
used to tune the network. In this experiment, we just
tested the recurrent descriptor. According to Table 1,
TAoT-T achieves the best result in sequence 18 and
the worst in sequence 19. In this last sequence, the
missed anomaly is a person walking in a wrong direc-
tion towards the camera, but due to the projection, the
generated trajectory was too small. Such issues could
be minimized by employing depth information. We
should add that we cannot compare this experiment
with other works in the literature due to sequence
reduction in our experiments. However, comparing
only the mean AUC with other studies (Hasan et al.,
2016)(Kiran et al., 2018) our results are still compet-
itive.
The experiments performed to identify rare trajec-
tories intend to separate or identify trajectories that
are not usual. The criterion is simple, clustering tra-
jectories to segment common from uncommon. Rare
trajectories are useful because they are not necessarily
anomalies, but could be suspicious events that would
trigger an alarm. For these experiments, we introduce
a novel dataset called Laboratory, which contains one
month of recordings of the entrance of a laboratory
1
.
The video resolution is 1280 × 720, recorded at a
frame rate of 30 FPS. The videos have length between
30 seconds and four minutes. The ground-truth is
based on people behavior, for instance, a person stay-
ing for a long time at the door or going around suspi-
ciously. For training, we selected 10 days of record-
ings (1,100 normal trajectories), and the remaining
1
Videos and ground-truth annotations will be provided
soon.
Anomaly Event Detection based on People Trajectories for Surveillance Videos
113
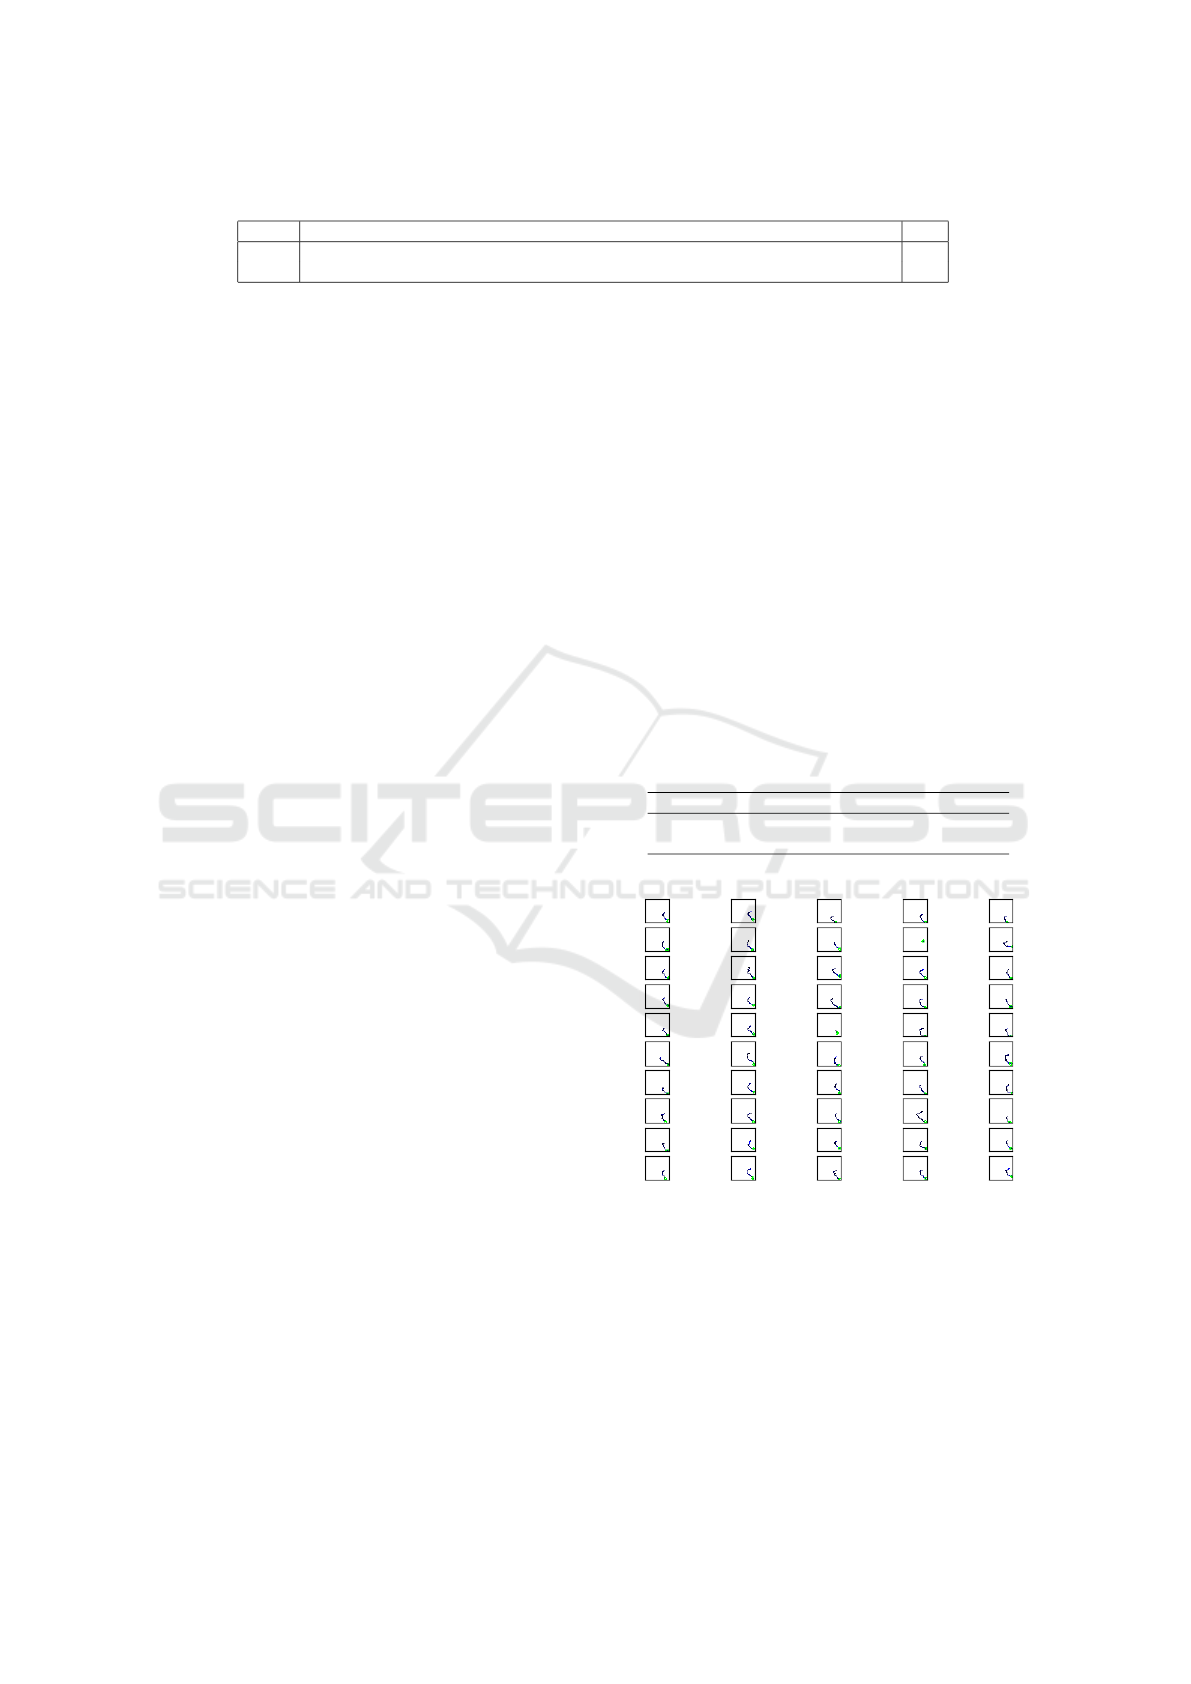
Table 1: AUC and ROC for Avenue sequences. Highlighted in bold, we present our best and worst result.
Seq. 1 2 3 4 6 7 8 9 11 15 18 19 21 µ
AUC .69 .80 .44 .94 .84 .88 .82 .80 .74 .50 .95 .22 .61 .71
ERR .45 .24 .53 .22 .21 .21 .29 .29 .34 .47 .9 .51 .35 .32
for testing (2,946 normal and abnormal trajectories).
Videos contain at least one person and might have up
to 10 people in the same scene.
We evaluate both the convolutional descriptor and
recurrent descriptor. In our data “TAoT-T” represen-
tations generates 58 clusters, where most of anoma-
lies appear in clusters with few elements. “TAoT-
M” feature vectors generate 141 clusters, also, low
populated clusters contains the anomalous trajecto-
ries. Note that without any previous information
about anomalies these events that are in clusters with
few elements could be considered as rare events. An-
other important aspect to highlight is that our descrip-
tors encode important information about trajectories
like: morphology, orientation and speed.
3.2 Rare Trajectory Identification
The experiments performed to identify rare trajecto-
ries intend to separate or identify trajectories that are
not usual. The criterion is simple, clustering trajecto-
ries to segment common from uncommon. Rare tra-
jectories are useful because they are not necessarily
anomalies, but could be suspicious events that would
trigger an alarm. For these experiments, we introduce
a novel dataset called Laboratory.
The Laboratory dataset contains one month of
recordings of the entrance of a laboratory. The video
resolution is 1280 × 720, recorded at a frame rate
of 30 FPS. The videos have length between 30 sec-
onds and four minutes. The ground-truth is based
on people behavior, for instance, a person staying
for a long time at the door or going around suspi-
ciously. For training, we selected 10 days of record-
ings (1,100 normal trajectories), and the remaining
for testing (2,946 normal and abnormal trajectories).
Videos contain at least one person and might have
up to 10 people in the same scene. Therefore, each
video is labeled as normal which means that people
just enter or leaving the room where their trajectories
are smoothed lines or curves, in contrast to anoma-
lous sequences where people remaining in the scene
for long time, thus their trajectories present a complex
morphology.
We evaluate both the convolutional descriptor and
recurrent descriptor. Table 2 shows the clustering re-
sults, which reports the number of clusters created,
the cluster with the smallest number of trajectories
and the one with largest number. Clusters with a
small number of trajectories are trajectories that have
unusual morphology, but are not necessarily anoma-
lies. We see that TAoT-M creates more clusters than
TAoT-T, and, therefore, is able to find more rare tra-
jectories. This shows that TAoT-M is better at encod-
ing more fine-grained differences between the trajec-
tories. Despite this, TAoT-T still yields better results
on anomaly detection, since it is able to group spa-
tially similar trajectories, while anomalies have very
dissimilar morphology. Figures 10 and 11 show an
example of rare trajectory identification, these images
are thumbnails from original trajectories, the circle
(green) represents the initial point of each trajectory.
It is important to highlight that our descriptors pre-
serve also the direction as well as the morphology
of the trajectories. Normal cluster, like the example
in Figure 10, contains normal trajectories, in contrast
with anomaly cluster, as the example in Figure 11,
contains anomaly trajectories inside.
Table 2: Clustering chart for Rare Trajectory Identification.
Descriptor N. Clus. Min. Ele Max. Ele
TAoT-T 58 5 212
TAoT-M 141 3 133
Figure 10: Example of normal cluster and rare cluster us-
ing Convolutional descriptor. This cluster has 73 elements
(only 50 presented) and correspond to a normal situation.
4 CONCLUSIONS
In this work, we proposed a new method to detect
anomalous events based on the trajectory informa-
tion of person/objects. Tracking people in very crowd
scenes is a difficult task, in some cases many trajec-
VISAPP 2020 - 15th International Conference on Computer Vision Theory and Applications
114

Figure 11: Example of normal cluster and rare cluster using
Convolutional descriptor. This cluster contains 10 elements,
it presents anomaly trajectories.
tories may be related to one person. However, the
idea is to warn the existence of strange events and
one trajectory is enough to identify the person. Thus,
in our study we propose a straightforward heuristic
for multi-person tracking, the idea of this approach
is to obtain a smooth trajectory for people. Other
tracking models could be used as long as the result
is faithful to the movement of the person and that
considers a fixed point of reference. Following the
experiment results, the Recurrent descriptor suits bet-
ter for anomaly trajectory recognition, while convolu-
tional descriptor works fine for rare trajectory analy-
sis, this is due to characteristics of convolutional de-
scriptor, that groups the trajectories by morphology,
which is a interesting property to cluster. As future
work, we plan to evaluate other person/object track-
ing algorithms. We can also explore new representa-
tion of trajectories based on a mixture of Recurrent
autoencoder and adversarial autoencoders (Makhzani
et al., 2016) that better discriminates the abnormal tra-
jectories so we have an improved detection of outliers.
REFERENCES
Adam, A., Rivlin, E., Shimshoni, I., and Reinitz, D. (2008).
Robust real-time unusual event detection using mul-
tiple fixed-location monitors. IEEE Transactions
on Pattern Analysis and Machine Intelligence, pages
555–560.
Aggarwal, C. C. (2013). Outlier analysis. Springer Pub-
lishing Company, Incorporated.
Betke, M. and Wu, Z. (2016). Data Association for Multi-
Object Visual Tracking, volume 6. Synthesis Lectures
on Computer Vision.
Cao, Z., Simon, T., Wei, S.-E., and Sheikh, Y. (2017). Real-
time multi-person 2d pose estimation using part affin-
ity fields. In The IEEE Conference on Computer Vi-
sion and Pattern Recognition (CVPR).
Cheng, K.-w., Chen, Y.-t., and Fang, W.-h. (2015). Gaussian
Process Regression-Based Video Anomaly Detection
and Localization With Hierarchical Feature Represen-
tation. IEEE Transactions on Image Processing, pages
5288–5301.
Cheng, K. W., Chen, Y. T., and Fang, W. H. (2016). An effi-
cient subsequence search for video anomaly detection
and localization. Multimedia Tools and Applications,
pages 15101–15122.
Chong, Y. S. and Tay, Y. H. (2017). Abnormal event detec-
tion in videos using spatiotemporal autoencoder. Lec-
ture Notes in Computer Science (including subseries
Lecture Notes in Artificial Intelligence and Lecture
Notes in Bioinformatics), pages 189–196.
Chung, J., Gulcehre, C., Cho, K., and Bengio, Y. (2014).
Empirical evaluation of gated recurrent neural net-
works on sequence modeling. In NIPS 2014 Workshop
on Deep Learning, December 2014, pages 1–9.
Cosar, S., Donatiello, G., Bogorny, V., Garate, C., Alvares,
L. O., and Bremond, F. (2017). Toward Abnormal
Trajectory and Event Detection in Video Surveillance.
IEEE Transactions on Circuits and Systems for Video
Technology, pages 683–695.
De Almeida, I. R., Cassol, V. J., Badler, N. I., Musse, S. R.,
and Jung, C. R. (2017). Detection of Global and Lo-
cal Motion Changes in Human Crowds. IEEE Trans-
actions on Circuits and Systems for Video Technology,
pages 603–612.
Du, D., Qi, H., Huang, Q., Zeng, W., and Zhang, C. (2013).
Abnormal event detection in crowded scenes based
on Structural Multi-scale Motion Interrelated Patterns.
Proceedings - IEEE International Conference on Mul-
timedia and Expo, pages 1–8.
Girdhar, R., Gkioxari, G., Torresani, L., Paluri, M., and
Tran, D. (2018). Detect-and-Track: Efficient Pose Es-
timation in Videos. Proceedings of the IEEE Com-
puter Society Conference on Computer Vision and
Pattern Recognition, pages 350–359.
Hasan, M., Choi, J., Neumann, J., Roy-Chowdhury, A. K.,
and Davis, L. S. (2016). Learning Temporal Regular-
ity in Video Sequences. IEEE Conference on Com-
puter Vision and Pattern Recognition, pages 1–31.
Kasparavi
ˇ
ci
¯
ut
˙
e, G., Thelin, M., Nordin, P., S
¨
oderstam, P.,
Magnusson, C., and Almljung, M. (2019). Online
encoder-decoder anomaly detection using encoder-
decoder architecture with novel self-configuring neu-
ral networks and pure linear genetic programming for
embedded systems. In Proceedings of the 11th In-
ternational Joint Conference on Computational Intel-
ligence - ECTA, (IJCCI 2019), pages 163–171. IN-
STICC, SciTePress.
Kiran, B. R., Thomas, D. M., and Parakkal, R. (2018).
An overview of deep learning based methods for un-
supervised and semi-supervised anomaly detection in
videos. J. Imaging, 4:36.
Li, C., Han, Z., Ye, Q., and Jiao, J. (2013). Visual abnormal
behavior detection based on trajectory sparse recon-
struction analysis. Neurocomputing, pages 94–100.
Li, W., Mahadevan, V., and Vasconcelos, N. (2014).
Anomaly detection and localization in crowded
scenes. IEEE Transactions on Pattern Analysis and
Machine Intelligence, pages 18–32.
Lu, C., Shi, J., and Jia, J. (2013). Abnormal event detec-
tion at 150 fps in matlab. In 2013 IEEE International
Conference on Computer Vision, pages 2720–2727.
Anomaly Event Detection based on People Trajectories for Surveillance Videos
115

Makhzani, A., Shlens, J., Jaitly, N., and Goodfellow, I.
(2016). Adversarial autoencoders. In International
Conference on Learning Representations.
Mora Colque, R. V. H., Caetano, C., De Andrade, M. T. L.,
and Schwartz, W. R. (2017). Histograms of Opti-
cal Flow Orientation and Magnitude and Entropy to
Detect Anomalous Events in Videos. IEEE Transac-
tions on Circuits and Systems for Video Technology,
27:673–682.
Morais, R., Le, V., Tran, T., Saha, B., Mansour, M., and
Venkatesh, S. (2019). Learning regularity in skele-
ton trajectories for anomaly detection in videos. In
The IEEE Conference on Computer Vision and Pat-
tern Recognition (CVPR).
Popoola, O. P. and Wang, K. (2012). Video-based abnormal
human behavior recognition, a review. IEEE Transac-
tions on Systems, Man, and Cybernetics, Part C Ap-
plications and Reviews, pages 865–878.
Ravanbakhsh, M., Nabi, M., Sangineto, E., Marcenaro, L.,
Regazzoni, C., and Sebe, N. (2017). Abnormal event
detection in videos using generative adversarial nets.
In 2017 IEEE International Conference on Image Pro-
cessing (ICIP), pages 1577–1581.
Redmon, J. and Farhadi, A. (2017). Yolo9000: Better,
faster, stronger. 2017 IEEE Conference on Computer
Vision and Pattern Recognition (CVPR), pages 6517–
6525.
Ribeiro, M., Lazzaretti, A. E., and Lopes, H. S. (2017).
A study of deep convolutional auto-encoders for
anomaly detection in videos. Pattern Recognition Let-
ters, pages 1–10.
Roshtkhari, M. J. and Levine, M. D. (2013). Online dom-
inant and anomalous behavior detection in videos. In
2013 IEEE Conference on Computer Vision and Pat-
tern Recognition, pages 2611–2618.
Sabokrou, M., Fayyaz, M., Fathy, M., Moayed, Z., and
Klette, R. (2018). Deep-anomaly: Fully convolutional
neural network for fast anomaly detection in crowded
scenes. Computer Vision and Image Understanding.
Saini, R., Pratim Roy, P., and Prosad Dogra, D. (2018). A
segmental HMM based trajectory classification using
genetic algorithm. Expert Systems with Applications,
pages 169–181.
Saligrama, V. and Chen, Z. (2012). Video anomaly detec-
tion based on local statistical aggregates. Proceedings
of the IEEE Computer Society Conference on Com-
puter Vision and Pattern Recognition, pages 2112–
2119.
Wang, X., Ma, K. T., Ng, G.-W., and Grimson, W. (2008).
Trajectory analysis and semantic region modeling us-
ing a nonparametric Bayesian model. 2008 IEEE Con-
ference on Computer Vision and Pattern Recognition,
pages 1–8.
Zaharescu, A. and Wildes, R. (2010). Anomalous behaviour
detection using spatiotemporal oriented energies, sub-
set inclusion histogram comparison and event-driven
processing. In Proceedings of the 11th European Con-
ference on Computer Vision: Part I, pages 563–576.
Zhang, D. and Lu, G. (2004). Review of shape representa-
tion and description techniques. Pattern Recognition,
pages 1–19.
Zhou, B., Wang, X., and Tang, X. (2012). Understanding
collective crowd behaviors: Learning a mixture model
of dynamic pedestrian-agents. In 2012 IEEE Con-
ference on Computer Vision and Pattern Recognition,
pages 2871–2878.
Zhou, S., Shen, W., Zeng, D., and Zhang, Z. (2015). Un-
usual event detection in crowded scenes by trajectory
analysis. ICASSP, IEEE International Conference on
Acoustics, Speech and Signal Processing - Proceed-
ings, pages 1300–1304.
Zhu, H., Liu, D., Zhang, S., Zhu, Y., Teng, L., and Teng, S.
(2016). Solving the Many to Many assignment prob-
lem by improving the Kuhn-Munkres algorithm with
backtracking. Theoretical Computer Science, pages
30–41.
VISAPP 2020 - 15th International Conference on Computer Vision Theory and Applications
116
