
Adaptative Clinical Decision Support System using Machine
Learning and Authoring Tools
Jon Kerexeta
1a
, Jordi Torres
1b
, Naiara Muro
1,2,3 c
, Kristin Rebescher
1
and Nekane Larburu
1,2 d
1
Vicomtech Research Centre, Donostia, Spain
2
Biodonostia Health Research Institute, Donostia, Spain
3
Sorbonne Universités, UPMC Univ Paris 06, INSERM, Université Paris 13, Sorbonne, Paris Cité,
UMR S 1142, LIMICS, Paris, France
Keywords: Authoring Tool, Machine Learning, CDSS, Decision Tree.
Abstract: Clinical Decision Support Systems (CDSS) offer the potential to improve quality of clinical care and patients’
outcomes while reducing medical errors and economic costs. The development of these systems results
difficult since (i) generating the knowledge base that CDSS use to evaluate clinical data requires technical
and clinical knowledge, and (ii) usually the reasoning process of CDSS is difficult to understand for clinicians
leading to a low adherence to the recommendations provided by these systems. Hereafter, to address these
issues, we propose a web-based platform, named Knowledge Generation Tool (KGT), which (i) enables
clinicians to take an active role in the creation of the CDSSs in a simple way, and (ii) clinicians’ involvement
can turn in an improvement of the model predictor capabilities, while their comprehension of the reasoning
process of the CDSS is increased. The KGT consist on three main modules: DT building, which implements
machine learning methods to extract automatically decision trees (DTs) from clinical data frames; an
authoring tool (AT), which enables the clinicians to modify the DT with their expert knowledge, and the DT
testing, which allows to test any DT, being able to test objectively any modification made by clinician’s expert
knowledge.
1 INTRODUCTION
A Clinical Decision Support System (CDSS) can be
defined as “Software that is designed to be a direct aid
to clinical decision-making, in which the
characteristics of an individual patient are matched to
a computerized clinical knowledge base and patient-
specific assessments or recommendations are then
presented to the clinician or the patient for a decision”
(Sim et al., 2001).These systems provide personalized
recommendations based on patient’s data in order to
help clinicians during the decision-making process.
Its adoption by healthcare systems can improve
patient’s outcomes and wellbeing, provide best
clinical practice to clinicians, while reducing medical
errors and economic costs (Kaushal et al., 2003).
However the development and deployment of these
systems is not a simple task.
a
https://orcid.org/0000-0002-6516-8619
b
https://orcid.org/0000-0003-4818-7620
c
https://orcid.org/0000-0002-6961-062X
d
https://orcid.org/0000-0003-0248-7783
Among the factors that affect most the success of
a CDSS there is the need of having an easy to
maintain knowledge base (KB) (Isern and Moreno,
2008). The KB contains the clinical knowledge of the
system used to provide personalised
recommendations for each patient, thus an easy way
to maintain its contents is necessary to keep the
system updated with the latest available clinical
knowledge. However, this demands both technical
and clinical skills, limiting the role that clinicians can
play into it (Douali and Jaulent, 2013). Furthermore,
usually the reasoning process behind the provided
recommendations is not easy to understand for
clinicians, especially when complex predictor
techniques such as as Machine Learning (ML) are
used during the evaluation of clinical data (Ericsson
et al., 2003). It has been shown that this non-
comprehension is one of the main reasons why
Kerexeta, J., Torres, J., Muro, N., Rebescher, K. and Larburu, N.
Adaptative Clinical Decision Support System using Machine Learning and Authoring Tools.
DOI: 10.5220/0008952200950105
In Proceedings of the 13th International Joint Conference on Biomedical Engineering Systems and Technologies (BIOSTEC 2020) - Volume 5: HEALTHINF, pages 95-105
ISBN: 978-989-758-398-8; ISSN: 2184-4305
Copyright
c
2022 by SCITEPRESS – Science and Technology Publications, Lda. All rights reserved
95

clinicians do not accept the recommendations made
by CDSSs when deployed in real clinical settings.
Despite the general complexity of ML models and
the difficulty to understand and edit its contents, its
use in CDSSs has the potential to notoriously improve
the predictive capabilities of already existent CDSSs
(Larburu et al., 2018; Safdar et al., 2018; Tägil et al.,
2008). Among ML classifiers, Decision Tree (DT)
classifiers are particularly suitable for clinical
classification tasks since they are easy to interpret by
a non-statistician and are intuitive to follow. DTs
support missing values and are able to combine
heterogeneous data types into a single model, whilst
making an automatic selection of the main
characteristics (Shaikhina et al., 2019).
This scenario has led us to build a web-based
Knowledge Generation Tool (KGT) for clinicians
which allow handling and editing DT models to be
used in CDSSs. Henceforth, clinicians are involved in
the construction process of the KB (DT in our case)
which has shown to be beneficial for deepening the
understanding of the CDSSs’ recommendations, and
increasing the predictive capacity of the classifiers
Furthermore, it deals with the aforementioned trust
issues of clinicians regarding the origin of the
provided recommendations, as they can understand
the reasoning process behind the provided
recommendation due to their active involvement in
the creation of the KB of the system.
Overall, this work presents a methodology to
create, modify and test an adaptative Clinical
Decision Support System that combines DT machine
learning technique and expert’s knowledge using
authoring tools.
This paper is structured as follows: in Section 2
the state of the art regarding ML algorithms to
generate DTs and frameworks that have been
developed to generate DTs are presented; Section 3
presents the methods to build the adaptative DSS;
Section 4 presents a use case of our application, and
Section 5 concludes the paper and proposes future
work lines.
2 STATE OF THE ART
In this section, it is shown how the use of ML methods
improves the performance of CDSS in the literature,
and, more precisely, the case of DTs. Following,
several platforms developed to generate trees
interactively with non-expert users are introduced.
2.1 Machine Learning Techniques in
CDSS
Due to the capacity of Machine Learning (ML)
methods to extract information from data, they are
widely used to support CDSS. According to the
review of Safdar et al. (Safdar et al., 2018), which
works with ML-based CDSSs for heart disease
diagnosis, the use of ML (i.e. logistic models,
Bayesian neural networks and neural networks) in
CDSS improves the diagnosis of Acute Myocardial
Infarction from 84 to 95%. In the case of ischemia
detection, the use of a CDSS based on a neural
network improves its sensitivity from 81 to 86%
(Tägil et al., 2008).
As mentioned before, tree-based ML methods are
particularly used in CDSSs due to their easy
comprehension for the clinicians and their suitable
results. For example, taking a look at the survey of
data mining algorithms and techniques in mental
health (Alonso et al., 2018), we notice that the DT
method is used between 27.27-57.14% among ML
techniques in health illness (e.g. Alzheimer 33.33%,
depression 27.27%, and schizophrenia and bipolar
disorders 57.14%).
Vidhushavarshini et al. (Vidhushavarshini and
Sathiyabhama, 2017) propose Naïve Bayes (NB) and
J48 tree (J48 in Weka, also known as C4.5) ML
methods to support a CDSS in order to detect thyroid
disease. In this case, J48 tree outperforms the NB
method (81.94 vs 51.77% of accuracy). Nijeweme-
d’Hollosy et al. (Lakshmi et al., 2018) also give
support to CDSS using tree-based ML methods in
lower back pain use cases. CDSSs assist clinicians by
advising which would be the best option for the
patient: consult a GP, consult a physiotherapist or
perform self-care. They trained a decision tree, a
random forest and a boosted tree in a database of
1,288 fictitious cases, and then tested those classifiers
on a real-life database, reaching accuracies of 71%,
53%, and 71% respectively in the testing dataset.
Kumar et al. (Kumar and Sarkar, 2018) made a
classifier combining C4.5 and decision tables. They
compared the performance of this hybrid classifier
with the performance of C4.5 and decision table
classifier in ten public datasets. In general, the hybrid
classifier outperformed both the C4.5 and the
decision table classifier. Finally, Kerexeta et al.
(Kerexeta et al., 2018) presented two classifiers to
predict readmission within 30-days when a Heart
Failure patient is discharged. In the first classifier,
they combined clustering methods with an NB
classifier. In the second classifier, they combined DT
HEALTHINF 2020 - 13th International Conference on Health Informatics
96

with NB. In this case, the first method is the one that
showed better results.
2.2 Web-based Decision Tree
Authoring tools
Different platforms have been developed to allow for
the creation of DT models to analyse clinical data by
non-expert users. Below, some of these platforms are
introduced.
In the work of Kaminski et al. (Kamiński et al.,
2018), a framework that allows the visual generation
of decision trees was presented. The platform allows
the user to build DTs from scratch: the user defines
the nodes and the edges, and manually introduces
model parameters. However, this platform does not
generate DTs automatically using ML techniques.
Additional approaches that allow for user
interaction are outlined in (Ankerst et al., 1999; Ware
et al., 2001). Through different data visualization
techniques, the user determines the splits on the data
that will form the conditions of the nodes of the tree
in a recursive manner until the user is satisfied with
the tree’s results. Trees generated using these
platforms achieve similar results as automatically
generated DTs. The main limitation is that the
constructed DT cannot be pruned once it has been
built.
In (S. J. Elzen and J. J. Wijk, 2011), the authors
describe a platform that allows for the construction of
trees from datasets combining manual modification
and automatic methods. The user manually splits the
data based on statistical parameters and visual
representations of the data. In addition, the user can
automatically grow sub-trees starting from a given
node.
Lastly, there are many studies (Aoki et al., 2007;
Poucke et al., 2016; Ramezankhani et al., 2014;
Tenório et al., 2011) that used platforms that allow for
the automatic generation of DTs as well as for their
visualization. While the platforms used in those
studies can be used by non-expert users to create DTs,
test and visualize them, they are not able to cope with
the lack of adaptability to changes in the tree. For this
reason, the user´s knowledge cannot be introduced
into the models.
Overall, some interactive platforms (Ankerst et
al., 1999; Kamiński et al., 2018; Ware et al., 2001)
build DTs to support decision-making with the help
of dataset visualization methods. These platforms are
able to modify the DTs as the expert requires, but they
do not use automatic ML methods to serve as a good
starting point for the user. Doing so would allow for
the conditioning of the entire tree. Other experts such
as (Aoki et al., 2007; Poucke et al., 2016;
Ramezankhani et al., 2014; Tenório et al., 2011),
provide the possibility of extracting the tree using ML
methods, however, doing so does not allow for the
editing of those DTs. Given this scenario, if any
branch is non-compliant with the expert´s knowledge,
the expert is unable to fix the issue within the domain.
A platform that successfully combines both
approaches is the one presented in (S. J. Elzen and J.
J. Wijk, 2011) (“BaobabView: Interactive
construction and analysis of decision trees - IEEE
Conference Publication,” n.d.). This publication
outlines a very good DT generator but cannot be used
to evaluate single instances of data or generate trees
without a dataset as our platform does (for
formalization purposes). Aside from using a
combined approach when generating the model, our
platform allows the user to check the performance of
the model in new frames as well as provide tools in
order to easily analyze the DT (e.g. change the color
of the tree depending on the outcome). In addition,
the DT is immediately ready-to-use upon
incorporating new patients´ data as soon as it is built.
3 KNOWLEDGE GENERATION
TOOL (KGT)
In this chapter, the modules of our adaptative web-
based CDSS, named Knowledge Generation Tool
(KGT) are described. KGT consists of three principal
modules:
1. Automatic DT building module. Users are able to
use five well-known ML methods to build DTs
classifiers in a selected data frame (Section 3.2).
2. A web-based Authoring Tool (AT) that allows (i)
building a DT right from the start and (ii)
modifying the already built DT models using a
visual representation of the model (Section 3.3).
3. A DT testing module to test any DT building
method, being able to assess which one generalizes
the best. It also allows the user to test any buildt
DT, making possible to check if the changes made
in the DT improve the quality of the model
(Section 3.4).
This way, as users are involved in the construction of
the model, their understanding of it is deeper, while
the model’s performance can be improved thanks to
the clinicians’ knowledge (Kwon et al., 2019). Out of
the mentioned modules, firstly, Section 3.1
introduces the format that the other modules of the
KGT follow in order to handle the DTs.
Adaptative Clinical Decision Support System using Machine Learning and Authoring Tools
97

3.1 Dynamic Tree Format (DTF)
The combination of creation, edition and
visualization of the tree is the core piece of our work.
The visualization is based on the “Horizontal Tree”
component of the Angular PrimeNG library
(“PrimeNG,” n.d.), used to display hierarchical data.
This component is extended with several new
properties adding tags to each node of the DT,
enabling the handling of the DT on the backend. We
tune the format of the component, so that we can
introduce the required information about the model in
each node: (i) the condition(s) that each node
represents, (ii) a unique ID for each node to identify
it, (iii) a relational operator (AND / OR) that compares
the multiple conditions grouped in a node and (iv) the
probabilities of the outcome value at each node. We
call this tuned component Dynamic Tree Format
(DTF).
Each condition is represented with (i) the name of
the variable, (ii) the relational operator and (iii) the
value of the condition statement. Depending on the
type of the variable, the allowed relational operators
change. For both Boolean and Categorical variables,
the possible relations are limited to Equal to and
Different Than, whilst for numeric variables, the set
of possible relational operators is extended with
Greater Than, Greater or Equal Than, Smaller Than,
Smaller or Equal Than.
3.2 DT Building
Figure 1: Dashboard of DT building.
There are two ways to create trees in the KGT. The
first one is manually (i.e. using the AT), which is very
useful in order to formalize clinical practice
guidelines. The second way is by automating the
process using medical data in conjunction with
reliable and robust ML methods. When employing
the automated option, many non-contemplated
hidden patterns can be discovered in the patient’s data
that may improve the knowledge-based CDSSs.
Figure 1 displays the user-interface of the KGT used
in the second approach.
When the outcome (e.g. live/dead) is unbalanced
(large difference between the number of instances of
each outcome’s class), the DT models usually tend to
adhere to the most frequent outcome’s class.
Therefore, our KGT gives the possibility to apply the
SMOTE (Chawla et al., 2002) balancing method
before building the DT in order to have a similar
number of instances for each possible outcome’s class.
The software R (Team, 2015) is used to build
these DTs, as it is a very powerful programming
language and properly handles Boolean, Numerical
and Categorical variables when building a DT. Our
development is mainly based on the partykit (Hothorn
and Zeileis, n.d.) package. A parser is built from the
party class (how the tree format is represented in the
partykit package) to the DTF explained in the
previous section. Therefore, all the trees built in R
language are transformed into the party format first,
and then to the DTF to handle it in the KGT. This
way, any package of R that builds DTs from data can
be used to extract DTs applicable in the KGT.
DT generation algorithms recursively split a
dataset until a stop criterion is met. In the literature,
there are many methods to make these splits. We
implemented some of the most frequently used DTs
in medicine in the literature (Podgorelec et al., 2002),
which are listed below.
Generalized Linear Model Trees: It is based on
the Generalized Linear Model (GLM) (Nummi,
2015). It evaluates the GLM parameters and
studies if they are stable along the division
variables considered. Then, it uses the variable
with the highest parameter instability to make the
split. It is implemented with the partykit package
(Hothorn and Zeileis, n.d.).
Ctree: This method uses a significance test to
select the variable to split (Zeileis et al., n.d.). This
approach is also implemented with the package
partykit (Hothorn and Zeileis, n.d.).
CART: It finds the variable to split using a split
measure function which is based on the gini index
(Rutkowski et al., 2014). rpart package (Therneau
et al., 2015) is used to implement it.
C4.5/J48: The way C4.5 (named J48 in WEKA)
method makes the split is that it relies on the
information gain ratio. It chooses the split that
maximizes the gain ratio (Quinlan, 2014). When
this method is selected, the KGT is supported by
the package RWeka (Hornik et al., 2018).
HEALTHINF 2020 - 13th International Conference on Health Informatics
98
C5.0: It is a C4.5 method’s extension, adding new
functions, such as boosting for improving the
accuracy rate and the construction of cost-sensitive
trees. (Pang and Gong, 2009). The package C50
(Kuhn et al., 2018) is used in the KGT.
These five methods can be applied independently or
can be combined to generate a forest of different DTs.
This way, different DT methods knowledge can be
combined to obtain a better model. Moreover, as the
KGT allows to modify these models, the not desired
part of the forest can be modified.
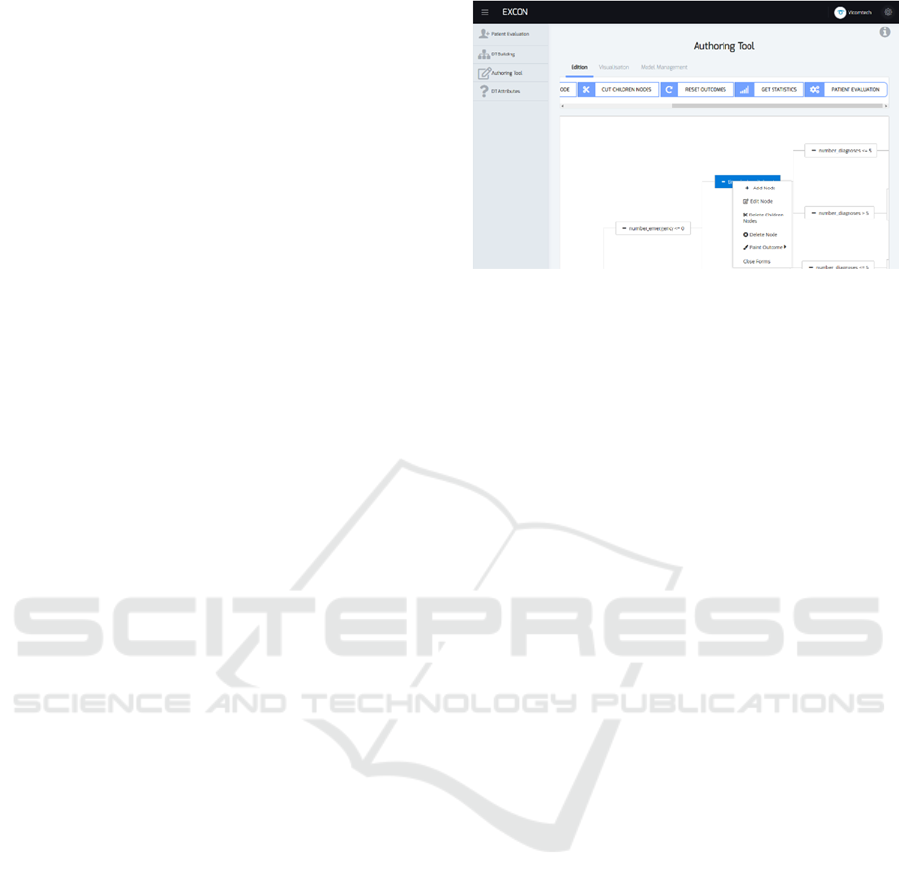
3.3 Authoring Tool
The AT facilitates (i) the modification of existing
trees and (ii) allows for the construction of new trees
from scratch. Below the most important features of
the AT are listed. The AT interface of the KGT is
shown in Figure 2.
1. New Branches: Starting in an already existing
node, it is possible to create a new node (child) to
which the next evaluation step should go if the
specified conditions are met. In the same way that
new nodes can be created, a chosen node or all its
children can be deleted, keeping the selected node
as a leaf node (end of branch).
2. Edit Conditions: The conditions of any node can
be edited, i.e. the value of the checked variable or
the variable itself can be changed.
3. Edit Outcome: The probability distribution of the
outcome (e.g. alive or dead) is given in each node.
These probabilities can be modified with the AT.
4. DT Attributes: When editing the conditions of the
trees, their possible values are restricted (e.g.
categorical variables have restricted values), which
are automatically extracted when the tree is
generated from a data frame. Non-contemplated
attributes or possible values of an attribute can be
added using the AT. When the DT is manually
generated, the attributes must be defined by the user.
The AT provides a way of extending the DTs with
clinical knowledge to cope with particular or
complicated clinical cases not evaluated by the
original model. After using the AT, it is possible that
some patients fulfill more than one path or none. If
more than one path is satisfied all fulfilled paths are
highlighted in the tree. To test the model’s efficiency,
the average of all the outcomes is considered. If none
of the branches are followed, the KGT would return
that the CDSS is not suitable for that patient.
Figure 2: The dashboard of the AT of the KGT model.
Lastly, in order to facilitate the understanding of
the reasoning process of the DT, the nodes of the tree
can be colored according to the probability of each
possible outcome in a node (green tones reflect higher
probabilities, red tones indicate lower probabilities).
This color scheme allows for the visualization of how
the tree classifies the data, making it easier for the
user to identify the most appropriate node to edit.
3.4 DT Testing
The KGT allows the user to analyse the performance
of the DT building methods using 5-fold Cross-
Validation (Arlot and Celisse, 2010). The KGT
returns the precision, recall, f1-score and AUC values
(Hand and Till, 2001) for each possible outcome (e.g.
alive or dead). Therefore, this approach quickly
identifies which DT has the best performance for any
dataset of the KGT.
The tool also enables the possibility of testing a
DT generated from knowledge or the modified DT by
the AT. In order to carry out this testing, the user must
select the dataset in which he/she wants to test the DT,
preferably not with the same dataset that was used to
build the tree in order to avoid overfitting.
The outcome of each branch (its leaves) is
specified as a set of probabilities. As the precision,
recall and f1-score testing values need an absolute
answer (e.g. it lives or dies, not its probability), the
outcome with the highest probability is selected when
estimating these testing values.
In the case of the AUC values, originally it is used
with 2-class outcomes. When there are more than two
outcome classes (e.g. we want to differentiate Heart
Failure, Atrial Fibrillation or Cardiomyopathy), the 1-
vs-all (Hand and Till, 2001) method is used. For each
possible value of the outcome, the other levels are
joined which causes the issue to turn into a 2-class
problem.
Adaptative Clinical Decision Support System using Machine Learning and Authoring Tools
99
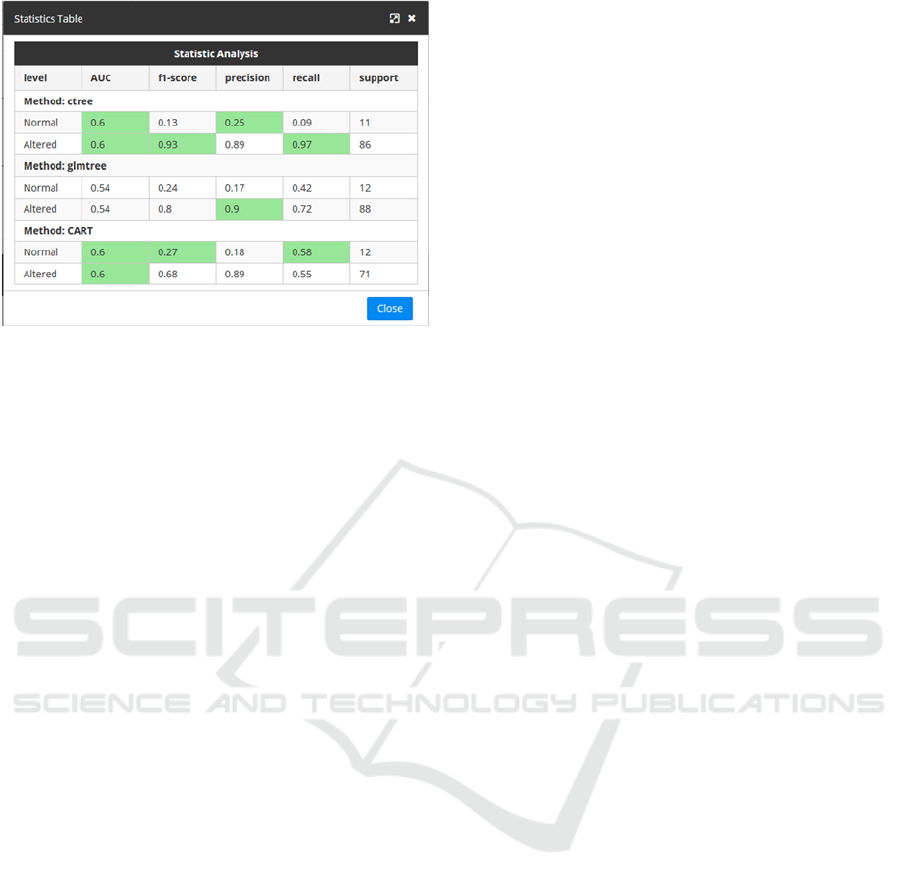
Figure 3: Visualization of testing values.
In order to assist the user to understand the
meaning of the measurements obtained, the table
above highlights the cells with the best statistical
measurements obtained for each possible outcome
when testing the DTs. This way, if the best
measurements are obtained by one specific algorithm,
this will be seen clearly as its corresponding cells will
be highlighted as seen in Figure 3.
4 USE CASE
The KGT has been tested in the public data frame of
readmission of diabetic patients (Strack et al., 2014).
The original data set consists of 47 attributes and
101,766 cases, each of which corresponds to a single
patient diagnosed with diabetes. The variables
describe encounters with diabetics such as diagnoses,
medications, and the number of visits in the year prior
to the encounter. Originally the classification task
was divided into three classes: readmitted within 30
days, after 30 days or not readmitted. In this case, it
has been decided to combine the last two groups in
order to create a dichotomous classification system
and hence, to test if the patients were readmitted
within 30 days or not.
Before building the tree, the original dataset has
been split into training (70%) and testing (30%)
subsets, ensuring that each subset contained the same
proportion of readmitted vs non-readmitted instances
(approx. 1:9).
To demonstrate the functionality of the KGT, the
addition of variables that improve the predictive
capacity of a DT will be shown. For that, three
variables (“admission type”, “number of inpatients”
and “discharge id”) have been set aside before
constructing the initial DT. According to Bhuvan
study (Bhuvan et al., 2016) who have worked on the
same public dataset, these three variables are the most
influent ones when predicting readmission. This way,
it can be shown how clinicians can add new
knowledge in the already developed DTs, taking
advantage of the KGT.
4.1 First DT
The best DT-building method among the five options
in the KGT is ctree (i.e. cross-validation shows that
its performance is the best in the training set, judging
by the obtained testing measurements). For this
reason, it is the selected ML method to build the DT
(shown in Figure 4).
The First DT consists of 30 nodes and uses 7
predictor variables. The benefit of using these
predictor variables is that it provides a feature
selection that reduces the necessity of the extraction
from 44 variables to 7. This methodology achieves an
AUC value of 0.57 in the testing set, which we will
use as a benchmark to measure the loss/gain of
predictivity when simplifying/editing the tree.
Despite obtaining a low predicting capacity
shown by the AUC value, in literature, models that
use this database with all the variables, with the same
data pre-processing as in this study, obtain modest
values (≈0.65), even for more complex classifiers
such as Neural Networks or Random Forest (Bhuvan
et al., 2016).
4.2 Pruned DT
The First DT obtained in the previous section is not
very large, but it is large enough to prevent a correct
interpretation by the user (e.g. clinician) when it can
be simplified without losing much predictability. For
this reason, this tool allows cutting and/or editing
branches.
To seek which splits of the original DT can be
omitted because of their low discriminative capacity,
the nodes of the DT are colored according to the
probability to readmit in each node. This way, poor
splits can be found and deleted using the AT. The size
of the resulting pruned DT is reduced to 10 nodes and
uses only 4 predictor variables (see Figure 5). The
performance of this edited DT has also been tested in
the testing subset, with only a minor decrease from
0.57 to 0.56 in the AUC value (see Table 1). The new
DT is much smaller, easier to follow, and moreover,
it needs only 4 variables, avoiding the extraction of 3
features at the cost of a minor loss of predictability.
HEALTHINF 2020 - 13th International Conference on Health Informatics
100
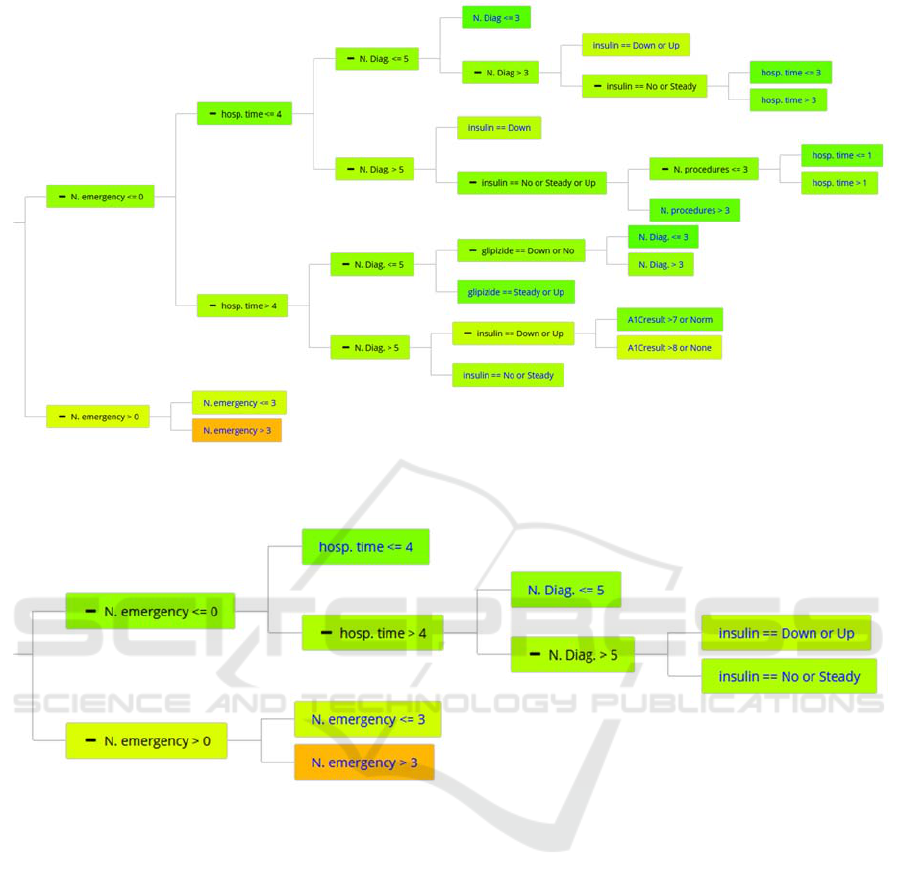
Figure 4: First DT built by the KGT using the ctree method to predict if some diabetic patient will readmit within 30 days.
Node colors depend on the probability of not readmitting within 30 days (red, more probably to readmit, green more likely
than not).
Figure 5: Pruned DT: the remainder DT after the pruning of First DT.
4.3 Extended DT
Before First DT construction we set aside three
variables to simulate new discovery and to add them
to the already developed DT.
The resulting DT from the combination of the
previous knowledge and the new DT is shown in
Figure 6 as Extended DT. It adds complexity to the
previous DT since the new DT has 32 nodes. It can be
seen by the coloring feature that the new variables
discriminate much better than the old ones. Despite
adding relatively little complexity to the model, the
new DT performs better, with an AUC testing value
of 0.64 in the testing set. This new AUC value of 0.64
demonstrates an improvement over the previous
results (see Table 1) and nearly reaches the AUC
values of 0.65 that are achieved in the literature, but
using more complex and less interpretable ML
methods, such as Neural Networks or Random Forest
(Bhuvan et al., 2016).
4.4 KGT’s Contribution
In Table 1 the contribution of the KGT is presented for
the elaboration of the DTs. The First DT has been built
using the ctree method and has 44 variables in the
training set. It achieves an AUC score of 0.57 with a
rather complex tree to follow with 30 nodes and 7
different attributes. With the AT of the KGT, we have
been able to get the Pruned DT simplifying the First DT
to 10 nodes and 4 different attributes at the expense of
only a 0.01 decrease in the AUC value. Finally, in the
pruned DT with the additional variables, in which “new
knowledge” has been added, the accuracy of the DT has
been increased in terms of AUC to 0.64, at a cost of
complexity of 32 nodes and 7 different attributes.
Adaptative Clinical Decision Support System using Machine Learning and Authoring Tools
101
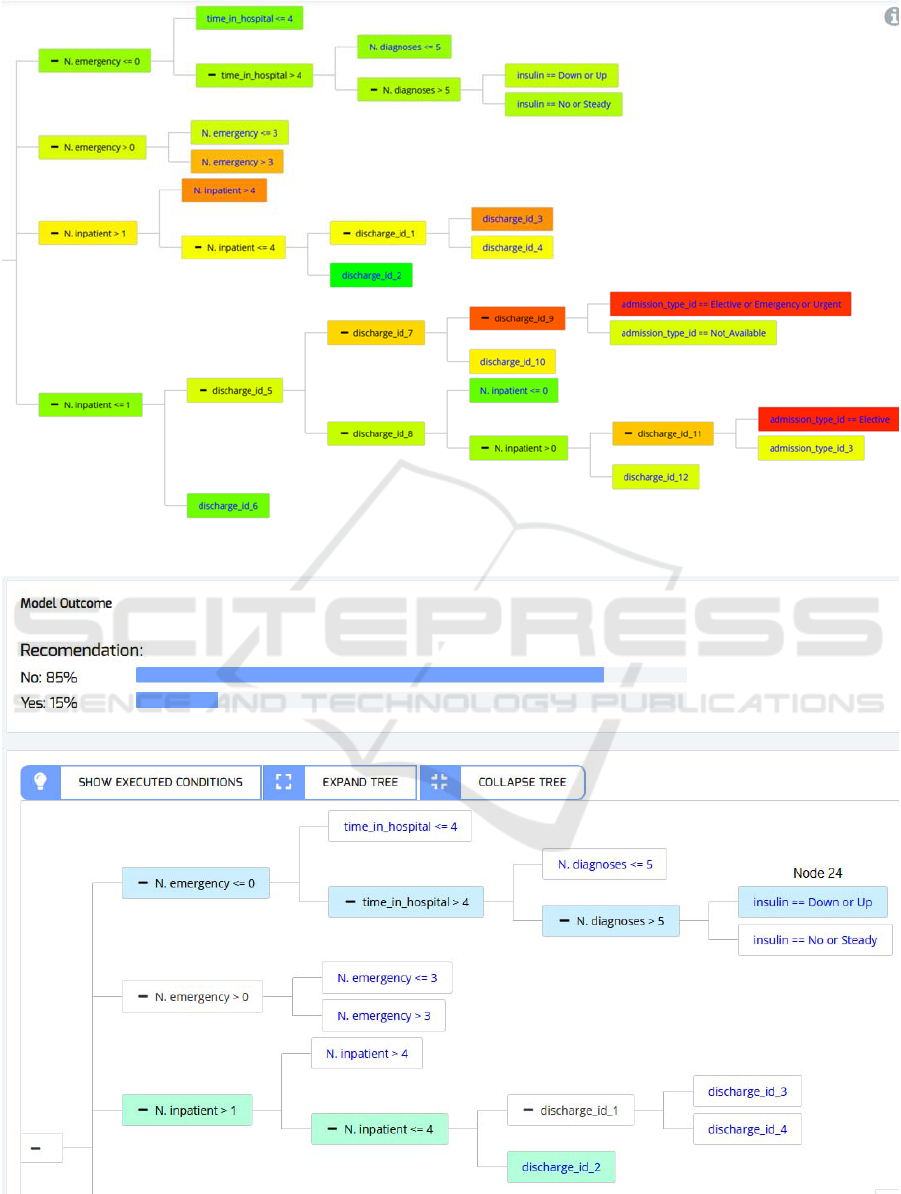
Figure 6: Extended DT: The produced DT after adding the new knowledge to the Pruned DT.
Figure 7: The evaluation of a simulated patient in the KGT, with its probability to readmit and the reasoning of the tree. It is
the same DT that is in Figure 6, but cut in order to show the needed piece we are highlighting.
HEALTHINF 2020 - 13th International Conference on Health Informatics
102

Table 1: The summary of the performance of each of the DT achieved in the KGT. The testing values of the DT in the testing
datasets for each possible oucome (readmitted Yes/No), the number of nodes of the tree and the required number of attributes.
Outcome AUC Precision Recall F1-score N. nodes Variables
First DT
No
0.57 0.92 0.21 0.35
30 7
Yes
0.57 0.12 0.85 0.2
Pruned DT
No
0.56 0.91 0.58 0.71
10 4
Yes
0.56 0.13 0.5 0.2
Extended DT
No
0.64 0.93 0.52 0.67
32 7
Yes
0.64 0.14 0.66 0.23
4.5 Use Scenario
Once the DT is constructed, the KGT enables the user
to apply it with new patients’ data. In Figure 7, it is
shown the probability to readmit the patient with the
features shown in Table 2. Moreover, it can be
appreciated how the KGT illustrates visually the
reasoning process of the DT for this particular patient,
highlighting the nodes of the fulfilled branches.
Table 2: Simulated data of patient evaluated in Figure 7.
Variables Patient value
N. emergency
0
time_in_hospital
7
insulin
Down
N. inpatient
3
discharge_id_2
Urgency
5 CONCLUSIONS
This paper presents an adaptative CDSS based on an
interactive framework, named Knowledge
Generation Tool (KGT). This KGT has been created
for Decision Tree (DT) building and modification,
mainly for its usage in the medical domain. This tool
can allow non-data-analysis experts to mine
databases without the need to know about the insights
of data-mining algorithms. Overall, our platform
equips clinicians with an easy-to-use tool that makes
data mining quick and accessible.
The KGT has two ways to build the DTs: the first
one is from scratch, as the AT enables the user even
to create a DT from the beginning (e.g. to formalize
clinical practice guidelines). The second one is
extracting the DT from a medical dataset, using
Machine Learning (ML) methods. By using the ML
methods, it is possible to discover non-contemplated
patterns by clinicians. As the extracted patterns are
shown in a DT, a comprehensive manner for
clinicians, they can choose whether or not to accept
the extracted information.
In addition, we provide an Authoring Tool in the
KGT that makes the user capable of editing the DT.
This means that the clinical expert can add its clinical
knowledge in the DT.
Moreover, the performance of the DT can be
tested in the KGT. This feature not only allows the
user to check the performance of the DT but to
identify it also allows the user to analyze how positive
the changes made in the DT are. This feature allows
for easy assessment in a situation where the additional
clinical knowledge that the user includes could
potentially improve or worsen the DT´s performance.
This platform is domain-independent, so it can be
used to make predictions or create models in various
domains (even if the domain is not clinical).
To summarize, our platform allows the end-user
to automatically generate DT models using robust
ML methods for it use in CDSS. These models can be
tuned to the user's expert knowledge in a simple and
understandable way.
Regarding future steps, clinical validation of our
platform will be performed. This will consist firstly
of a usability test and secondly of a clinical test with
retrospective data in the context of emergency
triaging for patients with chest pain. By exploiting
retrospective data, a DT model will be used to help
diagnose ischemic heart disease in the emergency
room.
ACKNOWLEDGMENTS
This project has received funding from the Basque
Government’s ELKARTEK 2017 program under
EXCON project, with reference number KK-
2017/00025.
Adaptative Clinical Decision Support System using Machine Learning and Authoring Tools
103

REFERENCES
Alonso, S. G., de la Torre-Díez, I., Hamrioui, S., López-
Coronado, M., Barreno, D. C., Nozaleda, L. M., Franco,
M., 2018. Data Mining Algorithms and Techniques in
Mental Health: A Systematic Review. Journal of
Medical Systems 42. https://doi.org/10.1007/s10916-
018-1018-2
Ankerst, M., Elsen, C., Ester, M., Kriegel, H.-P., 1999.
Visual classification: an interactive approach to
decision tree construction, in: Proceedings of the Fifth
ACM SIGKDD International Conference on
Knowledge Discovery and Data Mining - KDD ’99.
Presented at the the fifth ACM SIGKDD international
conference, ACM Press, San Diego, California, United
States, pp. 392–396. https://doi.org/10.1145/
312129.312298
Aoki, N., Demsar, J., Zupan, B., Mozina, M., Pretto, E. A.,
Oda, J., Tanaka, H., Sugimoto, K., Yoshioka, T., Fukui,
T., 2007. Predictive Model for Estimating Risk of
Crush Syndrome: A Data Mining Approach: The
Journal of Trauma: Injury, Infection, and Critical Care
62, 940–945. https://doi.org/10.1097/01.ta.
0000229795.01720.1e
Arlot, S., Celisse, A., 2010. A survey of cross-validation
procedures for model selection. Statist. Surv. 4, 40–79.
https://doi.org/10.1214/09-SS054
BaobabView: Interactive construction and analysis of
decision trees - IEEE Conference Publication [WWW
Document], n.d. URL https://ieeexplore.ieee.org/
abstract/document/6102453 (accessed 1.10.19).
Bhuvan, M. S., Kumar, A., Zafar, A., Kishore, V., 2016.
Identifying Diabetic Patients with High Risk of
Readmission. arXiv:1602.04257 [cs].
Chawla, N. V., Bowyer, K. W., Hall, L. O., Kegelmeyer,
W.P., 2002. SMOTE: synthetic minority over-sampling
technique. Journal of artificial intelligence research 16,
321–357.
Douali, N., Jaulent, M.-C., 2013. Clinical Practice
Guidelines Formalization for Personalized Medicine.
IJAEC 4, 26–33. https://doi.org/10.4018/jaec.
2013070103
Ericsson, A., Huart, A., Ekefjärd, A., Åström, K., Holst, H.,
Evander, E., Wollmer, P., Edenbrandt, L., 2003.
Automated Interpretation of Ventilation-Perfusion
Lung Scintigrams for the Diagnosis of Pulmonary
Embolism Using Support Vector Machines, in: Bigun,
J., Gustavsson, T. (Eds.), Image Analysis, Lecture
Notes in Computer Science. Springer, Berlin,
Heidelberg, pp. 415–421. https://doi.org/10.1007/3-
540-45103-X_56
Hand, D. J., Till, R. J., 2001. A Simple Generalisation of
the Area Under the ROC Curve for Multiple Class
Classification Problems. Machine Learning 45, 171–
186. https://doi.org/10.1023/A:1010920819831
Hornik, K., Buchta, C., Hothorn, T., Karatzoglou, A.,
Meyer, D., Zeileis, A., Hornik, M.K., 2018. Package
‘RWeka.’
Hothorn, T., Zeileis, A., n.d. partykit: A Modular Toolkit
for Recursive Partytioning in R 5.
Isern, D., Moreno, A., 2008. Computer-based execution of
clinical guidelines: A review. International Journal of
Medical Informatics 77, 787–808. https://doi.org/10.
1016/j.ijmedinf.2008.05.010
Kamiński, B., Jakubczyk, M., Szufel, P., 2018. A
framework for sensitivity analysis of decision trees.
Central European Journal of Operations Research 26,
135–159. https://doi.org/10.1007/s10100-017-0479-6
Kaushal, R., Shojania, K. G., Bates, D. W., 2003. Effects of
Computerized Physician Order Entry and Clinical
Decision Support Systems on Medication Safety: A
Systematic Review. Arch Intern Med 163, 1409–1416.
https://doi.org/10.1001/archinte.163.12.1409
Kerexeta, J., Artetxe, A., Escolar, V., Lozano, A., Larburu,
N., 2018. Predicting 30-day Readmission in Heart
Failure Using Machine Learning Techniques, in:
HEALTHINF. Presented at the Healthinf.
Kuhn, M., Weston, S., Culp, M., Coulter, N., Quinlan, R.,
2018. Package ‘C50.’
Kumar, A., Sarkar, B. K., 2018. A Hybrid Predictive Model
Integrating C4.5 and Decision Table Classifiers for
Medical Data Sets. JITR 11, 150–167.
https://doi.org/10.4018/JITR.2018040109
Kwon, J. Y., Karim, M. E., Topaz, M., Currie, L. M., 2019.
Nurses “Seeing Forest for the Trees” in the Age of
Machine Learning: Using Nursing Knowledge to
Improve Relevance and Performance. Comput Inform
Nurs 37, 203–212. https://doi.org/10.1097/CIN.
0000000000000508
Lakshmi, K., Ahmed, D. I., Kumar, G. S., 2018. A Smart
Clinical Decision Support System to Predict diabetes
Disease Using Classification Techniques.
Larburu, N., Artetxe, A., Escolar, V., Lozano, A., Kerexeta,
J., 2018. Artificial Intelligence to Prevent Mobile Heart
Failure Patients Decompensation in Real Time:
Monitoring-Based Predictive Model [WWW
Document]. Mobile Information Systems.
https://doi.org/10.1155/2018/1546210
Nummi, T., 2015. Generalised Linear Models for
Categorical and Continuous Limited Dependent
Variables. International Statistical Review 83, 337–
337. https://doi.org/10.1111/insr.12111_0
Pang, S., Gong, J., 2009. C5.0 Classification Algorithm and
Application on Individual Credit Evaluation of Banks.
Systems Engineering - Theory & Practice 29, 94–104.
https://doi.org/10.1016/S1874-8651(10)60092-0
Podgorelec, V., Kokol, P., Stiglic, B., Rozman, I., 2002.
Decision Trees: An Overview and Their Use in
Medicine. Journal of Medical Systems 26, 445–463.
https://doi.org/10.1023/A:1016409317640
Poucke, S. V., Zhang, Z., Schmitz, M., Vukicevic, M.,
Laenen, M. V., Celi, L. A., Deyne, C. D., 2016. Scalable
Predictive Analysis in Critically Ill Patients Using a
Visual Open Data Analysis Platform. PLOS ONE 11,
e0145791. https://doi.org/10.1371/journal.pone.0145791
PrimeNG [WWW Document], n.d. URL
https://www.primefaces.org/primeng/#/tree (accessed
12.20.18).
Quinlan, J. R., 2014. C4.5: Programs for Machine Learning.
Elsevier.
HEALTHINF 2020 - 13th International Conference on Health Informatics
104

Ramezankhani, A., Pournik, O., Shahrabi, J., Khalili, D.,
Azizi, F., Hadaegh, F., 2014. Applying decision tree for
identification of a low risk population for type 2
diabetes. Tehran Lipid and Glucose Study. Diabetes
Research and Clinical Practice 105, 391–398.
https://doi.org/10.1016/j.diabres.2014.07.003
Rutkowski, L., Jaworski, M., Pietruczuk, L., Duda, P., 2014.
The CART decision tree for mining data streams.
Information Sciences 266, 1–15. https://doi.org/10.1016/
j.ins.2013.12.060
S. J. Elzen, V. D., J. J. Wijk, V., 2011. BaobabView:
Interactive construction and analysis of decision trees.
Proceedings IEEE Symposium on Visual Analytics
Science and Technology (VAST 2011, Providence, RI,
USA, October 23-28, 2011) 151–160.
https://doi.org/10.1109/VAST.2011.6102453
Safdar, S., Zafar, S., Zafar, N., Khan, N. F., 2018. Machine
learning based decision support systems (DSS) for heart
disease diagnosis: a review. Artificial Intelligence
Review 50, 597–623. https://doi.org/10.1007/s10462-
017-9552-8
Shaikhina, T., Lowe, D., Daga, S., Briggs, D., Higgins, R.,
Khovanova, N., 2019. Decision tree and random forest
models for outcome prediction in antibody
incompatible kidney transplantation. Biomedical
Signal Processing and Control 52, 456–462.
https://doi.org/10.1016/j.bspc.2017.01.012
Sim, I., Gorman, P., Greenes, R. A., Haynes, R. B., Kaplan,
B., Lehmann, H., Tang, P. C., 2001. Clinical Decision
Support Systems for the Practice of Evidence-based
Medicine. Journal of the American Medical Informatics
Association 8, 527–534. https://doi.org/10.1136/jamia.
2001.0080527
Strack, B., DeShazo, J. P., Gennings, C., Olmo, J. L.,
Ventura, S., Cios, K. J., Clore, J. N., 2014. Impact of
HbA1c Measurement on Hospital Readmission Rates:
Analysis of 70,000 Clinical Database Patient Records
[WWW Document]. BioMed Research International.
https://doi.org/10.1155/2014/781670
Tägil, K., Bondouy, M., Chaborel, J., Djaballah, W.,
Franken, P., Grandpierre, S., Hesse, B., Lomsky, M.,
Marie, P., Poisson, T., Edenbrandt, L., 2008. A decision
support system improves the interpretation of
myocardial perfusion imaging. European Journal of
Nuclear Medicine and Molecular Imaging 35, 1602–
1607. https://doi.org/10.1007/s00259-008-0807-0
Team, R. C., 2015. R: A language and environment for
statistical computing.
Tenório, J. M., Hummel, A. D., Cohrs, F. M., Sdepanian,
V. L., Pisa, I. T., de Fátima Marin, H., 2011. Artificial
intelligence techniques applied to the development of a
decision–support system for diagnosing celiac disease.
Int J Med Inform 80, 793–802.
https://doi.org/10.1016/j.ijmedinf.2011.08.001
Therneau, T., Atkinson, B., Ripley, B., 2015. rpart:
Recursive Partitioning and Regression Trees. R
package version 4.1–10.
Vidhushavarshini, S., Sathiyabhama, B., 2017. A
Comparison of Classification Techniques on Thyroid
Detection Using J48 and Naive Bayes Classification
Techniques. SSRN Electronic Journal.
https://doi.org/10.2139/ssrn.3143380
Ware, M., Frank, E., Holmes, G., Hall, M., Witten, I. H.,
2001. Interactive machine learning: letting users build
classifiers. International Journal of Human-Computer
Studies 55, 281–292. https://doi.org/10.1006/ijhc.
2001.0499
Zeileis, A., Hothorn, T., Hornik, K., n.d. party: A
Laboratory for Recursive Partytioning 18.
Adaptative Clinical Decision Support System using Machine Learning and Authoring Tools
105
