
VisualMLTCGA: An Easy-to-Use Web Tool for the Visualization,
Processing and Classification of Clinical and Genomic TCGA Data
Alba Garin-Muga
1,2 a
, Aurora María Sucre
1,2 b
, Jordi Torres
1 c
and Jon Kerexeta
1 d
1
Vicomtech, eHealth and Biomedical Applications Area, Donostia-San Sebastian 20014, Spain
2
Biodonostia, Bioengineering Area, eHealth Group, Donostia-San Sebastián 20014, Spain
Keywords: TCGA, Stratification, ML, Visualization, Clinical Data, Genomics
Abstract: The Cancer Genome Atlas (TCGA) is a collection of freely available data of several human cancer types.
TCGA contains over 2.5 petabytes of data, which includes, among others, clinical and genomic data. However,
the visualization of such data is cumbersome and tiring for non-expert users. VisualMLTCGA is an intuitive
and easy-to-use web tool that allows the automatic download and visualization of TCGA data and the
processing of genomic data using GATK. Additionally, the tool allows to create comprehensive decision trees
(DT) for prediction of outcomes from clinical and genomic TCGA data and other external datasets.
VisualMLTCGA offers a simple web tool to download, process and visualize TCGA data, suitable for
researchers and clinicians without any bioinformatics background.
1 INTRODUCTION
The Cancer Genome Atlas (TCGA) is a collaborative
project (http://cancergenome.nih.gov) that has
molecularly characterized over 20,000 primary
cancer and matched normal samples among 33 cancer
types. It is a joint initiative between the National
Cancer Institute and the National Human Genome
Research Institute born in 2006 that joined together
researchers from several fields of study from all over
the world.
The TCGA contains over 2.5 petabytes of
genomic, epigenomic, transcriptomic and proteomic
data. All this information can be accessed for anyone
to use, although some of the raw files require to apply
for consent. There are 33 types of cancer to study
chosen based on their poor prognosis, public health
impact and availability of samples meeting certain
standards (patient consent, quality and quantity,
among other criteria). Due to all the reasons, TCGA
is an excellent source of data for exploring clinical or
genomic information and characterizing relevant
genes or variations on disease.
a
https://orcid.org/0000-0002-7160-1191
b
https://orcid.org/0000-0002-4078-9275
c
https://orcid.org/0000-0003-4818-7620
d
https://orcid.org/0000-0002-6516-8619
Machine learning (ML) provides methods,
techniques and tools to solve diagnostic and
prognostic problems in healthcare. ML is widely
implemented to learn from input data and extract
relevant findings from health information. The
knowledge obtained from the ML algorithms can be
then represented in a decision tree. Decision trees are
tools for graphical decision analysis, that help
identify the conditional statements visually. In this
flowchart-like structure, each internal node represents
a condition (a test on a variable), each leaf node
represents the outcome and the branches from root to
leaf represent classification rules.
The information within reach in the TCGA can be
downloaded manually from the Genomic Data
Commons Data Portal (‘GDC’, n.d.) and analysed
using advanced data analysis tools such as R (R Core
Team, n.d.) or Python (Python Software Foundation,
n.d.). However, in order to perform ML on all the
data, they require programming skills and it can be
challenging for non-expert users.
Here, we present VisualMLTCGA, an easy-to-use
web tool for downloading, pre-processing,
visualization, processing and analysis of TCGA.
Garin-Muga, A., Sucre, A., Torres, J. and Kerexeta, J.
VisualMLTCGA: An Easy-to-Use Web Tool for the Visualization, Processing and Classification of Clinical and Genomic TCGA Data.
DOI: 10.5220/0008951804130420
In Proceedings of the 13th International Joint Conference on Biomedical Engineering Systems and Technologies (BIOSTEC 2020) - Volume 5: HEALTHINF, pages 413-420
ISBN: 978-989-758-398-8; ISSN: 2184-4305
Copyright
c
2022 by SCITEPRESS – Science and Technology Publications, Lda. All rights reserved
413

Additionally, external data can also be uploaded and
analysed. Users can pre-process clinical and genomic
data, call variants from genomic raw data using
GATK pipelines and extract the relevant features
using decision trees created from clinical and
genomic datasets for classification purposes. This
tool is suitable for researchers and clinicians without
any bioinformatics background.
2 RELATED WORK
Due to large amount of data ready for use in the
TCGA, there are several available tools that have
been developed to support data access and
visualization. Many of them are based on R, one of
the most popular programming languages among
bioinformaticians. TCGAbiolinks (Colaprico et al.,
2016), TCGA Assembler (Zhu, Qiu, & Ji, 2014) and
RTCGA Toolbox (Samur, 2014) are three of them,
being TCGAbiolinks the most versatile. However,
they do not include a graphical interface, which may
hamper their usability for non-experts. For this
reason, many webs that allow to explore TCGA data
have proliferated. In Zhang et al. (Zhang et al., 2018),
web-based tools for TCGA variant analysis are
surveyed. It includes a detailed list of main resources
divided into three main categories: global analysis,
target analysis and auxiliary analysis. However, many
of them analyse only genomic information. Web-
TCGA (Deng, Brägelmann, Schultze, & Perner,
2016) allows the molecular profiling of available
tumours performed in a web environment. However,
it does not allow to perform machine learning
analysis to data.
To our knowledge, there is no available tool to
download, pre-process, analyse, create decision trees
and evaluate patients based on TCGA clinical and
genomic data. Additionally, there are not any
available tools to create decision trees from clinical
and genomic data and classify patients based on this
models, desired features when formulating the TCGA
analysis solution presented in this paper. Therefore,
there is an acceptable niche to develop this solution
in the field of cancer research tools.
3 VisualMLTCGA
For the implementation of VisualMLTCGA, the
Angular IO (‘Angular’, n.d.) web application
framework was chosen due to its robust components
that allow developers write readable, maintainable
and easy-to-use code. Regarding the user interface,
PrimeNG (‘PrimeNG’, n.d.) and ngx-admin
(Akveo/ngx-admin, 2016/2019) have been used.
PrimeNG is a set of rich UI components for Angular
and Ngx-admin is a frontend application template that
includes Bootstrap and TypeScript, among others.
For the backend, Python and R were used due to their
advantages in data processing and TCGAbiolinks (the
previously mentioned R package) was used to
automatically download and access TCGA data.
VisualMLTCGA solution has five main features:
(1) load TCGA data, (2) load clinical data, (3) load
genomic data, (4) build ML model and (5) classify
patient.
In the following subsections, each feature is
explained in detail.
Load Tcga Data
Using this functionality, users can explore the TCGA
projects along with the available data categories and
the file and case count. Once they choose one project,
they can download the clinical or genomic (simple
nucleotide variation) data (Figure 1). The download
and visualization of other types of data will be
developed in the immediate future.
When clinical data is downloaded, the raw data is
saved in the server. However, in order to create a
reliable dataset for machine learning and the
subsequent visualization, the data is cleaned. The
clinical data usually contains a high number of
variables but in many cases, they are not complete.
Therefore, they usually require prior pre-processing
in order to prepare the data for analysis. The filtering
of clinical data is done transparently to the user. The
cleaning processing discards the following
information:
▪ Variables that have more than 10% of null or
erroneous values,
▪ Patients that contain less than 50% of the
variables.
In addition, all the clinical data that exist for the
same patient is combined: demographic, diagnosis,
treatment, drug, radiation, etc. The filtering of clinical
data is done transparently to the user. Additionally,
for better visualization, only few features are
displayed (Figure 2). Users can now select to save the
pre-process data using the floppy disk icon or to
create a decision tree using the brain icon.
TCGA includes raw and processed genomic data
files, however raw sequencing files are not available
for public download. Mutation Annotation Format
(MAF) files are the only open access files containing
single nucleotide variant data. Therefore, in
HEALTHINF 2020 - 13th International Conference on Health Informatics
414
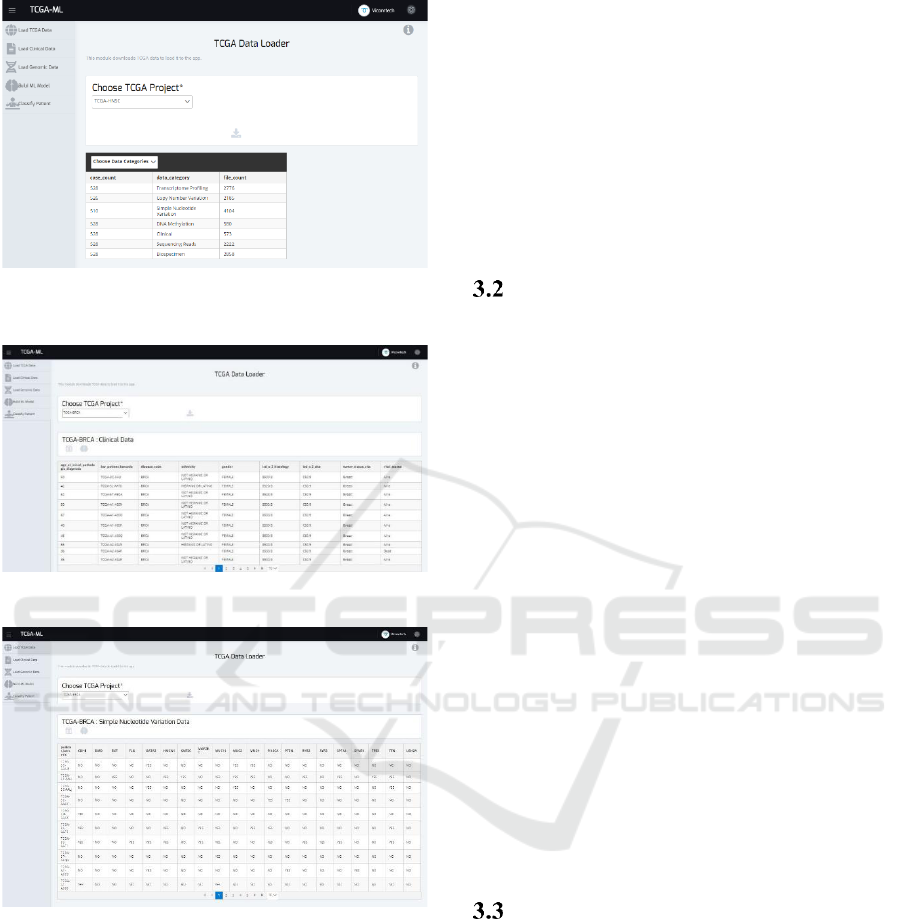
Figure 1: The TCGA Data Loader. All the data categories
available for each project are displayed.
Figure 2: TCGA BRCA Clinical Data Visualization.
Figure 3: TCGA BRCA Genomic Data Visualization.
VisualMLTCGA MAF files can be downloaded.
MAF is a tab-delimited text file with aggregated
mutation information extracted from variant call
format (VCF) files.
Once the user has selected to download the MAF
files from the TCGA project of interest, the tool starts
downloading and pre-processing the files. MAF files
generated following the four existing pipelines are
downloaded: varscan2 (Koboldt et al., 2012), muse
(Fan et al., 2016), somaticsniper (Larson et al., 2012),
mutect2 (Cibulskis et al., 2013). All the information
is combined and cleaned, and the clinical information
of the patients is included. The cleaning process is the
same as the one done to the clinical data. During pre-
processing, the data is prepared for the machine
learning process. To do so, in the case of genomic
data, instead of saving all the mutations associated for
a patient, we only select the 20 most frequent
mutations for the project to be displayed, as shown in
Figure 3. As mentioned before, the user can now select
to save the processed MAF files along with the
clinical information or to use the processed dataset to
create a decision tree.
Load External Clinical Data
Along with the TCGA data, we can load external data
into our tool. Therefore, users can use
VisualMLTCGA to pre-process and visualize any
clinical dataset stored in tabular text files. This
functionality may be of interest for non-expert users
to automatically clean and inspect data easily before
further processing. By way of example, we have
downloaded a public dataset from Kaggle and upload
it to VisualMLTCGA using the uploading icon.
Uploaded datasets can be removed from the server
anytime using the garbage-can icon.
The Kaggle dataset is a liver cancer (HCC,
hepatocellular carcinoma) dataset uploaded by the
University Hospital of Coimbra (Portugal)
9
. It
contains several demographic data, risk factors,
laboratory and overall survival features from 165 real
patients diagnosed with HCC. The dataset contains 49
features selected according to the EASL-EORTC
Clinical Practice Guidelines(‘EASL-EORTC Clinical
Practice Guidelines’, n.d.), which are the current
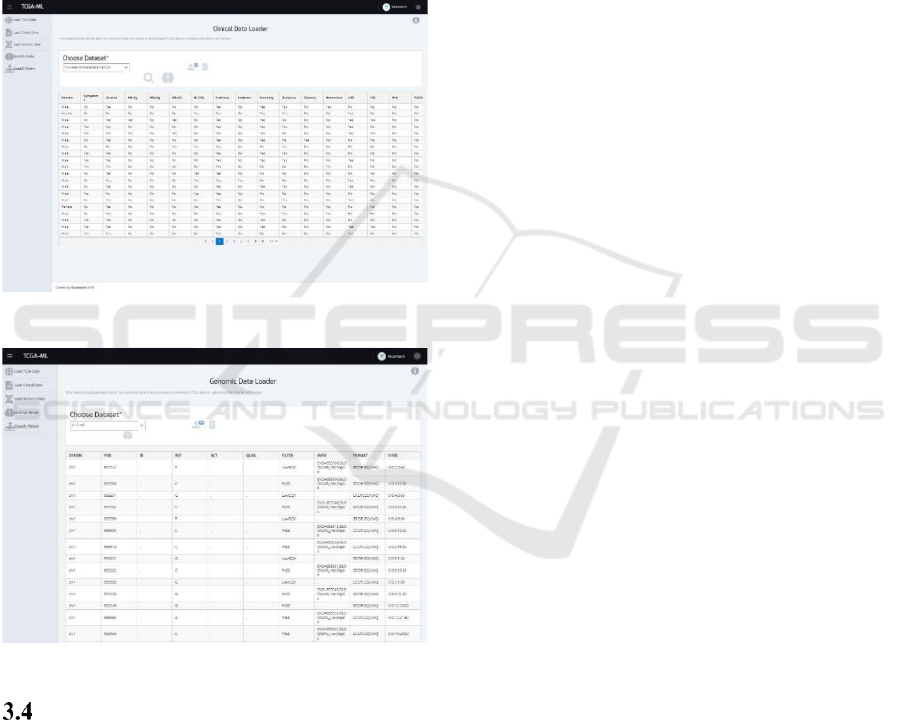
state-of-the-art on the management of HCC. Figure 4
shows the visualization of the dataset. At this point,
the user can create a decision tree using the brain icon
and use the generated model to classify new patients.
Load External Genomic Data
In addition to clinical data, users can load external
genomic data to VisualMLTCGA. They can either
load previously uploaded files or processed MAF
files downloaded from the TCGA, as well as new
files. VisualMLTCGA filters all the genomic files
available in the server to show them in the dropdown
menu. The tool supports raw file formats such as FQ
and processed file formats such as VCF or MAF.
Raw files are processed using the Genome
Analysis Toolkit (GATK) following the Best
Practices for Variant Discovery (‘GATK | BP Doc
#24216 | Pipeline Index’, n.d.). The GATK is a well-
known toolkit developed by the Broad Institute and
VisualMLTCGA: An Easy-to-Use Web Tool for the Visualization, Processing and Classification of Clinical and Genomic TCGA Data
415
its Best Practices provide step-by-step
recommendations for performing variant discovery
analysis (‘GATK | BP Doc #11145 | Germline short
variant discovery (SNPs + Indels)’, n.d.). This
pipeline, after all the processing, returns a VCF file as
output.
Whether the user loads a raw or variant file
(VCF), the tool visualizes the variants in a table
format. An example table is shown in Figure 5. As
explained in the previous subsections, users can
create decision tree from the variant data using the
brain icon.
Figure 4: External clinical data loader.
Figure 5: External genomic data loader.
Build Ml Model
The previously explained features are used to
download or load data to the platform. However, in
order to exploit these data to obtain relevant
information, it can be analysed using machine
learning. For this purpose, we selected decision trees,
a supervised machine earning technique that can be
used for classification. They allow to predict the value
of a target variable based on the input data. The
prediction values are represented in a tree where each
leaf shows the probability of the target variable value
and the number of instances that support it.
For the creation of decision trees, we use the
“Build ML Model” option of the main menu or the
brain icon that is enabled after loading a dataset. In
the case of accessing from the main menu, there is a
dropdown menu to choose from all the datasets
available. The user can select from all the
downloaded datasets from the TCGA or the external
datasets loaded to the VisualMLTCGA. In order to
create the model, users need to select the relevant
variables for the classification and the outcome
variable to predict.
Five classification algorithms were implemented:
1. Generalized Linear Model Trees(Nummi, 2015):
It does a recursive partitioning based on the well-
known Generalized Linear Model (GLM)
method. It uses the variable with the highest
parameter instability to make the split. This
method was implemented in R using the
‘partykit’ package(Hothorn & Zeileis, 2014).
2. Ctree: This method uses a significance test to
select the variable for partitioning(Hothorn,
Hornik, Strobl, & Zeileis, 2019). The R ‘partykit’
package(Hothorn & Zeileis, 2014) was used.
3. CART: A gini index(Rutkowski, Jaworski,
Pietruczuk, & Duda, 2014) based function is
used for the tree partitioning. It was implemented
using the ‘rpart’ package(‘rpart’, n.d.) from R.
4. C4.5/J48: The partitioning is done selecting the
variable that maximizes the information gain
ratio(Salzberg, 1994). The method, named J48 in
WEKA, was implemented using
‘RWeka’(Hornik [aut et al., 2019) R package.
5. C5.0: This is an extension from the previous
method, made by introducing new features such
as boosting for improving the accuracy rate and
the construction of cost-sensitive trees(Quinlan,
1996). The R ‘C50’ package
20(p50)
was used.
In order to select the most appropriate method for
each dataset, the tool assesses the methods based on
evaluation metrics using the “Tree Statistics” option
in the dropdown menu. We can either choose one or
multiple methods to be tested, and the resulting
statistics are displayed. For each method, the AUC,
precision, recall, f-1 score and support are shown.
AUC (area under curve) is a bidimensional
representation of a classifier’s performance.
However, it can represent the performance as a
numerical value, and it is useful to compare
objectively the different methods. Precision is the
ratio of correctly predicted positive observations to
the total predicted positive observations. On the other
hand, recall (also known as sensitivity), is the ratio of
HEALTHINF 2020 - 13th International Conference on Health Informatics
416
correctly predicted positive observations to all the
observations in an actual outcome. The F1 score is the
weighted average of precision and recall. Finally,
support is the number of true instances for each label.
Based on all the information, users can select the most
appropriate algorithm among the five implemented to
generate the decision tree.
Once we select the most suitable algorithm for the
dataset, we can generate the tree. By way of example,
we selected the Brain Lower Grade Glioma (LGG)
project of TCGA. First, we calculated the evaluation
metrics for the five algorithms. CART method has the
highest AUC (0.58) along with glmtree (0.56) and
C4.5/J48 (0.56). Table 1 shows the metrics for CART
method.
Table 1: Evaluation metrics for CART method using the
LGG genomic data.
level
AUC
f1
score
precision
recall
support
Dead
0.57
0.72
0.76
0.68
171
Alive
0.57
0.41
0.36
0.46
68
Therefore, the CART algorithm was used to
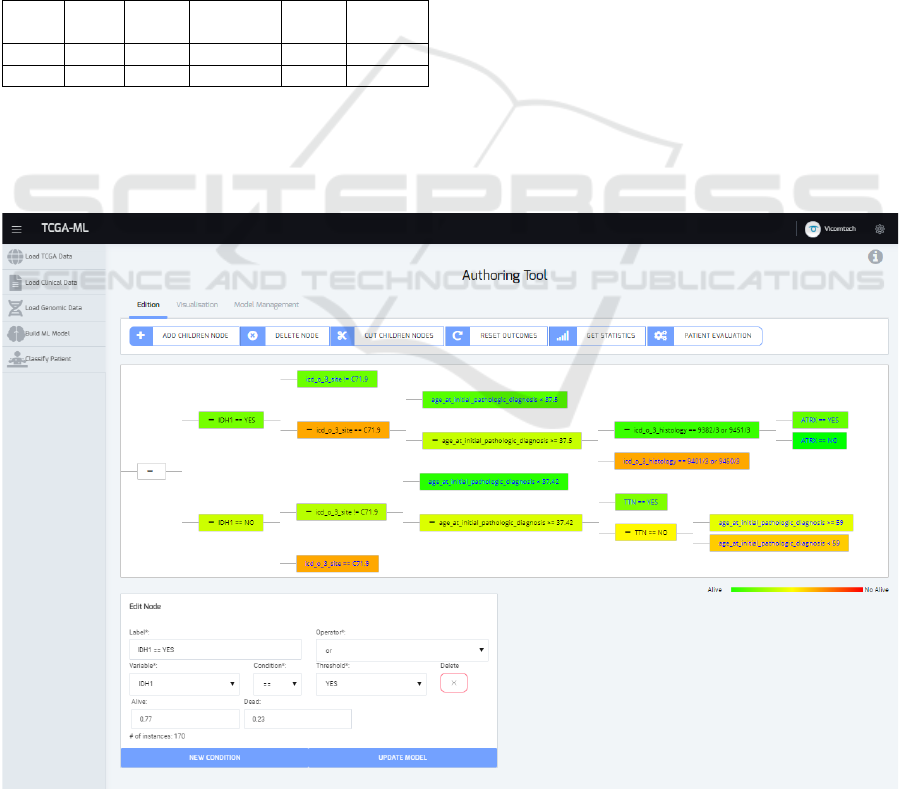
generate the tree. In Figure 6, the generated tree is
shown along with the tree edition tools. The colours
describe the outcome value for each node of the tree,
ranging from green (alive) to red (dead). By clicking
in each node, we can visualize and edit the node
(either partially or completely) and update the model
accordingly. The probability that outcome will
happen based on each condition is shown. The
features shown in the tree are the ones relevant to
predict the outcome. For example, if a patient has
IDH1 mutated, there is a 77% probability for the
patient to remain alive. However, if, in addition to this
feature, the patient’s tumour site is C71.9 (Brain,
NOS), the age of initial diagnosis is more than 37
years and the tumour histology is 9401/3 (anaplastic
astrocytoma) or 9450/3 (oligodendroglioma, NOS),
the probability to remain alive decreases to 33%.
The tree can be easily modified using the tools
provided. This feature is useful for domain experts,
which could improve the automatically generated
classification based on their experience. Users can
create new branches, delete existing ones, edit the
conditions that are evaluated, edit the outcome of the
nodes (the probability of the outcome at a given
node).
Figure 6: The generated tree using the CART method for the LGG genomic TCGA data.
VisualMLTCGA: An Easy-to-Use Web Tool for the Visualization, Processing and Classification of Clinical and Genomic TCGA Data
417
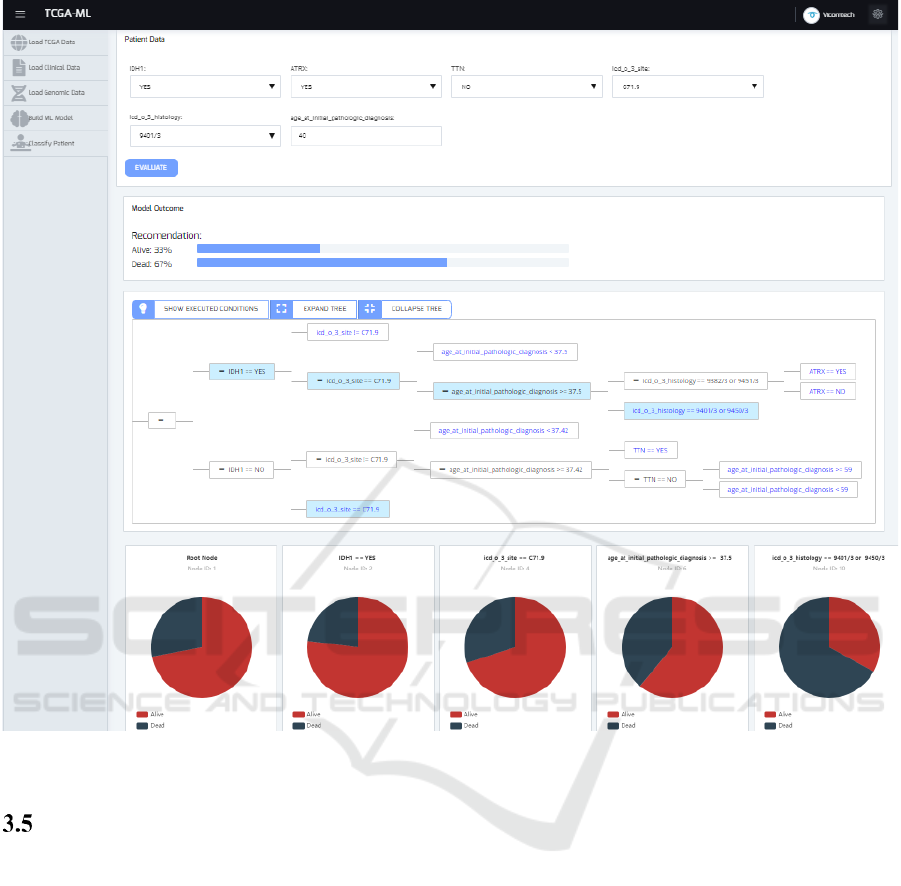
Figure 7: Users can classify patients based on previously created models. In the example, the results for an LGG patient are
shown.
Classify Patient
Once you create the ML model, new patients can be
classified according to the model. Therefore, we can
predict the outcome and classify the new patients
based on the information contained in the ML model.
To do so, users must enter the values of the relevant
variables, which are then considered according to
their pre-defined weight to predict the outcome of
patients based on the model. In our case, we have
selected the survival as outcome. Therefore, the tool
shows the probability of survival of the new patient
according to the model. The generated decision tree
is shown again, but in this case, the fulfilled
conditions are highlighted in blue.
We have used the LGG TCGA model and when
building the ML model, the following features were
selected as relevant to predict to outcome: IDH1,
ATRX and TTN genes, icd_o_3_site,
icd_o_3_histology and age_at_initial_pathologic
diagnosis. We introduced the data from two patients,
the first one with the following features: IDH1 YES,
ATRX YES, TTN NO, icd_o_3_site C71.9,
icd_o_3_histology 9401/3 and
age_at_initial_pathologic_diagnosis 40 (YES
meaning that the gene is mutated). This patient has a
33% probability to remain alive and, as shown in
Figure 7, the user can view the fulfilled conditions in
the tree. However, if the same patient had been at least
three years younger, the probability to remain alive
would be 83% according to the chosen model.
Finally, the pie charts shown in the Figure 7 represent
the probabilities for the outcomes for each of the
nodes executed in the tree for the classified patient.
HEALTHINF 2020 - 13th International Conference on Health Informatics
418

4 CONCLUSIONS
In this paper, we propose VisualMLTCGA, an easy-
to-use web tool for download, pre-processing,
visualization, processing and analysis of TCGA data.
Along with TCGA data, external data can also be
uploaded and analysed. Finally, relevant features can
be extracted from clinical and genomic datasets using
decision trees for classification purposes.
After analysing different TCGA processing and
visualization applications, we did not find any
existing tool that combined downloading, pre-
processing, processing and visualization of clinical
and genomic data, such as the VisualMLTCGA does.
Additionally, VisualMLTCGA includes the creation
of decision trees as a usable feature. Due to all these
reasons, this tool is suitable for researchers and
clinicians without bioinformatics background.
Nevertheless, the tool is currently being validated
and the potential modifications that arise from the
feedback captured on this phase will be the first part
of the future work. Additionally, we will include the
possibility of downloading other type of data from the
TCGA such as Copy Number Variation or DNA
Methylation data. Furthermore, we expect to include
several machine learning algorithms such as Random
Forest, K-Neighbours or SVC.
ACKNOWLEDGEMENTS
This project has received funding from the Regional
Council of Gipuzkoa through the Science,
Technology and Innovation program.
REFERENCES
Akveo/ngx-admin [TypeScript]. (2019). Retrieved from
https://github.com/akveo/ngx-admin (Original work
published 2016)
Angular. (n.d.). Retrieved 7 October 2019, from
https://angular.io/
Cibulskis, K., Lawrence, M. S., Carter, S. L., Sivachenko,
A., Jaffe, D., Sougnez, C., … Getz, G. (2013). Sensitive
detection of somatic point mutations in impure and
heterogeneous cancer samples. Nature Biotechnology,
31(3), 213–219. https://doi.org/10.1038/nbt.2514
Colaprico, A., Silva, T. C., Olsen, C., Garofano, L., Cava,
C., Garolini, D., … Noushmehr, H. (2016).
TCGAbiolinks: An R/Bioconductor package for
integrative analysis of TCGA data. Nucleic Acids
Research, 44(8), e71. https://doi.org/10.1093/
nar/gkv1507
Deng, M., Brägelmann, J., Schultze, J. L., & Perner, S.
(2016). Web-TCGA: An online platform for integrated
analysis of molecular cancer data sets. BMC
Bioinformatics, 17(1), 72. https://doi.org/10.1186/
s12859-016-0917-9
EASL-EORTC Clinical Practice Guidelines: Management
of Hepatocellular Carcinoma. (n.d.). Retrieved 8
October 2019, from EASL-The Home of Hepatology.
website: https://easl.eu/publication/easl-eortc-clinical-
practice-guidelines-management-of-hepatocellular-
carcinoma/
Fan, Y., Xi, L., Hughes, D. S. T., Zhang, J., Zhang, J.,
Futreal, P. A., … Wang, W. (2016). MuSE: Accounting
for tumor heterogeneity using a sample-specific error
model improves sensitivity and specificity in mutation
calling from sequencing data. Genome Biology, 17(1),
178. https://doi.org/10.1186/s13059-016-1029-6
GATK | BP Doc #11145 | Germline short variant discovery
(SNPs + Indels). (n.d.). Retrieved 22 October 2019,
from https://software.broadinstitute.org/gatk/best-
practices/workflow?id=11145
GATK | BP Doc #24216 | Pipeline Index. (n.d.). Retrieved
8 October 2019, from https://software.broadinstitute.
org/gatk/best-practices/
GDC. (n.d.). Retrieved 17 October 2019, from
https://portal.gdc.cancer.gov/
HCC dataset. (n.d.). Retrieved 8 October 2019, from
https://kaggle.com/mrsantos/hcc-dataset
Hornik [aut, K., cre, Buchta, C., Hothorn, T., Karatzoglou,
A., Meyer, D., & Zeileis, A. (2019). RWeka: R/Weka
Interface (Version 0.4-40). Retrieved from
https://CRAN.R-project.org/package=RWeka
Hothorn, T., Hornik, K., Strobl, C., & Zeileis, A. (2019).
party: A Laboratory for Recursive Partytioning
(Version 1.3-3). Retrieved from https://CRAN.R-
project.org/package=party
Hothorn, T., & Zeileis, A. (2014). partykit: A modular
toolkit for recursive partytioning in R (Working Paper
No. 2014–10). Retrieved from Working Papers in
Economics and Statistics website: https://www.
econstor.eu/handle/10419/101073
Koboldt, D. C., Zhang, Q., Larson, D. E., Shen, D.,
McLellan, M. D., Lin, L., … Wilson, R. K. (2012).
VarScan 2: Somatic mutation and copy number
alteration discovery in cancer by exome sequencing.
Genome Research, 22(3), 568–576. https://doi.org/
10.1101/gr.129684.111
Kuhn, M., Weston, S., Culp, M., Coulter, N., code), R. Q.
(Author of imported C., code), R. R. (Copyright holder
of imported C., & code), R. R. P. L. (Copyright holder
of imported C. (2018). C50: C5.0 Decision Trees and
Rule-Based Models (Version 0.1.2). Retrieved from
https://CRAN.R-project.org/package=C50
Larson, D. E., Harris, C. C., Chen, K., Koboldt, D. C.,
Abbott, T. E., Dooling, D. J., … Ding, L. (2012).
SomaticSniper: Identification of somatic point
mutations in whole genome sequencing data.
Bioinformatics, 28(3), 311–317. https://doi.org/
10.1093/bioinformatics/btr665
VisualMLTCGA: An Easy-to-Use Web Tool for the Visualization, Processing and Classification of Clinical and Genomic TCGA Data
419

Nummi, T. (2015). Generalised Linear Models for
Categorical and Continuous Limited Dependent
Variables. International Statistical Review, 83(2), 337–
337. https://doi.org/10.1111/insr.12111_0
PrimeNG. (n.d.). Retrieved 7 October 2019, from
http://primefaces.org/primeng/#/
Python Software Foundation. (n.d.). Python Language
Reference. Retrieved 17 October 2019, from
Python.org website: https://www.python.org/
Quinlan, J. R. (1996). Bagging, Boosting, and C4.5. In
Proceedings of the Thirteenth National Conference on
Artificial Intelligence, 725–730. AAAI Press.
R Core Team. (n.d.). R: The R Project for Statistical
Computing. Retrieved 17 October 2019, from
https://www.r-project.org/
rpart: Recursive Partitioning and Regression Trees version
4.1-15 from CRAN. (n.d.). Retrieved 17 October 2019,
from https://rdrr.io/cran/rpart/
Rutkowski, L., Jaworski, M., Pietruczuk, L., & Duda, P.
(2014). The CART decision tree for mining data
streams. Information Sciences, 266, 1–15.
https://doi.org/10.1016/j.ins.2013.12.060
Salzberg, S. L. (1994). C4.5: Programs for Machine
Learning by J. Ross Quinlan. Morgan Kaufmann
Publishers, Inc., 1993. Machine Learning, 16(3), 235–
240. https://doi.org/10.1007/BF00993309
Samur, M. K. (2014). RTCGAToolbox: A New Tool for
Exporting TCGA Firehose Data. PLOS ONE, 9(9),
e106397.
https://doi.org/10.1371/journal.pone.0106397
Zhang, Z., Li, H., Jiang, S., Li, R., Li, W., Chen, H., & Bo,
X. (2018). A survey and evaluation of Web-based
tools/databases for variant analysis of TCGA data.
Briefings in Bioinformatics. https://doi.org/10.1093/
bib/bby023
Zhu, Y., Qiu, P., & Ji, Y. (2014). TCGA-Assembler: An
Open-Source Pipeline for TCGA Data Downloading,
Assembling, and Processing. Nature Methods, 11(6),
599–600. https://doi.org/10.1038/nmeth.2956
HEALTHINF 2020 - 13th International Conference on Health Informatics
420
