
Location Estimation of an Urban Scene using Computer Vision
Techniques
Paul Gordan, Hanniel Boros and Ion Giosan
Faculty of Automation and Computer Science, Computer Science Department,
Technical University of Cluj-Napoca, Romania
Keywords:
Location Estimation, Computer Vision, Image Processing, Image Segmentation, Feature Detection, Feature
Extraction, Image Matching.
Abstract:
The process of adding the geographical identification data to an image is called geotagging and is important
for a range of applications starting from tourism to law enforcement agencies. The most convenient way of
adding location metadata to an image is GPS geotagging. This article presents an alternative way of adding
the approximate location metadata to an urban scene image by finding similar images in a dataset of geotagged
images. The matching is done by extracting the image features and descriptors and matching them. The dataset
consists in geotagged 360
◦
panoramic images. We explored three methods of matching the images, each one
being an iteration of the previous method. The first method used only feature detection and matching using
AKAZE and FLANN, the second method performed image segmentation to provide a mask for extracting
features and descriptors only from buildings and the third method preprocessed the dataset to obtain better
accuracy. We managed to improve the accuracy of the system by 25%. Following the in-depth analysis of the
results we will present the results as well as future improvements.
1 INTRODUCTION
Many domains deal with images as primary sources of
information with the purpose of processing and inter-
preting them. Scene understanding is a very intrigu-
ing and important problem nowadays.
The research in these fields has also seen a big
growth and together with the technological explosion
of the past years, had lead to the development of many
applications that are based on image and video manip-
ulation.
Self-driving cars, face recognition and augmented
reality rely on computer vision fields such as image
processing and pattern recognition.
The location determination of a visual scene has
a very simple and straightforward methodology. The
process is called GPS geotagging, meaning that the
image (metadata) is associated with the GPS location
of the actor who performed the recording. However,
this is strictly tied to some preconditions: the device
must present GPS functionality which must be en-
abled. It is simple and straightforward however this
simplicity contains its main limitation: if the precon-
dition is not satisfied, the location can not be linked to
the image.
Determining the location of an image without
GPS geotagging requires human resources and it is
very time-consuming. This consists of taking the ac-
tual image for which the location needs to be esti-
mated and comparing it with a set of geotagged im-
ages.
Having a system that estimates the possible loca-
tions of an urban scene image based only on image
content analysis would be a very useful and helpful
application for many (e.g. law enforcement, tourism
applications, augmented reality). Human resources
are still needed to extract the most accurate estima-
tion from the results generated. However, this pro-
cess saves a considerable amount of time compared to
the classical approach, because the most complex and
time-consuming part is performed by the computer.
This paper presents a system for location estima-
tion based on computer vision techniques. Section
two contains some theoretical considerations and re-
lated work. In section three the proposed solution
is detailed. Section four describes the benchmarking
method used for the performance evaluation together
with the most relevant results obtained. Section five
summaries the whole paper drawing the main conclu-
sions.
268
Gordan, P., Boros, H. and Giosan, I.
Location Estimation of an Urban Scene using Computer Vision Techniques.
DOI: 10.5220/0008949102680275
In Proceedings of the 15th International Joint Conference on Computer Vision, Imaging and Computer Graphics Theory and Applications (VISIGRAPP 2020) - Volume 4: VISAPP, pages
268-275
ISBN: 978-989-758-402-2; ISSN: 2184-4321
Copyright
c
2022 by SCITEPRESS – Science and Technology Publications, Lda. All rights reserved
2 RELATED WORK
The computer vision techniques and algorithms
which were researched and used were the following:
image segmentation, feature extraction and feature
matching. These will be detailed in the ensuing sub-
sections.
2.1 Image Segmentation
Image segmentation is the process of labeling each
pixel from an image by assigning it to a class. It
is used in many fields and applications, such as au-
tonomous driving (e.g. pedestrian detection), medi-
cal image processing (e.g. recognizing cancer cells),
content-based image retrieval, machine vision and
recognition tasks (e.g. face detection and recogni-
tion).
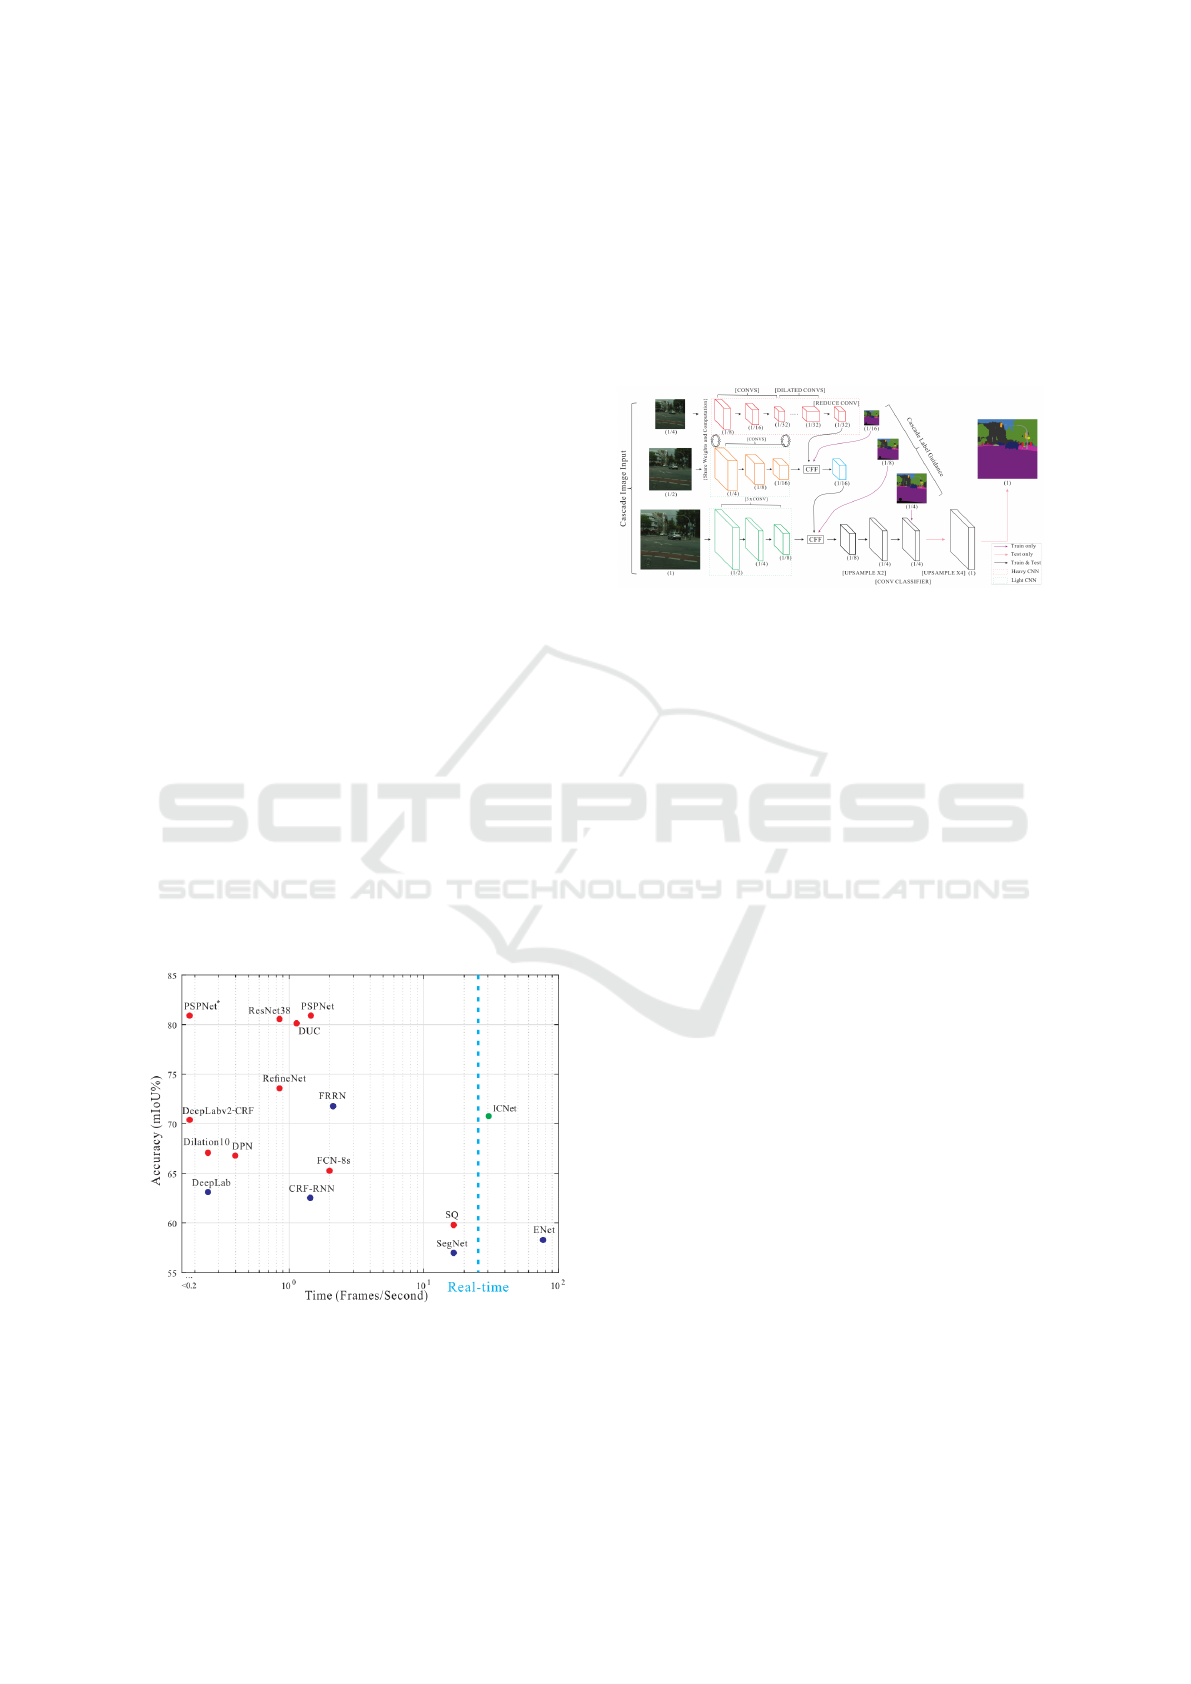
Some state-of-the-art architectures for image seg-
mentation which were researched were: SegNet, PSP-
Net and ICNet. Eventually, the ICNet architecture
was used, because of its speed and accuracy. When
compared to the other previously mentioned segmen-
tation methods, ICNet proved to have good accuracy
without having a major increase in execution time.
This can be seen in figure 1. Another reason to use
ICNet was the fact that it is open source (Zhao, 2019)
and the authors provided a set of pre-trained weights
for the network on various datasets. We used the
weights trained on the Cityscapes dataset, which is
similar to our dataset, both presenting very similar ur-
ban scenes, aspect ratios and resolutions.
Figure 1: ICNet architecture compared to other segmenta-
tion methods (Zhao et al., 2018).
ICNet (Image Cascade Network) is a high-
efficiency segmentation technique. According to
(Zhao et al., 2018), the idea is to let low-resolution
images go through the full semantic perception net-
work first, for a coarse prediction map, then cascade
the output to be used as guidance for medium and
high-resolution features. The main point of the ar-
chitecture is to use a CFF (Cascade Feature Fusion),
in order to take into account the prediction with the
lower resolution. The architecture of ICNet is shown
in figure 2.
Figure 2: ICNet architecture (Zhao et al., 2018).
2.2 Feature Extraction
Feature extraction is the process of extracting specific
points from an image and their corresponding descrip-
tors, called features. This process is very important
because by using the features extracted from an im-
age, one should be able to uniquely identify the im-
age (by comparing the features from one image to the
features from another image). The main algorithms
researched for our system were: Scale-invariant fea-
ture transform (SIFT) and Accelerated KAZE.
2.2.1 Scale-invariant Feature Transform
SIFT (Lowe, 1999) is an algorithm in computer vision
used to detect and describe local features in images.
The algorithm transforms image data into linear scale-
invariant coordinates that are relative to local features.
Those features are invariant to image translation, scal-
ing and rotation and are robust to illumination and
viewpoint changes. The algorithm uses blob detec-
tion to generate a large number of features that cover
the image (Lowe, 1999).
SIFT has proven to be very efficient in object
recognition applications. However its main drawback
is that it requires very large computational power,
leading to a high computational cost.
2.2.2 Accelerated KAZE
AKAZE (Alcantarilla and Solutions, 2011) is another
algorithm (based on KAZE) used for feature detec-
tion and description. AKAZE features are invariant
to scale, rotation and limited affine transformations.
KAZE (Alcantarilla et al., 2012) was created with
Location Estimation of an Urban Scene using Computer Vision Techniques
269

the idea to detect and describe 2D features in non-
linear scale-space extrema to obtain a better localiza-
tion accuracy and distinctiveness. The Gaussian blur-
ring used in other object recognition algorithms (e.g.
SIFT), does not respect the natural boundaries of ob-
jects since image details and noise are smoothed to
the same degree at all scale levels. To make blurring
adaptive to image features, KAZE makes use of non-
linear diffusion filtering alongside the AOS (Additive
Operator Splitting) method. With this filtering, the
image noise is reduced but the object boundaries are
kept (Andersson and Marquez, 2016).
Because the process of solving a series of PDEs
(required by the method of non-linear diffusion filter-
ing) is computationally costly, an accelerated version
of KAZE was created, called Accelerated KAZE or
AKAZE (Alcantarilla and Solutions, 2011). The al-
gorithm works in the same way as KAZE but there are
some differences (Andersson and Marquez, 2016):
• it uses a faster method to create the non-linear
scale-space called the Fast Explicit Diffusion
(FED)
• it uses a binary descriptor (a modified version of
the Local Difference Binary (LDB) descriptor) to
further increase speed
2.3 Feature Matching
Feature matching is the process of finding corre-
sponding points in different images. It is very de-
pendent on the process of feature extraction. If the
features extracted are not as particular to the image
as possible, some features may match even if they do
not represent the same segment or part of an image. It
is important to find a balance between the number of
features extracted, because the time complexity of the
matching grows with the number of features from the
images.
2.3.1 FLANN
FLANN
1
is a library for performing fast approximate
nearest neighbor searches in high dimensional spaces,
containing a collection of algorithms which work best
for nearest neighbor search and a system for automat-
ically choosing the best algorithm and optimum pa-
rameters depending on the dataset (Muja and Lowe,
2009). This library was used in our system.
2.3.2 Matching Techniques
As the authors motivate in (Tareen and Saleem, 2018),
the choice of the feature-detector descriptor is a criti-
1
https://www.cs.ubc.ca/research/flann/
cal decision in feature-matching applications. They
present a comprehensive comparison and analysis
of SIFT, SURF, KAZE, AKAZE, ORB and BRISK,
which are among the fundamental scale, rotation and
affine invariant feature-detectors, each having a desig-
nated feature-descriptor and possessing its advantages
and disadvantages.
The performance of feature detector-descriptors
on matching was evaluated on the following transfor-
mations: scaled versions (5% to 500%), rotated ver-
sions (0 to 360 degrees), viewpoint changes and affine
invariance.
Regarding the accuracy of image matching, SIFT
was found to be the most accurate, overall. AKAZE
and BRISK are the runner-ups.
Authors of (Pusztai and Hajder, 2016) quantita-
tively compared the well-known feature detectors-
descriptors implemented in OpenCV3. Based on their
analysis the most accurate feature extraction algo-
rithm is SURF, which outperforms the other methods
in all test cases. KAZE/AKAZE are the runner-ups,
which are also very accurate.
2.3.3 Lowe’s Ratio Test
Lowe proposed in (Lowe, 1999) to use a distance ratio
test to eliminate false matches.
The author explains that the best candidate match
for each keypoint is found by identifying its nearest
neighbor in the database of keypoints from training
images. It is possible that some features from an im-
age will not have any correct match in the training
database, leading to invalid or incorrect matches. This
could happen when they come from background clut-
ter or were not detected in the training images.
An effective measure is obtained by comparing
the distance of the closest neighbor to that of the
second-closest neighbor (Lowe, 1999). This mea-
sure achieves reliable matching because the correct
matches should have the closest neighbor much closer
than the closest incorrect match.
Eventually, matches in which the distance ratio is
greater than 0.7-0.8 are rejected, leading to an elimi-
nation of 90% of the false matches while discarding
less than 5% of the correct matches for the dataset
presented (Lowe, 1999).
3 PROPOSED SOLUTION
3.1 Overview
We used 360
◦
panorama images from Google Street
View
TM
to create a dataset. The dataset and the user-
VISAPP 2020 - 15th International Conference on Computer Vision Theory and Applications
270
submitted images are semantically segmented. After
the segmentation, the features of the part of the im-
age that contains buildings are extracted and matched
with the features of the panorama images to find the
best matches. This system is called Location Estima-
tion System (LES).
Segmentation was necessary to improve the fea-
ture extraction process. It was noticed that many fea-
ture points were extracted in parts of the image con-
taining vegetation (trees and bushes). As these points
are not a local characteristic of an image urban scene,
they represented a false match. We’ve chosen to ex-
tract features only from the parts of the image labeled
as buildings, because the building features are, gener-
ally, particular to one location.
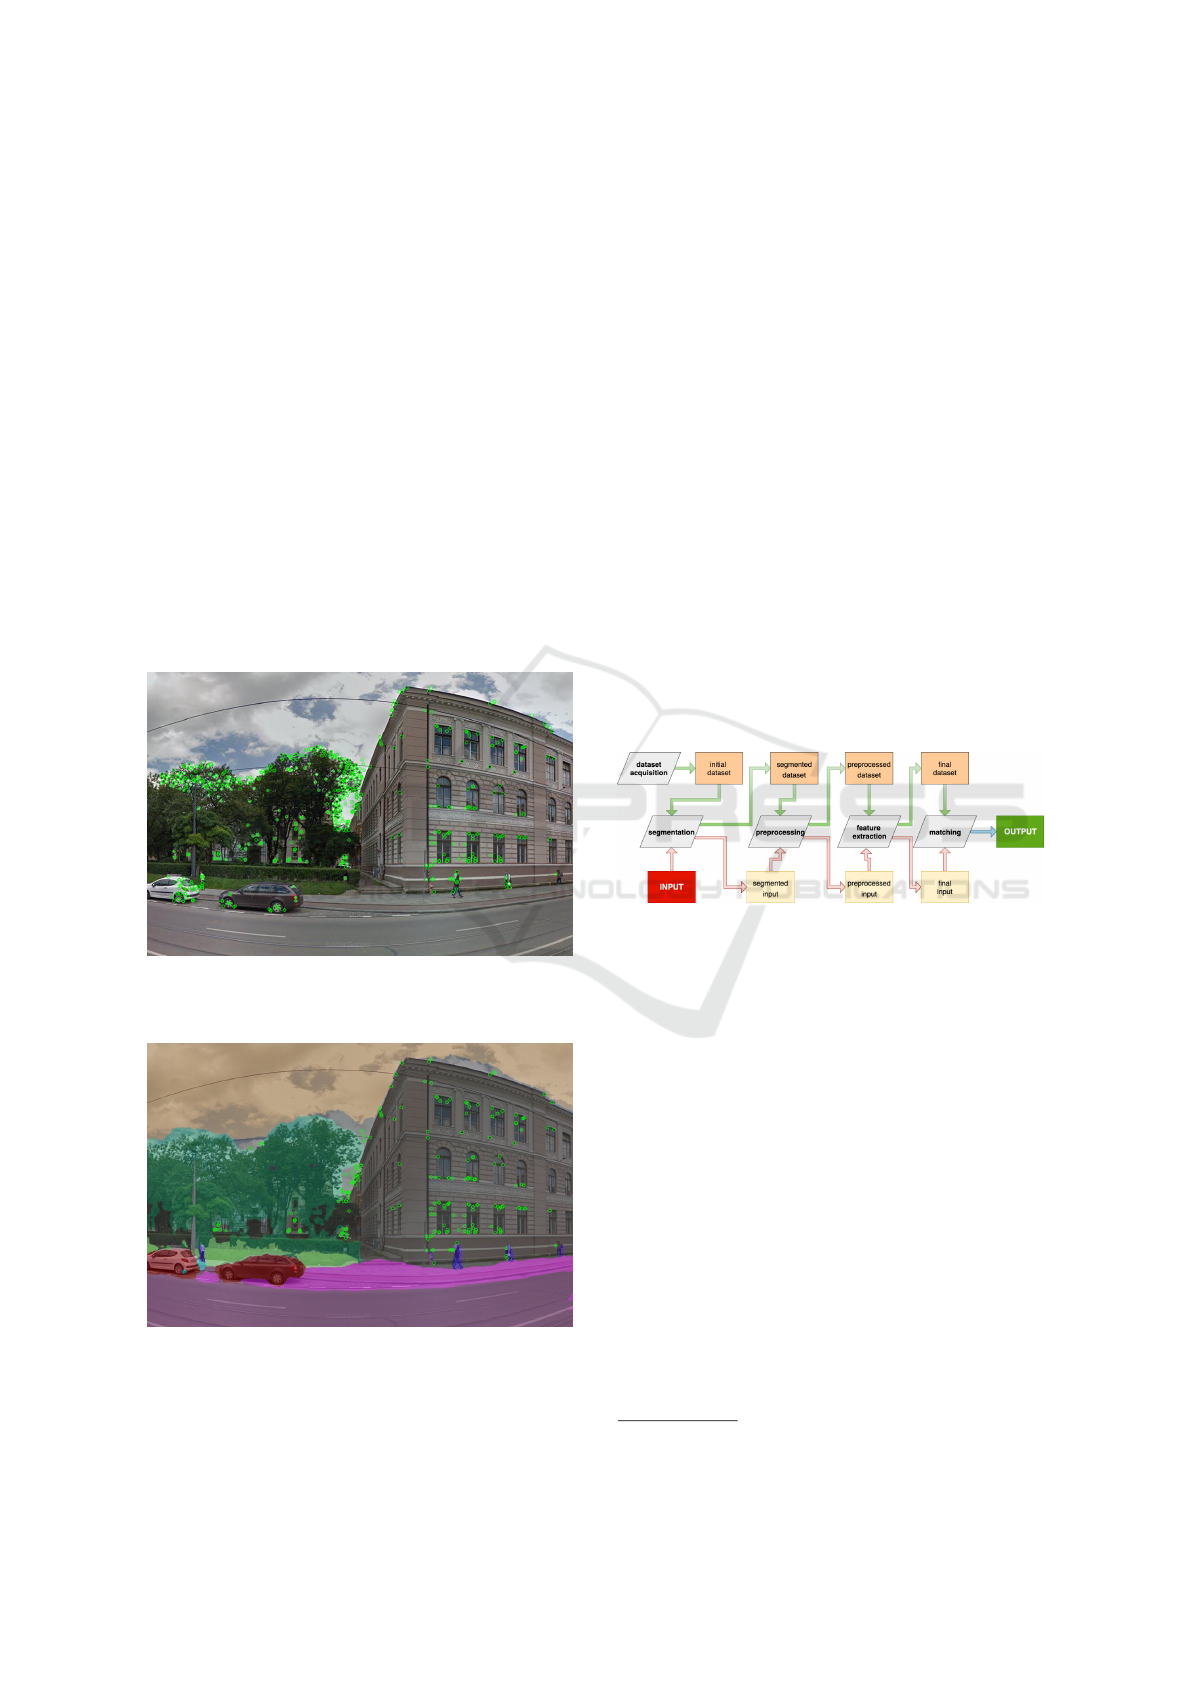
Figure 3a shows the feature points extracted from
the entire image (no segmentation), while figure 3b
shows the feature points extracted only on parts of the
image labeled as building (as the result of segmenta-
tion).
Figure 3a: Extracted feature points from an image with veg-
etation.
Figure 3b: Extracted feature points from a segmented image
with vegetation.
3.2 System Logic and Functional
Structure
The proposed system has two main, separate parts (or
processes): the dataset process and the query photo
process. They are in a hierarchical order relative to
each other, as the query photo process relies on the
results of the dataset process.
The dataset process consists of the acquisition
(downloading the panorama images), preprocessing
(removing panoramas that do not contain buildings),
processing (extracting features and descriptors) and
persistence (saving the features and descriptors) of the
dataset panorama images on the storage system. The
query photo process represents the system main func-
tionality: query photo submission, preprocessing (ac-
cepting the image if it contains buildings), processing
(extracting features and descriptors) and performing
matching with the persisted results of the dataset pro-
cessed. Based on the matching results, location esti-
mation is performed. Figure 4 illustrates the pipeline
of operations that are applied for the dataset images
and a query image.
Figure 4: Dataset and query photo processes (pipelines).
Both the dataset panoramas and the query photos
were segmented by using ICNet. The neural network
segmented the image in 19 classes but we used only
the class labeled as building. The segmented image
can be seen in figure 5.
Feature extraction was performed using the
AKAZE detector-descriptor algorithm, which is in-
variant to scale, rotation and limited distortion. Fig-
ure 6 shows the output of feature extraction on a seg-
mented image.
The extracted features were matched with the fea-
tures of the panorama images to find the best matches,
by using FLANN
2
library. This contains a collec-
tion of algorithms optimized for fast nearest neighbor
search in large datasets. The matching process can be
seen in figure 7.
We scored each panorama based on the number
of correct matches with the query photo. The top
5 panoramas, in descending order by their matching
score, represent the system output.
2
https://www.cs.ubc.ca/research/flann/
Location Estimation of an Urban Scene using Computer Vision Techniques
271
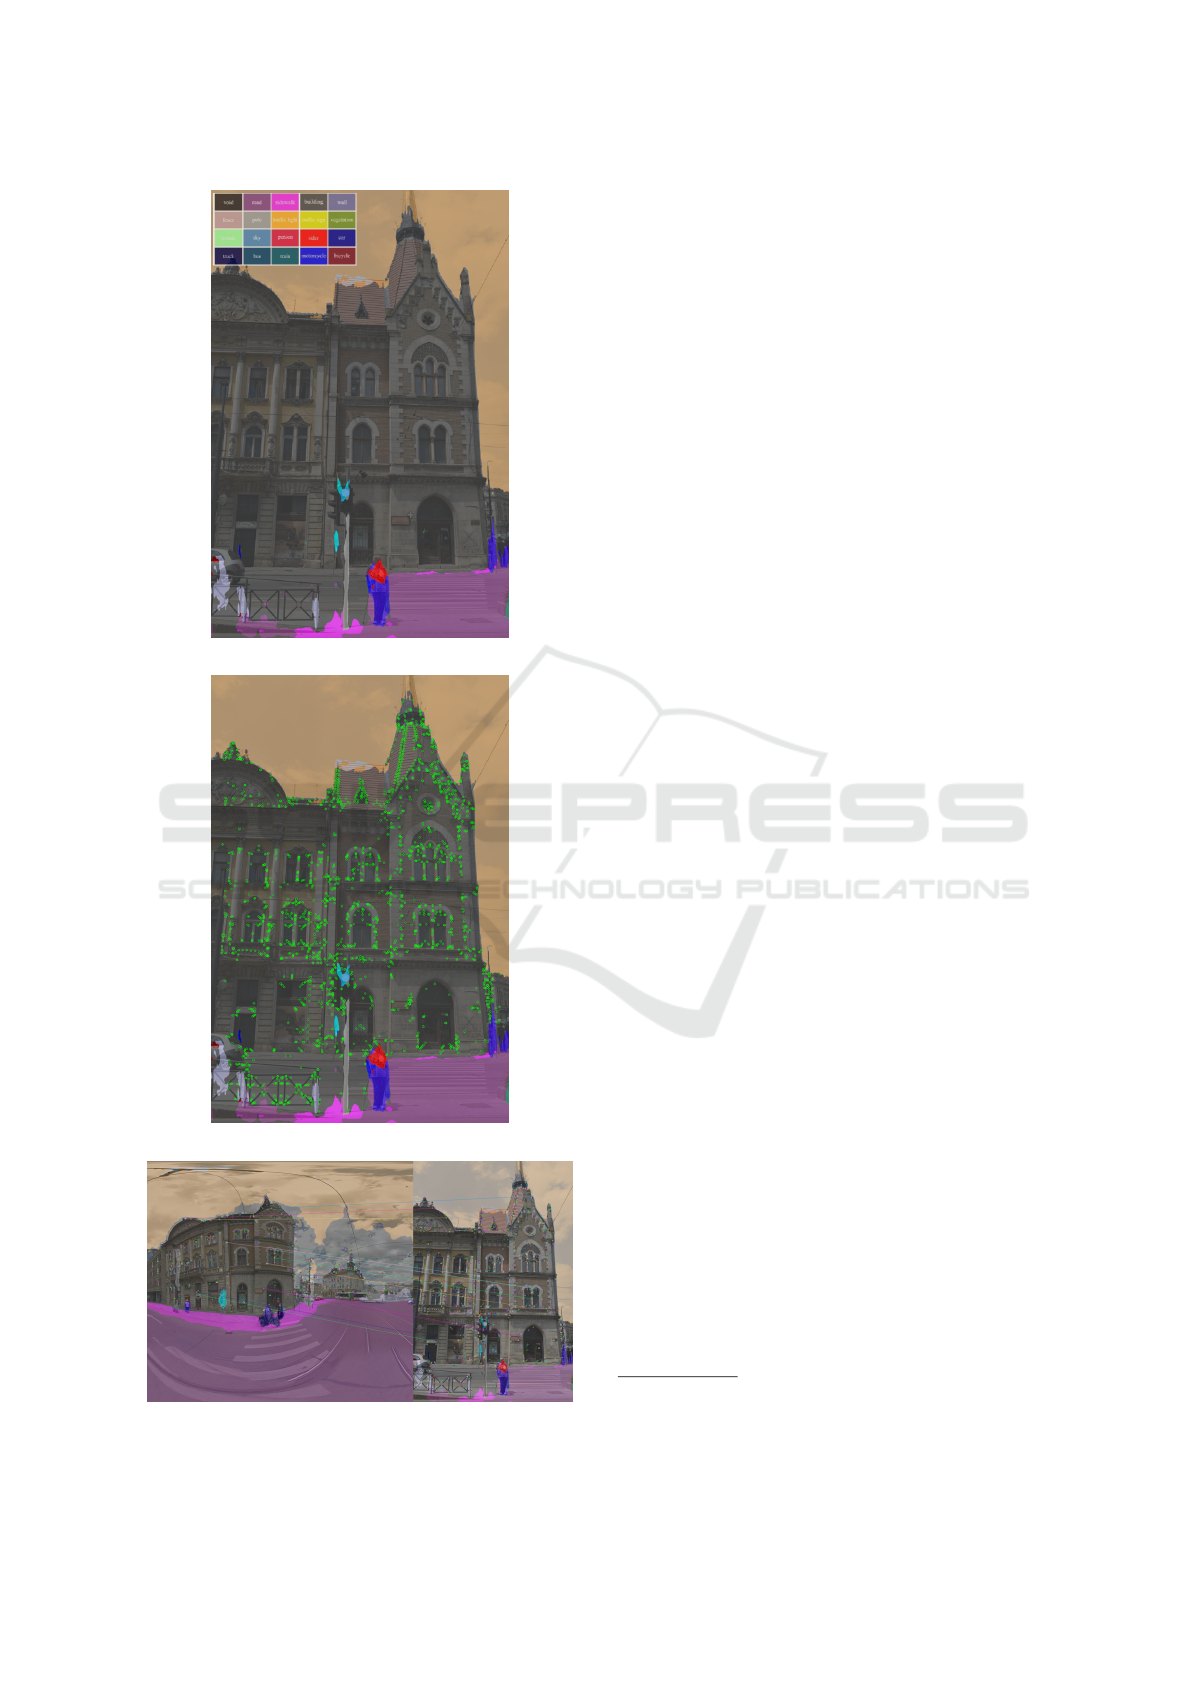
Figure 5: Segmented image with legend for each pixel.
Figure 6: Segmented image with AKAZE features.
Figure 7: Matching query image with the correct panorama
image.
3.3 Implementation Details
The system was implemented using Python language
and the following libraries:
• OpenCV library
3
- for feature detection and
matching
• Tensorflow
4
- for semantic segmentation of the
images
• Celery
5
- for distributing the matching process
among multiple workers
3.3.1 Deployment
To test the performance of the system we created
a Docker image and deployed it to Amazon Light-
sail. Amazon S3 was used as storage for keeping
the persistent data such as the images, neural network
weights and extracted features and descriptors. We
used the most powerful machine provided with 8 vC-
PUs. The CPU used was Intel Xeon E5-2676 v3 with
a base frequency of 2.4 GHz and a turbo boost up to
4.8 GHz. The machine was provided with 32 GB of
memory.
3.3.2 Performance
On average, the system performed the image segmen-
tation in 1 second and the image matching in 19 sec-
onds.
3.4 Dataset
We used 360
◦
panorama images (as seen in figure 8)
from Google Street View to create a dataset by using
the following metadata for each panorama:
• panorama image
• GPS coordinates
• date taken
• camera position (yaw, pitch, roll)
• previous versions of the panorama along with the
date when the image was taken
• neighboring panoramas
For our benchmark, we created the dataset from
552 panoramas with a total of 5.25 km of streets from
the city center of Cluj-Napoca. The average distance
between each panorama is 9.51m.
3
https://opencv.org/
4
https://www.tensorflow.org/
5
http://www.celeryproject.org/
VISAPP 2020 - 15th International Conference on Computer Vision Theory and Applications
272
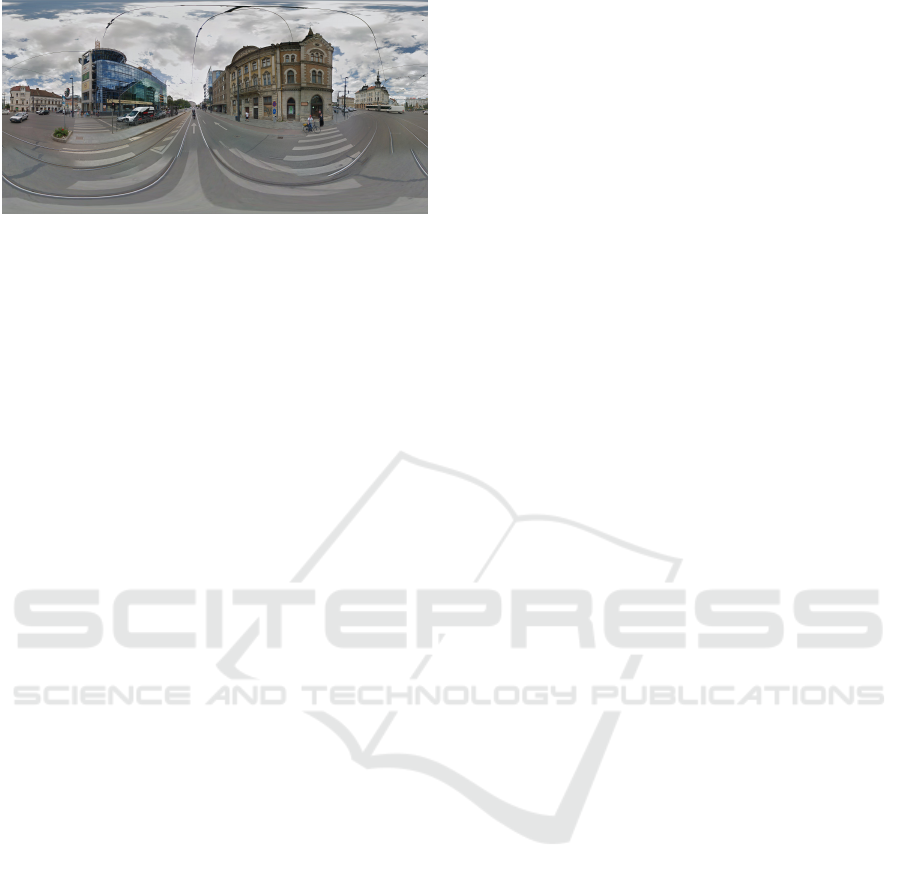
Figure 8: 360
◦
panorama image from Google Street View.
3.5 System Limitations
The system presents some limitations, which inher-
ently has its consequences on the performance and ac-
curacy of it. There are two kinds of limitations: one
is related to the dataset panorama images, while the
other to segmentation. Below are mentioned the main
problems regarding the dataset panorama images:
• blind spots: panoramas with buildings under con-
struction or reconstruction
• false spots: panoramas with buildings whose ap-
pearance has changed
• missing spots: panoramas where buildings are
(mostly) obstructed by other elements of the im-
age (vegetation, traffic).
The limitations due to segmentation refer to the incor-
rect results generated by the segmentation module. In
order to label the images, segmentation is performed,
whose purpose is to generate a mask that represents
the parts of the image that consists of building(s).
Some data from the dataset is not segmented prop-
erly. The type of problems which may arise at this
level are:
• panoramas present buildings that are just partially
labeled
• panoramas present non-building elements that are
labeled as buildings
• panoramas present buildings that are not labeled
4 EXPERIMENTAL RESULTS
4.1 Benchmark
A benchmarking module was implemented to verify
the accuracy and correctness of the results generated
by the LES.
The benchmarking process for a query image con-
sists of the following steps (presented in order):
1. compute all the matches for the query image
2. select the top five matches from the panorama im-
age dataset and take the location of these as the
result (we used a simple score calculation: the
score is given by the total number of supposedly
correct matches between the query image and the
panorama image)
3. compute the distance between each result location
and the correct location (GPS-geotagged) of the
query image
4. take the location of the panorama which has the
minimum distance to the query image’s actual lo-
cation as the system result
This process was applied to each image from the
testing and validation datasets.
4.2 Results
The benchmarking was effectuated on two sepa-
rate sets of data. The testing dataset consists of
cropped and undistorted images extracted from ran-
dom panoramas from the dataset. The validation
dataset consists of images taken in the city of Cluj-
Napoca, by using different devices (mobile phones
and DSLR camera). These validation images were
GPS geo-tagged to be able to get their actual location
and compare it to the result location generated by the
system.
4.2.1 Test Data Results
The test image dataset consists of 100 panoramas or
part of panoramas from the dataset. 95 of the images
were correctly matched with the panorama dataset.
4.2.2 Validation Data Results
The validation data consists of four separate sets of
images taken on different days and conditions. The
total number of validation photos was 109, from
which 91 were considered valid as the result of pre-
processing. The rest were considered invalid due
to not having enough building labeled pixels (under
30%).
The primitive LES refers to raw matching (ex-
tracting features and matching them) of the query im-
age with the original dataset panoramas. The results
were the following:
• 26.37% of the images were estimated with preci-
sion under 25m
• 7.69% of the images were estimated with preci-
sion between 25m and 50m
Location Estimation of an Urban Scene using Computer Vision Techniques
273
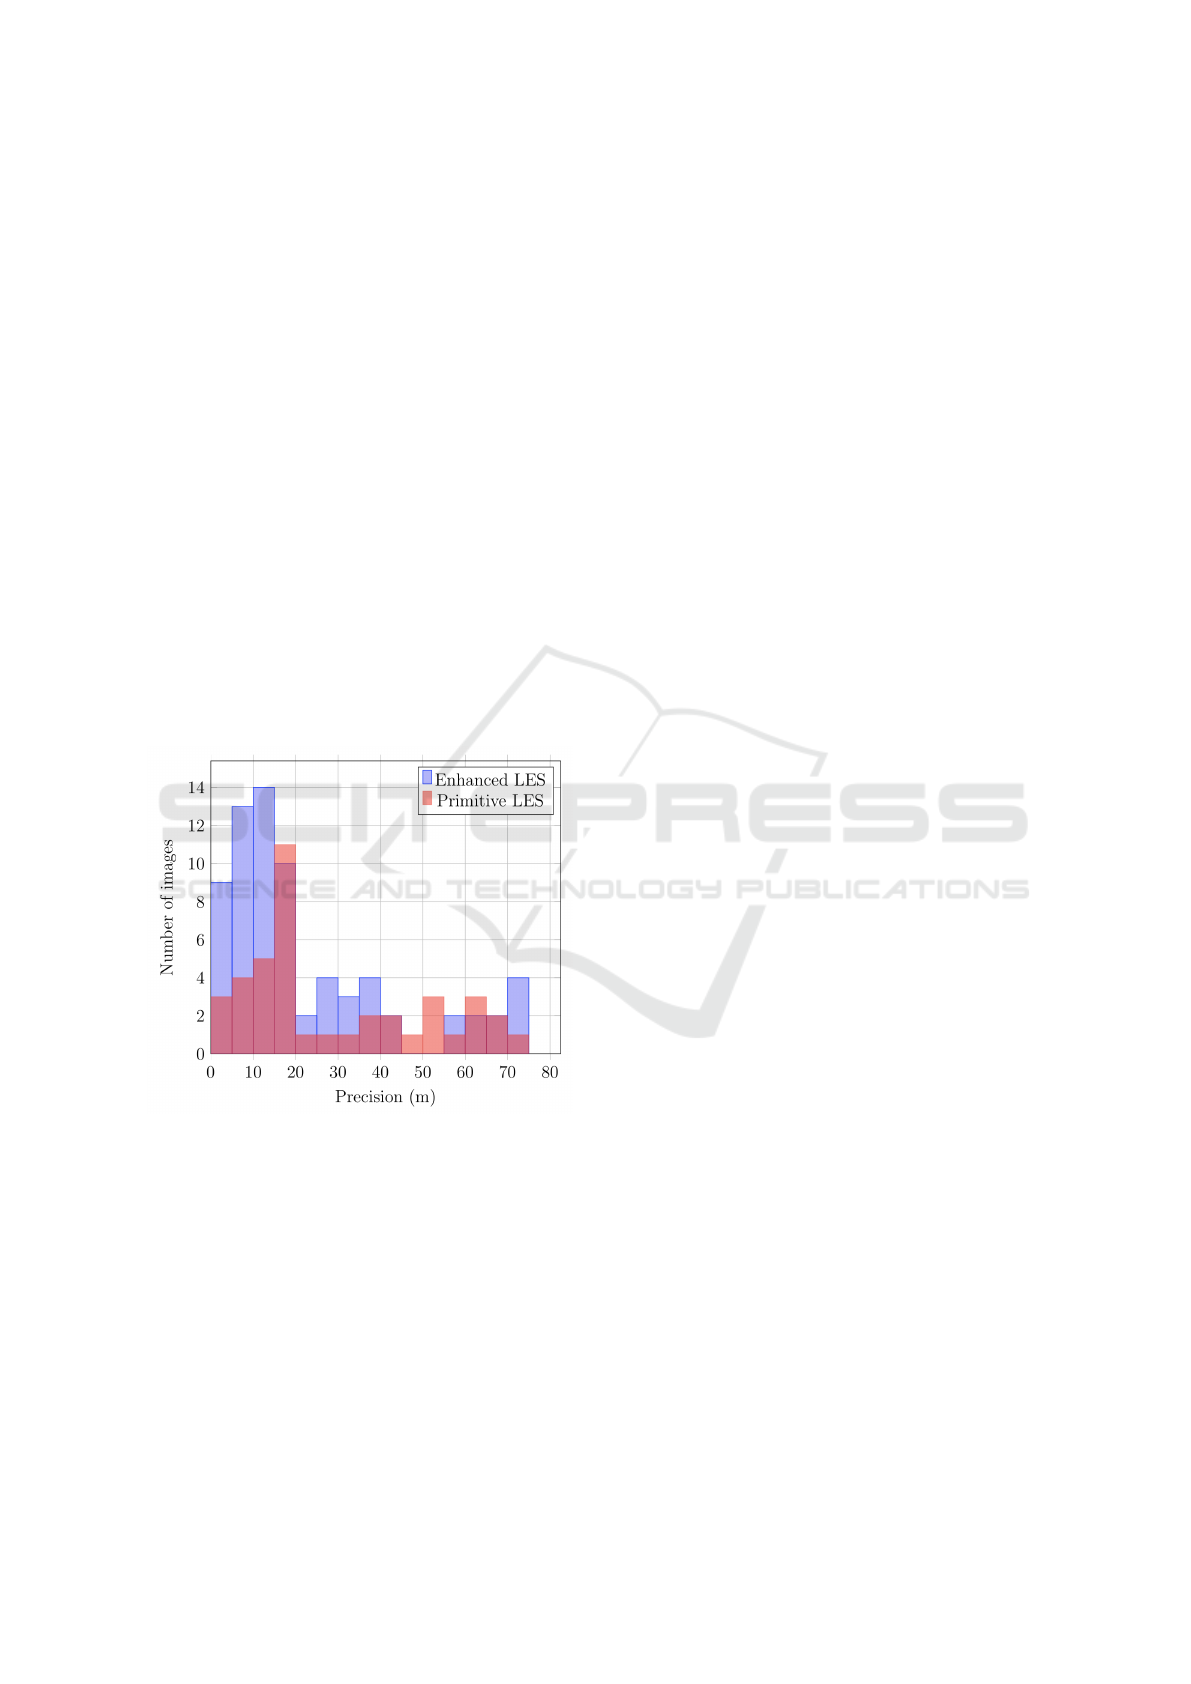
• 10.98% of the images were estimated with preci-
sion between 50m and 75m
• 54.96% of images are estimated with precision
above 75m.
The enhanced LES integrates preprocessing and
segmentation of the images. This means that only
those images are considered valid that have at least
30% of pixels labeled as buildings. The features are
extracted only from pixels that are labeled as build-
ings. The following results are obtained:
• 52.74% of the images were estimated with preci-
sion under 25m
• 14.28% of the images were estimated with preci-
sion between 25m and 50m
• 10.98% of the images were estimated with preci-
sion between 50m and 75m
• 22% of images are estimated with precision above
75m.
These results are illustrated comparatively in fig-
ure 9, which shows the number of images respective
to the precision they were estimated.
Figure 9: Comparison of primitive and enhanced LES.
5 CONCLUSIONS
We have designed and implemented a system that es-
timates the location of an urban scene image based
only on image content (information) analysis.
The motivation behind the location estimation is
related to its possible applications such as law en-
forcement agencies, tourism applications and aug-
mented reality.
The main contributions include the research and
experiments with available state-of-the-art image seg-
mentation architectures, feature extraction and match-
ing techniques. On one hand, these were studied sep-
arately, for maximizing the final system performance
and accuracy. On the other hand, all the previously
mentioned components were combined in such a way,
that leads to a new approach regarding location esti-
mation of a visual urban scene: one based entirely
on computer vision techniques. However, the system
presents some considerable limitations.
It was demonstrated, that with the help of some
additional tools and technologies, the system can be
easily distributed, thus supporting the basis for related
real-time applications.
As further developments, extending dataset pre-
processing could increase the system accuracy. An
adapted and specialized segmentation method could
also induce a potential boost in the performance of
the system. Extending the LES pipeline could also
improve the system behavior. More feature extraction
algorithms and matching techniques could be com-
bined in the process. Additionally, more information
from the dataset could be used, such as the number
of matches of neighboring panoramas and the num-
ber of matches with the previous version of the same
panorama. This would considerably increase the like-
lihood of correct matches.
REFERENCES
Alcantarilla, P. F., Bartoli, A., and Davison, A. J. (2012).
Kaze features. In European Conference on Computer
Vision, pages 214–227. Springer.
Alcantarilla, P. F. and Solutions, T. (2011). Fast ex-
plicit diffusion for accelerated features in nonlinear
scale spaces. IEEE Trans. Patt. Anal. Mach. Intell,
34(7):1281–1298.
Andersson, O. and Marquez, S. (2016). A comparison of
object detection algorithms using unmanipulated test-
ing images : Comparing sift, kaze, akaze and orb. Ex-
amensarbete inom teknik, Grundniv
˚
a.
Lowe, D. G. (1999). Object recognition from local scale-
invariant features. In Proceedings of the Seventh IEEE
International Conference on Computer Vision, vol-
ume 2, pages 1150–1157 vol.2.
Muja, M. and Lowe, D. G. (2009). Fast approximate nearest
neighbors with automatic algorithm configuration. In
International Conference on Computer Vision Theory
and Application VISSAPP’09), pages 331–340. IN-
STICC Press.
Pusztai, Z. and Hajder, L. (2016). Quantitative comparison
of feature matchers implemented in opencv3.
Tareen, S. A. K. and Saleem, Z. (2018). A comparative anal-
ysis of sift, surf, kaze, akaze, orb, and brisk. In 2018
International Conference on Computing, Mathemat-
ics and Engineering Technologies (iCoMET), pages
1–10.
VISAPP 2020 - 15th International Conference on Computer Vision Theory and Applications
274

Zhao, H. (2019). Icnet: Icnet for real-time semantic seg-
mentation on high-resolution image. https://github.
com/hszhao/ICNet.
Zhao, H., Qi, X., Shen, X., Shi, J., and Jia, J. (2018).
Icnet for real-time semantic segmentation on high-
resolution images. Lecture Notes in Computer Sci-
ence, pages 418–434.
Location Estimation of an Urban Scene using Computer Vision Techniques
275
